


Total health inspections
10
Missouri average 6.6
Last Health inspection on Jan 2025
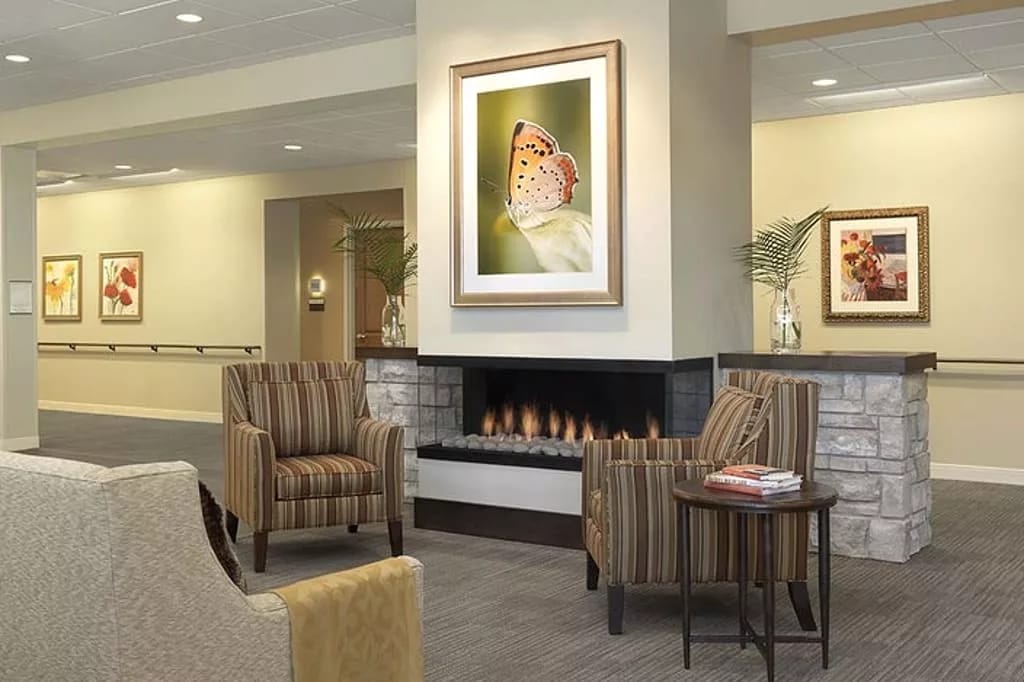
Sherbrooke Village has built a reputation as a leading provider of exceptional care for older adults, with a focus on hospitality and a commitment to creating a seamless living experience. They prioritize the comfort and well-being of their residents above all else. From their carefully crafted wellness programs to their inviting dining options and social activities, they strive to create a warm and welcoming environment that feels like home. But it’s not just their commitment to quality care and hospitality that sets them apart. Their location in the heart of St. Louis, with easy access to all that the vibrant city has to offer, makes them a popular choice among locals as well.
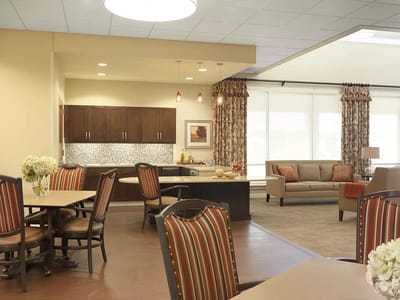
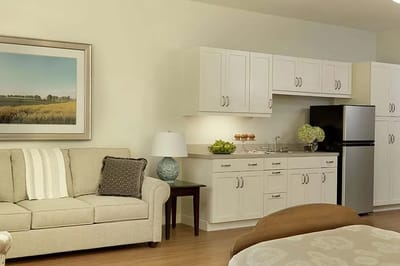
The senior living community provides a wide range of essential services and amenities to ensure that residents receive the care and support they need to live comfortably and independently. Some of these services include daily meals served in the dining room, medication management, care coordination, laundry and housekeeping services, and regular wellness checks by staff members. In addition to these vital services are amenities designed to enhance the quality of life for residents. Some of these amenities include in-room dining services up to three times per month, local transportation up to four times per month, a weekly happy hour, group outings and events, a life enrichment program, and a wellness program. Routine maintenance services are provided to ensure that the community remains safe and comfortable for all residents. Registered dietitian consultation is also available to help residents maintain optimal health and well-being.
| Staff type | Hours / Day / Resident | vs state avg |
|---|---|---|
|
Registered Nurse (RN)
| 24m per day | ▼ 16% State avg: 28m per day · National avg: 41m per day |
|
LPN / LVN
| 1h 3m per day | ▲ 54% State avg: 41m per day · National avg: 52m per day |
|
Nurse Aide
| 3h 42m per day | ▲ 58% State avg: 2h 20m per day · National avg: 2h 21m per day |
|
Weekend Total Nursing
| 4h 14m per day | ▲ 39% State avg: 3h 3m per day · National avg: 3h 26m per day |
|
Physical Therapist
| 2m per day | ▼ 8% State avg: 2m per day · National avg: 4m per day |
|
Weekend RN
| 11m per day | ▼ 47% State avg: 20m per day · National avg: 29m per day |
In Missouri, the Department of Health and Senior Services, Division of Regulation and Licensure performs the inspections and unannounced surveys required for all long-term care providers.
Deficiencies
| This Facility | MO Average | vs. MO Avg |
|---|---|---|---|
|
Total deficiencies
| 48 | 35 | This facility has 37% more total deficiencies than a typical Missouri nursing home (48 vs. MO avg 35).↑ 37% worse |
Missouri average 6.6
Last Health inspection on Jan 2025
Missouri average 36.5
Missouri average 5.67
Health citations are formal notices following inspections when they fail to comply with safety and care standards.
35 of 46 citations resulted from standard inspections; 10 of 46 resulted from complaint investigations; and 1 of 46 came from combined inspections (standard and complaint).
Missouri average: 0.7
Missouri average: 1
Reporting period: October 1 – December 31, 2025 (Q4 2025). Source: CMS Payroll-Based Journal report.
Manages medical care and health needs.
Assists with medical care and medications.
Helps with daily care and mobility.
Total hours from contractors
2,875 contractor hours this quarter
| Certified Nursing Assistant | 95 | 0 | 95 | 29,883 | 92 | 100% | 9.1 |
| Licensed Practical Nurse | 29 | 3 | 32 | 9,828 | 92 | 100% | 9.2 |
| Medication Aide/Technician | 32 | 0 | 32 | 9,068 | 92 | 100% | 9.7 |
| Clinical Nurse Specialist | 8 | 0 | 8 | 2,024 | 64 | 70% | 8 |
| Registered Nurse | 11 | 0 | 11 | 1,594 | 77 | 84% | 10.9 |
| RN Director of Nursing | 5 | 0 | 5 | 1,256 | 64 | 70% | 8 |
| Other Dietary Services Staff | 5 | 0 | 5 | 1,208 | 88 | 96% | 8.3 |
| Speech Language Pathologist | 0 | 7 | 7 | 990 | 74 | 80% | 6.6 |
| Physical Therapy Aide | 0 | 4 | 4 | 779 | 69 | 75% | 5.9 |
| Dietitian | 1 | 0 | 1 | 541 | 62 | 67% | 8.7 |
| Nurse Practitioner | 1 | 0 | 1 | 536 | 67 | 73% | 8 |
| Dental Services Staff | 1 | 0 | 1 | 528 | 57 | 62% | 9.3 |
| Administrator | 1 | 0 | 1 | 480 | 60 | 65% | 8 |
| Physical Therapy Assistant | 0 | 4 | 4 | 363 | 71 | 77% | 5 |
| Qualified Social Worker | 0 | 3 | 3 | 329 | 63 | 68% | 5.2 |
| Respiratory Therapy Technician | 0 | 3 | 3 | 325 | 68 | 74% | 4.7 |
| Occupational Therapy Aide | 1 | 0 | 1 | 104 | 13 | 14% | 8 |
| Medical Director | 0 | 1 | 1 | 39 | 13 | 14% | 3 |
| Occupational Therapy Assistant | 0 | 1 | 1 | 24 | 3 | 3% | 8 |
Federal penalties imposed by CMS for regulatory violations, including civil money penalties (fines) and denials of payment for new Medicare/Medicaid admissions.
Source: CMS Penalties Database
No penalties in the past 3 years
No civil money penalties or payment denials were reported in the last 3 years.
These measures show how residents usually do over time at this home, based on health outcomes and preventive care.
Missouri average: 10.9
Missouri average: 19.5
Missouri average: 19.8%
Missouri average: 20.6%
Missouri average: 18.1%
Missouri average: 4.0%
Missouri average: 5.0%
Missouri average: 2.7%
Missouri average: 5.6%
Missouri average: 12.8%
Missouri average: 22.0%
Missouri average: 85.2%
Missouri average: 90.9%
Missouri average: 2.08
Missouri average: 2.35
Missouri average: 66.6%
Missouri average: 2.2%
Missouri average: 63.5%
Missouri average: 25.3%
Missouri average: 13.4%
Missouri average: 0.8%
Missouri average: 53.7%
Missouri average: 50.6%
Quality measures are calculated from Minimum Data Set (MDS) assessments. For most measures, lower percentages indicate better care quality.
18% of new residents, usually for short-term rehab.
82% of new residents, often for short stays.
Source: CMS Long-Term Care Facility Characteristics (Data as of Jan 2026)
Residents meet regularly to discuss policies, care quality, and activities
Organized group of residents that meets regularly to discuss facility policies, quality of life, and activities.
Data sourced from CMS Long-Term Care Facility Characteristics quarterly report. Payer mix reflects the current resident census by primary payment source.
Historical financial and operational data for Ascension Living Sherbrooke Village from 2011–2024, based on CMS SNF Cost Reports.
Key figures below are for fiscal year ending in 06/2024.
Based on CMS SNF Cost Report for fiscal year ending in 06/2024.
Pets Allowed
Residents typically stay for brief periods, with frequent admissions and discharges throughout the year.
Most new residents arrive under private pay (82% of admissions), and a typical private pay stay runs around 4 - 5 months.
Coverage residents most often arrive under.
Coverage residents most often leave under.
![]() 8.5 miles from city center
8.5 miles from city center
![]() Estimated distance in miles from St. Louis's city center to Ascension Living Sherbrooke Village's address, calculated via Google Maps.
— 4.72 miles to nearest hospital (Mercy Hospital South)
Estimated distance in miles from St. Louis's city center to Ascension Living Sherbrooke Village's address, calculated via Google Maps.
— 4.72 miles to nearest hospital (Mercy Hospital South)
Add your location
The information below is reported by the Missouri Department of Health and Senior Services, Division of Regulation and Licensure.
| Laclede Groves | AL IL MC NH | St. Louis | 251
Facility
251
MO AVG
96
Rank
#3 / 450 |
40.8%
Facility
40.8%
MO AVG
65.1
Rank
#366 / 418 | -37% | 5.27
Facility
5.27
MO AVG
3.74
Rank
#19 / 280 | +48% | +41% | $0
Facility
$0
MO AVG
$76.9k
Rank
#1 / 286 | 9
Facility
9
MO AVG
36.5
Rank
#10 / 284 | 4.5
Facility
4.5
MO AVG
5.7
Rank
#104 / 284 | - | 103 | - |
35
Facility
35
MO AVG
45
Rank
#356 / 563 | John Komlos | $24.9MFiscal year ending 12/2023
Facility
$24.9MFiscal year ending 12/2023
MO AVG
$8.4M
Rank
#4 / 290 | $27.4MFiscal year ending 12/2023
Facility
$27.4MFiscal year ending 12/2023
MO AVG
$3.3M
Rank
#2 / 290 | 109.9%Fiscal year ending 12/2023
Facility
109.9%Fiscal year ending 12/2023
MO AVG
45.6%
Rank
#196 / 290 | 265600 | ||||
| Cottages of Lake St. Louis | AL NH SNF | Lake St Louis (Lake Saint Louis) | 60
Facility
60
MO AVG
96
Rank
#340 / 450 |
81.7%
Facility
81.7%
MO AVG
65.1
Rank
#92 / 418 | +26% | 6.04
Facility
6.04
MO AVG
3.74
Rank
#6 / 280 | -32% | +62% | $17.7k
Facility
$17.7k
MO AVG
$76.9k
Rank
#197 / 286 | 11
Facility
11
MO AVG
36.5
Rank
#24 / 284 | 2.8
Facility
2.8
MO AVG
5.7
Rank
#22 / 284 | 2 | 49 | - |
13
Facility
13
MO AVG
45
Rank
#486 / 563 | Cottages Master LLC | $8.9MFiscal year ending 12/2023
Facility
$8.9MFiscal year ending 12/2023
MO AVG
$8.4M
Rank
#75 / 290 | $4.9MFiscal year ending 12/2023
Facility
$4.9MFiscal year ending 12/2023
MO AVG
$3.3M
Rank
#71 / 290 | 55.4%Fiscal year ending 12/2023
Facility
55.4%Fiscal year ending 12/2023
MO AVG
45.6%
Rank
#137 / 290 | 265860 | ||||
| Ascension Living Sherbrooke Village | AL ADC HC IL MC NH SNF | St. Louis (Ripa Avenue) | 149
Facility
149
MO AVG
96
Rank
#54 / 450 |
61.7%
Facility
61.7%
MO AVG
65.1
Rank
#250 / 418 | -5% | 4.27
Facility
4.27
MO AVG
3.74
Rank
#66 / 280 | -34% | +14% | $0
Facility
$0
MO AVG
$76.9k
Rank
#1 / 286 | 46
Facility
46
MO AVG
36.5
Rank
#213 / 284 | 4.6
Facility
4.6
MO AVG
5.7
Rank
#107 / 284 | 2 | 92 | - |
29
Facility
29
MO AVG
45
Rank
#396 / 563 | - | $12.0MFiscal year ending 06/2024
Facility
$12.0MFiscal year ending 06/2024
MO AVG
$8.4M
Rank
#26 / 290 | $5.2MFiscal year ending 06/2024
Facility
$5.2MFiscal year ending 06/2024
MO AVG
$3.3M
Rank
#11 / 290 | 43.7%Fiscal year ending 06/2024
Facility
43.7%Fiscal year ending 06/2024
MO AVG
45.6%
Rank
#89 / 290 | 265417 | ||||
| River Crossing Rehab and Healthcare Center | AL HOS MC NH PC SNF | St. Louis (Dunn Loring) | 120
Facility
120
MO AVG
96
Rank
#87 / 450 |
73.2%
Facility
73.2%
MO AVG
65.1
Rank
#159 / 418 | +12% | 3.34
Facility
3.34
MO AVG
3.74
Rank
#204 / 280 | -45% | -11% | $0
Facility
$0
MO AVG
$76.9k
Rank
#1 / 286 | 36
Facility
36
MO AVG
36.5
Rank
#175 / 284 | 5.1
Facility
5.1
MO AVG
5.7
Rank
#139 / 284 | 1 | 88 | - |
1
Facility
1
MO AVG
45
Rank
#549 / 563 | River Crossing Holdco LLC | $6.7M*Fiscal year ending 11/2022These figures are from this home's most recent complete cost report — an older period than most facilities report. Compare with that in mind.
Facility
$6.7M*Fiscal year ending 11/2022These figures are from this home's most recent complete cost report — an older period than most facilities report. Compare with that in mind.
MO AVG
$8.4M
Rank
#140 / 290 | $4.3M*Fiscal year ending 11/2022These figures are from this home's most recent complete cost report — an older period than most facilities report. Compare with that in mind.
Facility
$4.3M*Fiscal year ending 11/2022These figures are from this home's most recent complete cost report — an older period than most facilities report. Compare with that in mind.
MO AVG
$3.3M
Rank
#85 / 290 | 64.8%*Fiscal year ending 11/2022These figures are from this home's most recent complete cost report — an older period than most facilities report. Compare with that in mind.
Facility
64.8%*Fiscal year ending 11/2022These figures are from this home's most recent complete cost report — an older period than most facilities report. Compare with that in mind.
MO AVG
45.6%
Rank
#33 / 290 | 265457 | ||||
| St Louis Altenheim | AL IL MC NH RC SNF | St. Louis (Carondelet) | 48
Facility
48
MO AVG
96
Rank
#395 / 450 |
89.6%
Facility
89.6%
MO AVG
65.1
Rank
#36 / 418 | +38% | 3.97
Facility
3.97
MO AVG
3.74
Rank
#101 / 280 | - | +6% | $0
Facility
$0
MO AVG
$76.9k
Rank
#1 / 286 | - | - | - | 43 | A+ |
39
Facility
39
MO AVG
45
Rank
#329 / 563 | Malik St Louis LLC | - | - | - | 26A484 |
Ascension Living Sherbrooke Village is located in St. Louis, Missouri.
Here are the financial assistance programs available to residents in Missouri.
Ascension Living Sherbrooke Village is in the Ripa Avenue neighborhood of St. Louis.
Ascension Living Sherbrooke Village has a walk score of 29. Somewhat walkable. A few nearby services may be reachable on foot, but most trips require transportation.
Ascension Living Sherbrooke Village's occupancy is 53.6%.
Ascension Living Sherbrooke Village has been operating for approximately 34 years, based on available licensing and registration records.
Yes, Ascension Living Sherbrooke Village allows residents to bring their pets.
Ascension Living Sherbrooke Village is registered as a non-profit in MO.
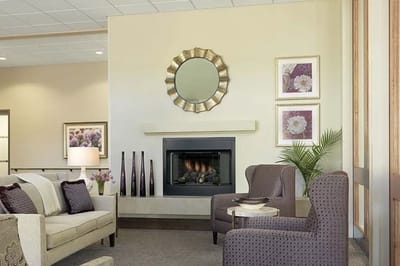
Yes — there are 4 photos of Ascension Living Sherbrooke Village in the photo gallery on this page.
Care Cost Calculator: See Prices in Your Area
Nursing Home Data Explorer
Don’t Wait Too Long: 7 Red Flag Signs Your Parent Needs Assisted Living Now
The True Cost of Assisted Living in 2025 – And How Families Are Paying For It
Understanding Senior Living Costs: Pricing Models, Discounts & Financial Assistance


