Laclede Groves
Nursing Home, Assisted Living, Independent Living & Memory Care · St. Louis, MO
CMS overall rating Info CMS (the Centers for Medicare & Medicaid Services) is the federal agency that rates nursing home quality. Its Overall Rating runs from 1 to 5 stars, combining health inspections, staffing, and quality measures, with inspections weighted most heavily.

Laclede Groves

Nursing Home, Assisted Living, Independent Living & Memory Care · St. Louis, MO
CMS overall rating Info CMS (the Centers for Medicare & Medicaid Services) is the federal agency that rates nursing home quality. Its Overall Rating runs from 1 to 5 stars, combining health inspections, staffing, and quality measures, with inspections weighted most heavily.
Calculator: See prices in your area
Laclede Groves accepts Medicare, Medicaid, and private pay.

Overview of Laclede Groves

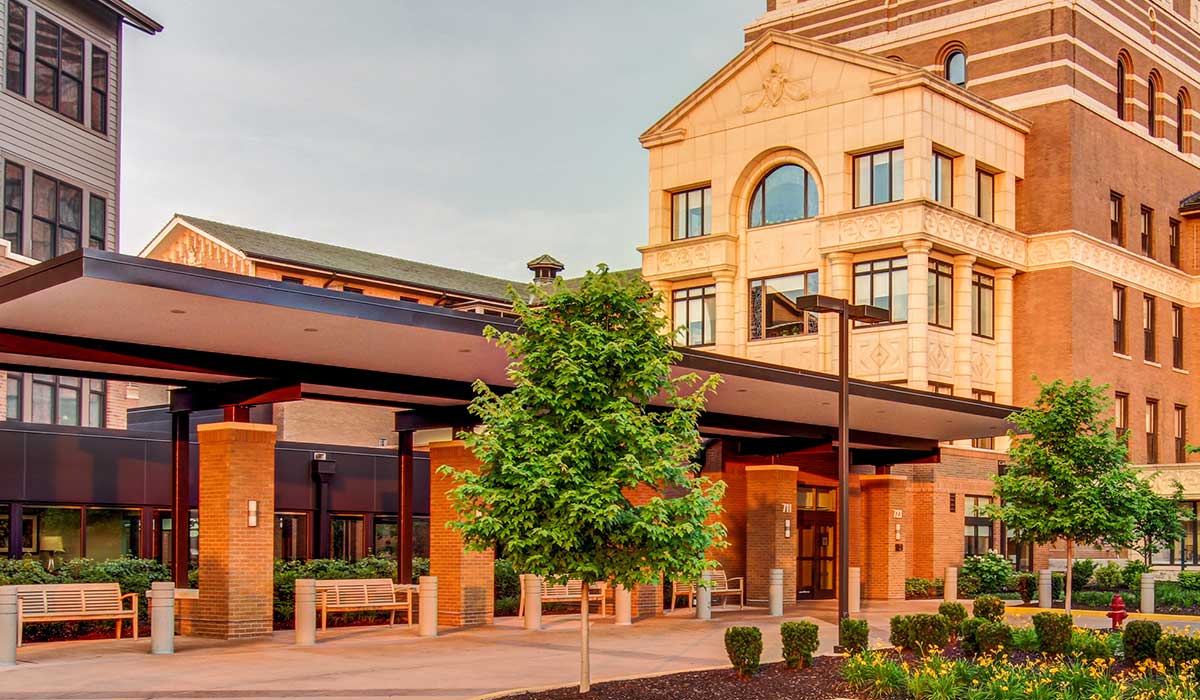
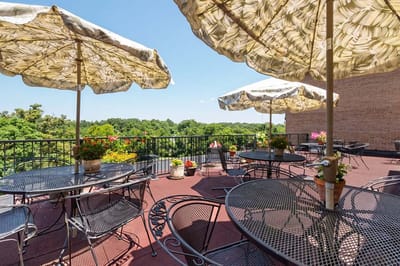
At Laclede Groves, the premier life plan and assisted living community nestled within Webster Groves, Missouri, residents experience purpose, joy, and choice. In a close-knit and caring environment, the community prioritizes seniors’ well-being, fostering meaningful connections and worry-free living. Laclede Groves’ mission is to empower older adults in Webster Groves and beyond, promoting a lifestyle that enhances the mind, body, and spirit.

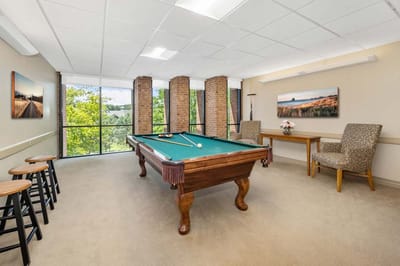
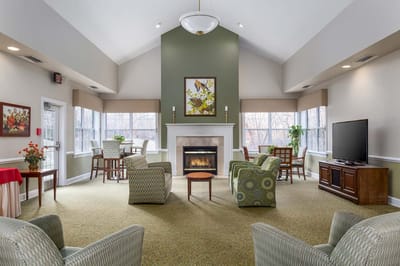
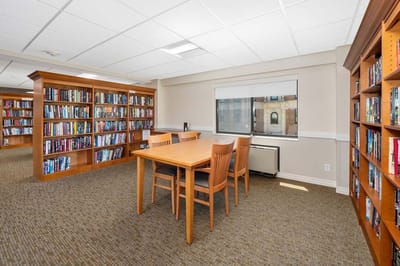
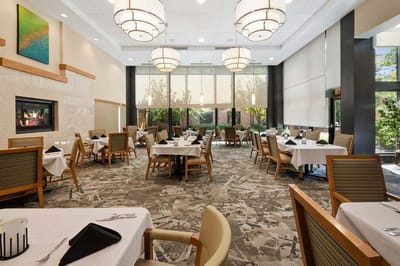
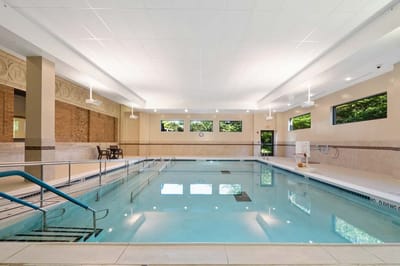
Residents discover a comprehensive continuum of quality senior and assisted living facilities and care conveniently located all in one place. Laclede Groves offers independent living, assisted living, memory care assisted living, skilled nursing, and long-term care options. The community features multiple dining venues, indoor pools, fitness centers, a movie theater, an ice cream parlor, an art studio, a historic chapel, a health clinic, and more. Situated near Webster Groves, Kirkwood, Shrewsbury, and St. Louis attractions, Laclede Groves ensures a harmonious and fulfilling senior living experience.

Quality ratings

Measured by Centers for Medicare & Medicaid Services (CMS)

Overall rating Info The Overall CMS Rating combines results from health inspections, staffing levels and quality measures. Health inspections carry the most weight. Staffing and quality scores can increase or decrease the final rating based on performance compared to state and national standards.
▲ 101.3% Above MO avg. ▲ 101.3% Above MO avg.MO average: 2.5Click the badge to see the full State ranking.Click here to see the full State ranking.
Health Inspection Info Based on the results of the facility's three most recent standard inspections and any complaint investigations. CMS reviews the number, scope, and severity of deficiencies, with more recent findings weighted more heavily.
▲ 44.2% Above MO avg. ▲ 44.2% Above MO avg.MO average: 2.8Click the badge to see the full State ranking.Click here to see the full State ranking.
Staffing Info Measures average nursing staff hours per resident per day, including Registered Nurses (RNs) and total nursing staff. Ratings are adjusted based on the level of care residents require and are compared to state and national benchmarks.
▲ 128.5% Above MO avg. ▲ 128.5% Above MO avg.MO average: 2.2Click the badge to see the full State ranking.Click here to see the full State ranking.
Quality Measures Info Based on clinical and physical health indicators reported to CMS, such as hospital readmissions, falls, pressure ulcers, and improvements in mobility. These measures reflect how well residents' health needs are being managed.
▲ 88.1% Above MO avg. ▲ 88.1% Above MO avg.MO average: 2.7Click the badge to see the full State ranking.Click here to see the full State ranking.

Staffing hours breakdown

Info Daily nursing hours per resident by staff type, reported to CMS. Higher is generally better — compare this facility to state and national averages to see where staffing stands.

Hours per resident per day — compared to Missouri state averages

Total nursing care / resident Info This home is ranked 19th out of 282 homes in Missouri for nurse hours. Total adjusted nursing hours per resident per day, combining RN, LPN, and aide time. CMS adjusts this for case-mix so facilities can be fairly compared.
5h 16m per day
Rank #19 / 282Nurse hours — State benchmarkedThis home is ranked 19th out of 282 homes in Missouri. Shows adjusted nurse hours per resident per day benchmarked to the Missouri average, with a ranking across 282 Missouri facilities. More hours mean more direct care. The national average is about 3.5 hrs; below 3.0 is a red flag.Rankings are based only on facilities in Missouri that report data for that category. Facilities without available data are excluded from the ranking.Click the rank badge to see the full State ranking.Click here to see the full State ranking.
This facility Missouri avg (3h 44m per day)
vs Missouri avg
+41%

1 of 6 metrics below state avg

Standout metric Weekend RN is +133% above state avg
Staff typeHours / Day / Residentvs state avg
Registered Nurse (RN) Info RNs hold the highest nursing license and can assess residents, interpret test results, and direct care plans. More RN hours per day often signals stronger clinical oversight and faster response to health changes. 56m per day ▲ 103% State avg: 28m per day · National avg: 41m per day
LPN / LVN Info Licensed Practical Nurses (LPNs) or Licensed Vocational Nurses (LVNs) deliver routine hands-on care — medication administration, wound dressing, and monitoring vital signs. They work under RN supervision and make up a large share of daily bedside care. 58m per day ▲ 43% State avg: 41m per day · National avg: 52m per day
Nurse Aide Info Certified Nurse Aides (CNAs) provide the most direct day-to-day assistance: bathing, dressing, feeding, and mobility. Nurse aide hours are typically the largest staffing category and directly affect residents' quality of life. 3h 15m per day ▲ 40% State avg: 2h 19m per day · National avg: 2h 20m per day
Weekend Total Nursing Info Combined nursing hours (RN + LPN + Nurse Aide) per resident per day on weekends. Staffing often drops on weekends — this figure reveals whether the facility maintains adequate coverage outside of weekday hours. 4h 49m per day ▲ 58% State avg: 3h 3m per day · National avg: 3h 27m per day
Physical Therapist Info Hours per resident per day provided by licensed Physical Therapists (PTs) or PT Assistants. PT services help residents recover mobility after injury or illness and are especially important for post-acute (short-stay) rehabilitation. 0m per day ▼ 100% State avg: 3m per day · National avg: 4m per day
Weekend RN Info Registered nurse hours specifically on weekends. Facilities sometimes reduce RN presence on Saturdays and Sundays — a low weekend RN figure compared to weekday hours can indicate reduced clinical oversight when most administrative staff are absent. 46m per day ▲ 133% State avg: 20m per day · National avg: 29m per day

Capacity and availability

This home usually has availability

Higher occupancy than the Missouri average: 66.6%
Occupancy rate
69.7% Rank #191 / 434Occupancy rate — State benchmarkedThis home is ranked 191st out of 434 homes in Missouri. Shows this facility's occupancy rate versus the Missouri average, with its Statewide rank out of 434. Higher occupancy signals strong local demand and financial stability.Rankings are based only on facilities in Missouri that report data for that category. Facilities without available data are excluded from the ranking.Click the rank badge to see the full State ranking.Click here to see the full State ranking.
Avg. Length of Stay
35 days
Bed community size
251-bed community Rank #3 / 454Bed count — State benchmarkedThis home is ranked 3rd out of 454 homes in Missouri. Shows this facility's certified or reported bed count compared to other Missouri facilities. Larger communities may offer more amenities, programs, and on-site services for residents and families.Rankings are based only on facilities in Missouri that report data for that category. Facilities without available data are excluded from the ranking.Click the rank badge to see the full State ranking.Click here to see the full State ranking.
A large-scale community that may provide a wide range of amenities, services, and structured programs.
Walk Score
Walk Score: 35 / 100 Rank #356 / 563Walk Score — State benchmarkedThis home is ranked 356th out of 563 homes in Missouri. Shows how walkable this facility's neighborhood is compared to the average Walk Score across Missouri facilities. Higher scores benefit residents, families, and staff.Rankings are based only on facilities in Missouri that report data for that category. Facilities without available data are excluded from the ranking.Click the rank badge to see the full State ranking.Click here to see the full State ranking.
Somewhat walkable. A few nearby services may be reachable on foot, but most trips require transportation.

Contact Laclede Groves

Staffing Data

Reporting period: October 1 – December 31, 2025 (Q4 2025). Source: CMS Payroll-Based Journal report.

Total staff 167
Employees 167
Contractors 0
Staff to resident ratio 1.69 : 1
0% compared with Missouri average
Missouri average ratio: 1.69 : 1 Missouri average ratio: 1.69 : 1See full Missouri ranking
Avg staff/day 73
Average shift 7.3 hours
10% worse than Missouri average
Missouri average: 8.1 hours Missouri average shift: 8.1 hoursSee full Missouri ranking
Total staff hours (quarter) 49,025

Nursing staff breakdown

Q4 2025 · Oct 1 – Dec 31 More info This data comes from the CMS Payroll-Based Journal report covering October 1 – December 31, 2025.
Registered Nurse

Manages medical care and health needs.

RN Staff Info All 19 RN Staff are full-time employees. No contractors work on this role. 19
Average shift length Info Average shift length. Calculated as total hours divided by days worked and average staff per day. 7.5 hours
Licensed Practical Nurse

Assists with medical care and medications.

LPN Staff Info All 24 LPN Staff are full-time employees. No contractors work on this role. 24
Average shift length Info Average shift length. Calculated as total hours divided by days worked and average staff per day. 7.5 hours
Certified Nursing Assistant

Helps with daily care and mobility.

CNA Staff Info All 74 CNA Staff are full-time employees. No contractors work on this role. 74
Average shift length Info Average shift length. Calculated as total hours divided by days worked and average staff per day. 7.2 hours

Contractor staffing

Q4 2025 · Oct 1 – Dec 31 More info This data comes from the CMS Payroll-Based Journal report covering October 1 – December 31, 2025.
Total hours from contractors 0% — all staff are direct employees this quarter

Staff by category

Q4 2025 · Oct 1 – Dec 31 More info This data comes from the CMS Payroll-Based Journal report covering October 1 – December 31, 2025.
Certified Nursing Assistant7407420,45792100%7.2
Medication Aide/Technician3203210,12692100%7.3
Licensed Practical Nurse240247,97492100%7.5
Registered Nurse190195,06892100%7.5
Clinical Nurse Specialist100103,2829199%7.7
RN Director of Nursing6061,2147480%8
Nurse Practitioner1014565762%8
Administrator1014485661%8
74 Certified Nursing Assistant
% of Days 100%
32 Medication Aide/Technician
% of Days 100%
24 Licensed Practical Nurse
% of Days 100%
19 Registered Nurse
% of Days 100%
10 Clinical Nurse Specialist
% of Days 99%
6 RN Director of Nursing
% of Days 80%
1 Nurse Practitioner
% of Days 62%
1 Administrator
% of Days 61%

Penalties and fines

Federal penalties imposed by CMS for regulatory violations, including civil money penalties (fines) and denials of payment for new Medicare/Medicaid admissions.

Source: CMS Penalties Database

No penalties in the past 3 years

No civil money penalties or payment denials were reported in the last 3 years.

Quality of care over time

These measures show how residents usually do over time at this home, based on health outcomes and preventive care.

High-risk clinical events score Info A composite score based on pressure ulcers, falls with injury, weight loss, walking ability decline, and activities of daily living decline. 10.4
In line with Missouri average

Missouri average: 10.9

Functional decline score Info A composite score based on activities of daily living decline, walking ability decline, and incontinence. 18.6
In line with Missouri average

Missouri average: 19.5

Long-stay resident measures
Need for Help with Daily Activities Increased Info Percent of long-stay residents whose need for help with daily activities has increased 11.8%
40% better than Missouri average

Missouri average: 19.8%

Walking Ability Worsened Info Percent of long-stay residents whose ability to move independently worsened 20.3%
In line with Missouri average

Missouri average: 20.6%

Low Risk Residents with Bowel/Bladder Incontinence Info Percent of low risk long-stay residents who lose control of their bowels or bladder 23.9%
32% worse than Missouri average

Missouri average: 18.1%

Falls with Major Injury Info Percent of long-stay residents experiencing one or more falls with major injury 5.0%
25% worse than Missouri average

Missouri average: 4.0%

High Risk Residents with Pressure Ulcers Info Percent of long-stay high risk residents with pressure ulcers 5.0%
In line with Missouri average

Missouri average: 5.0%

Urinary Tract Infection Info Percent of long-stay residents with a urinary tract infection 3.6%
34% worse than Missouri average

Missouri average: 2.7%

Lost Too Much Weight Info Percent of long-stay residents who lose too much weight 10.0%
80% worse than Missouri average

Missouri average: 5.6%

Depressive Symptoms Info Percent of long-stay residents who have depressive symptoms 1.4%
89% better than Missouri average

Missouri average: 12.8%

Antipsychotic Use Info Percent of long-stay residents who received an antipsychotic medication 14.6%
34% better than Missouri average

Missouri average: 22.0%

Pneumococcal Vaccine Info Percent of long-stay residents assessed and appropriately given the pneumococcal vaccine 96.4%
13% better than Missouri average

Missouri average: 85.2%

Influenza Vaccine Info Percent of long-stay residents assessed and appropriately given the seasonal influenza vaccine 93.6%
In line with Missouri average

Missouri average: 90.9%

Short-stay resident measures
Pneumococcal Vaccine Info Percent of short-stay residents assessed and appropriately given the pneumococcal vaccine 72.4%
9% better than Missouri average

Missouri average: 66.6%

Antipsychotic medication increase Info Percent of short-stay residents who newly received an antipsychotic medication 1.9%
14% better than Missouri average

Missouri average: 2.2%

Influenza Vaccine Info Percent of short-stay residents assessed and appropriately given the seasonal influenza vaccine 80.5%
27% better than Missouri average

Missouri average: 63.5%

Breakdown by payment type

Medicare

43% of new residents, usually for short-term rehab.

Typical stay 2 months

Private pay

55% of new residents, often for short stays.

Typical stay 6 - 7 months

Medicaid

1% of new residents, often for long-term daily care.

Typical stay 12 - 13 years

Facility Characteristics

Source: CMS Long-Term Care Facility Characteristics (Data as of Jan 2026)

Total residents 99
Medicare
8
8.1% of residents
Medicaid
27
27.3% of residents
Private pay or other
64
64.6% of residents
Programs & Services
Residents Group

Residents meet regularly to discuss policies, care quality, and activities

CCRC

Part of a Continuing Care Retirement Community offering multiple care levels

Active Resident Council

Organized group of residents that meets regularly to discuss facility policies, quality of life, and activities.

Finances and operations

Based on CMS SNF Cost Report for fiscal year ending in 12/2023.

For-profit
Corporation
Net patient revenue Info Net patient revenue — what the home actually collects for resident care, after contractual allowances, bad debt and discounts are subtracted from its gross charges (CMS cost report, Worksheet G-3). It covers resident care only; money the home earns from other sources is shown separately as "Other income."
$24.9M
Net patient income Info Net patient income: net patient revenue minus the home's total operating expenses. A positive figure means it earns more from resident care than it spends to deliver it; a negative figure means the opposite. It excludes non-operating "other income."
-$30.9M
For-profit Corporation
Net patient revenue Info Net patient revenue — what the home actually collects for resident care, after contractual allowances, bad debt and discounts are subtracted from its gross charges (CMS cost report, Worksheet G-3). It covers resident care only; money the home earns from other sources is shown separately as "Other income."
$24.9M Rank #4 / 292Revenue — State benchmarkedThis home is ranked 4th out of 292 homes in Missouri. Shows this facility's annual revenue compared to the Missouri average. Higher revenue generally means more resources for staffing and capital — read alongside Payroll %.Rankings are based only on facilities in Missouri that report data for that category. Facilities without available data are excluded from the ranking.Click the rank badge to see the full State ranking.Click here to see the full State ranking.
Net patient income Info Net patient income: net patient revenue minus the home's total operating expenses. A positive figure means it earns more from resident care than it spends to deliver it; a negative figure means the opposite. It excludes non-operating "other income."
-$30.9M
Other income Info Money the home earns outside of resident care — such as investments, grants, rentals and other non-operating sources (CMS cost report, Worksheet G-3). It is tracked separately from net patient revenue: it is not part of that figure, and it is not included in net patient income.
$32.5M
Payroll costs Info Staff salaries plus wage-related costs — benefits such as payroll taxes, health insurance and retirement — from the home's own accounting records (CMS cost report, Worksheet A). Contract or agency labor is counted separately, under other operating costs. Rank #2 / 292Payroll — State benchmarkedThis home is ranked 2nd out of 292 homes in Missouri. Shows total annual staff payroll benchmarked to the Missouri average. Higher payroll investment relative to peers often signals better staffing and less reliance on cheaper contract labor.Rankings are based only on facilities in Missouri that report data for that category. Facilities without available data are excluded from the ranking.Click the rank badge to see the full State ranking.Click here to see the full State ranking.
$27.4M 109.9% of net patient revenue Info Payroll as a share of revenue: staff salaries and wage-related benefits divided by net patient revenue. A higher figure means more of each revenue dollar goes to staff pay. Rank #192 / 292Payroll % — State benchmarkedThis home is ranked 192nd out of 292 homes in Missouri. Shows payroll as a percentage of revenue versus the Missouri average. Well-run Missouri facilities typically land around 60–71% — the top third Statewide. Below 25% may signal understaffing or heavy agency use — read with Staffing ratings.Rankings are based only on facilities in Missouri that report data for that category. Facilities without available data are excluded from the ranking.Click the rank badge to see the full State ranking.Click here to see the full State ranking.
Other operating costs Info Everything it costs to run the home apart from payroll — food, utilities, supplies, maintenance, contract labor and administration. Calculated as total operating expense minus payroll (staff salaries and wage-related benefits).
$28.4M
Total costs Info The home's total operating expense for the year — all the costs of running it, salaries included (CMS cost report, Worksheet G-3).
$55.9M

Who this home usually serves

TYPE OF STAY

Mix of rehab and long-term care

This home supports both short-term rehab and long-term care, with residents staying for a wide range of durations.

Most new residents arrive under private pay (55% of admissions), and a typical private pay stay runs around 6 - 7 months.

Admissions
358 total

Coverage residents most often arrive under.

Medicare 43%
Private pay 55%
Medicaid 1%
Discharges
365 total

Coverage residents most often leave under.

Medicare 38%
Private pay 58%
Medicaid 4%

Places of interest near Laclede Groves

Address 8.5 miles from city center Info Estimated distance in miles from St. Louis's city center to Laclede Groves's address, calculated via Google Maps. — 4.25 miles to nearest hospital (SSM Health St. Mary's Hospital - St. Louis)

Calculate Travel Distance to Laclede Groves

Add your location

Address

Compare Nursing Homes around St Louis

The information below is reported by the Missouri Department of Health and Senior Services, Division of Regulation and Licensure.

5 facilities compared · CMS & MO Dept. of Health data

Laclede Groves
NH
AL
IL
MC
St. Louis
251
Facility 251
MO AVG 97
Rank #3 / 454
69.7%
Facility 69.7%
MO AVG 66.6%
Rank #191 / 434
+5%
5.27
Facility 5.27
MO AVG 3.74
Rank #19 / 282
+48%+41%
$0
Facility $0
MO AVG $76.9k
Rank #1 / 289
9
Facility 9
MO AVG 36.5
Rank #11 / 287
4.5
Facility 4.5
MO AVG 5.7
Rank #105 / 287
-103-
35
Facility 35
MO AVG 45
Rank #356 / 563
John Komlos
$24.9M
Facility $24.9M
MO AVG $8.4M
Rank #4 / 292
$27.4M
Facility $27.4M
MO AVG $3.3M
Rank #2 / 292
109.9%
Facility 109.9%
MO AVG 45.6%
Rank #192 / 292
265600
Cottages of Lake St. Louis
NH
Lake St Louis (Lake Saint Louis)
60
Facility 60
MO AVG 97
Rank #343 / 454
81.7%
Facility 81.7%
MO AVG 66.6%
Rank #97 / 434
+23%
6.04
Facility 6.04
MO AVG 3.74
Rank #6 / 282
-32%+62%
$17.7k
Facility $17.7k
MO AVG $76.9k
Rank #199 / 289
11
Facility 11
MO AVG 36.5
Rank #25 / 287
2.8
Facility 2.8
MO AVG 5.7
Rank #22 / 287
255-
13
Facility 13
MO AVG 45
Rank #486 / 563
Cottages Master LLC
$8.9M
Facility $8.9M
MO AVG $8.4M
Rank #76 / 292
$4.9M
Facility $4.9M
MO AVG $3.3M
Rank #70 / 292
55.4%
Facility 55.4%
MO AVG 45.6%
Rank #134 / 292
265860
River Crossing Rehab and Healthcare Center
NH
HC
MC
PC
St. Louis (Dunn Loring)
120
Facility 120
MO AVG 97
Rank #89 / 454
81.1%
Facility 81.1%
MO AVG 66.6%
Rank #106 / 434
+22%
3.34
Facility 3.34
MO AVG 3.74
Rank #206 / 282
-45%-11%
$0
Facility $0
MO AVG $76.9k
Rank #1 / 289
36
Facility 36
MO AVG 36.5
Rank #176 / 287
5.1
Facility 5.1
MO AVG 5.7
Rank #140 / 287
188-
1
Facility 1
MO AVG 45
Rank #549 / 563
River Crossing Holdco LLC
$4.9M
Facility $4.9M
MO AVG $8.4M
Rank #91 / 292
$3.3M
Facility $3.3M
MO AVG $3.3M
Rank #59 / 292
67.9%
Facility 67.9%
MO AVG 45.6%
Rank #42 / 292
265457
St Louis Altenheim
NH
AL
IL
MC
RC
St. Louis (Carondelet)
48
Facility 48
MO AVG 97
Rank #399 / 454
89.6%
Facility 89.6%
MO AVG 66.6%
Rank #43 / 434
+34%
3.97
Facility 3.97
MO AVG 3.74
Rank #103 / 282
-+6%
$0
Facility $0
MO AVG $76.9k
Rank #1 / 289
-
Facility -
MO AVG 36.5
Rank #219 / 287
-
Facility -
MO AVG 5.7
Rank #178 / 287
-45A+
39
Facility 39
MO AVG 45
Rank #329 / 563
Malik St Louis LLC---26A484
Creve Coeur Manor
NH
St. Louis
149
Facility 149
MO AVG 97
Rank #55 / 454
49.6%
Facility 49.6%
MO AVG 66.6%
Rank #343 / 434
-26%
3.17
Facility 3.17
MO AVG 3.74
Rank #217 / 282
-34%-15%
$9.4k
Facility $9.4k
MO AVG $76.9k
Rank #171 / 289
67
Facility 67
MO AVG 36.5
Rank #265 / 287
8.4
Facility 8.4
MO AVG 5.7
Rank #258 / 287
270-
30
Facility 30
MO AVG 45
Rank #386 / 563
Jeanne Dirschuweit
$5.5M
Facility $5.5M
MO AVG $8.4M
Rank #158 / 292
$4.0M
Facility $4.0M
MO AVG $3.3M
Rank #126 / 292
72.5%
Facility 72.5%
MO AVG 45.6%
Rank #53 / 292
265720

Financial Assistance for
Nursing Home in Missouri

Laclede Groves is located in St. Louis, Missouri.
Here are the financial assistance programs available to residents in Missouri.

Get Financial aid guidance

Aged and Disabled Waiver

Missouri Medicaid A&D Waiver

Age 65+ or disabled
General Missouri resident, Medicaid- eligible, nursing home-level care need.
Income Limits (2025) ~$2,829/month 300% FBR, individual
Asset Limits $2,000 (individual), $3,000 (couple).
MO

Rural access prioritized.

Benefits
Personal care (5-7 hours/day) Respite (240 hours/year) Adult day care (~$65/day) Home health services

Missouri Supplemental Nursing Care (SNC)

MO SNC

Age 65+
General Missouri resident, in approved facility.
Income Limits ~$1,215/month individual
Asset Limits $2,000 individual
MO

Supplements SSI; facility-based only.

Benefits
Monthly cash payment (~$156-$292/month) for care costs

Structured Family Caregiving Waiver (SFCW)

Missouri Structured Family Caregiving Waiver

Age 65+
General Missouri resident, MO HealthNet-eligible, NFLOC, dementia diagnosis, live with caregiver.
Income Limits (2025) ~$2,901/month (300% FBR, individual); QIT required.
Asset Limits $5,909.25 (individual), $11,818.45 (couple).
MO

Caregiver must be family; small program size.

Benefits
Cash stipend ($1,000-$1,500/month) to family caregiver Respite Training Supplies ($500/year)

MO HealthNet Aged, Blind, and Disabled (ABD)

Missouri MO HealthNet ABD

Age 65+ or disabled
General Missouri resident, MO HealthNet-eligible, needs help with 1+ ADL.
Income Limits (2025) ~$1,690/month (individual, projected); spenddown allowed.
Asset Limits $5,909.25 (individual), $11,818.45 (couple).
MO

Less intensive than waivers; statewide access.

Benefits
Personal care (2-4 hours/day) Homemaker services Limited respite Medical equipment

Medicare Savings Program (MSP)

Missouri Medicare Savings Program

Age 65+ or disabled
General Missouri resident, Medicare Part A/B.
Income Limits (2025) ~$2,510/month (QMB), ~$3,380/month (SLMB), ~$3,598/month (QI)—individual.
Asset Limits $9,430 (individual), $14,130 (couple).
MO

Three tiers; no waitlist; includes Extra Help for Part D.

Benefits
Covers Part B premiums ($174.70/month) Deductibles ($240/year) Copays (~20%)

Missouri Caregiver Program (Customized Caregiver Training & Relief)

Missouri Caregiver Program

Age
General Caregivers of 60+ with dementia, Missouri resident, functional needs (2+ ADLs).
Income Limits (2025) No strict cap; prioritizes low-income ~$24,980/year individual
Asset Limits Not assessed; need-based.
MO

Administered via AAAs and Alzheimer’s Association; rural focus.

Benefits
Respite (4-6 hours/week) Training Assistive tech ($500/year) Supplies

VA Aid and Attendance (A&A) and Housebound Benefits

Missouri VA Aid and Attendance/Housebound

Age 65+ or disabled veteran/spouse
General Missouri resident, wartime service, need for ADL help (A&A) or homebound.
Income Limits (2025) Net income < ~$1,984/month (veteran with dependent, A&A); pension offsets income.
Asset Limits ~$155,356 net worth limit
MO

High veteran demand in rural/urban areas.

Benefits
Cash (~$1,433-$2,642/month veteran, ~$951-$1,318 spouse) for care costs (e.g., in-home, assisted living)

Frequently Asked Questions about Laclede Groves

Is Laclede Groves in a walkable area?

Laclede Groves has a walk score of 35. Somewhat walkable. A few nearby services may be reachable on foot, but most trips require transportation.

What is the occupancy rate at Laclede Groves?

Laclede Groves's occupancy is 69.7%.

Does Laclede Groves operate as a for-profit or non-profit?

Laclede Groves is registered as a for-profit.

Are there photos of Laclede Groves?

Yes — there are 7 photos of Laclede Groves in the photo gallery on this page.

What is the address of Laclede Groves?

Laclede Groves is located at 723 S Laclede Station Rd, St. Louis, MO 63119.

What is the phone number of Laclede Groves?

(314) 968-5570 will put you in contact with the team at Laclede Groves.

Is Laclede Groves Medicare or Medicaid certified?

Yes — Laclede Groves is a CMS-certified provider of Medicare and Medicaid.

Guides for Better Senior Living

Care Cost Calculator: See Prices in Your Area

Nursing Home Data Explorer

Don’t Wait Too Long: 7 Red Flag Signs Your Parent Needs Assisted Living Now

The True Cost of Assisted Living in 2025 – And How Families Are Paying For It

Understanding Senior Living Costs: Pricing Models, Discounts & Financial Assistance