Asher Point Independent Living of Tyler
Nursing Home & Independent Living · Tyler, TX
CMS overall rating Info CMS (the Centers for Medicare & Medicaid Services) is the federal agency that rates nursing home quality. Its Overall Rating runs from 1 to 5 stars, combining health inspections, staffing, and quality measures, with inspections weighted most heavily.

Asher Point Independent Living of Tyler

Nursing Home & Independent Living · Tyler, TX
CMS overall rating Info CMS (the Centers for Medicare & Medicaid Services) is the federal agency that rates nursing home quality. Its Overall Rating runs from 1 to 5 stars, combining health inspections, staffing, and quality measures, with inspections weighted most heavily.
Calculator: See prices in your area
Asher Point Independent Living of Tyler accepts Medicare, Medicaid, and private pay.

Overview of Asher Point Independent Living of Tyler

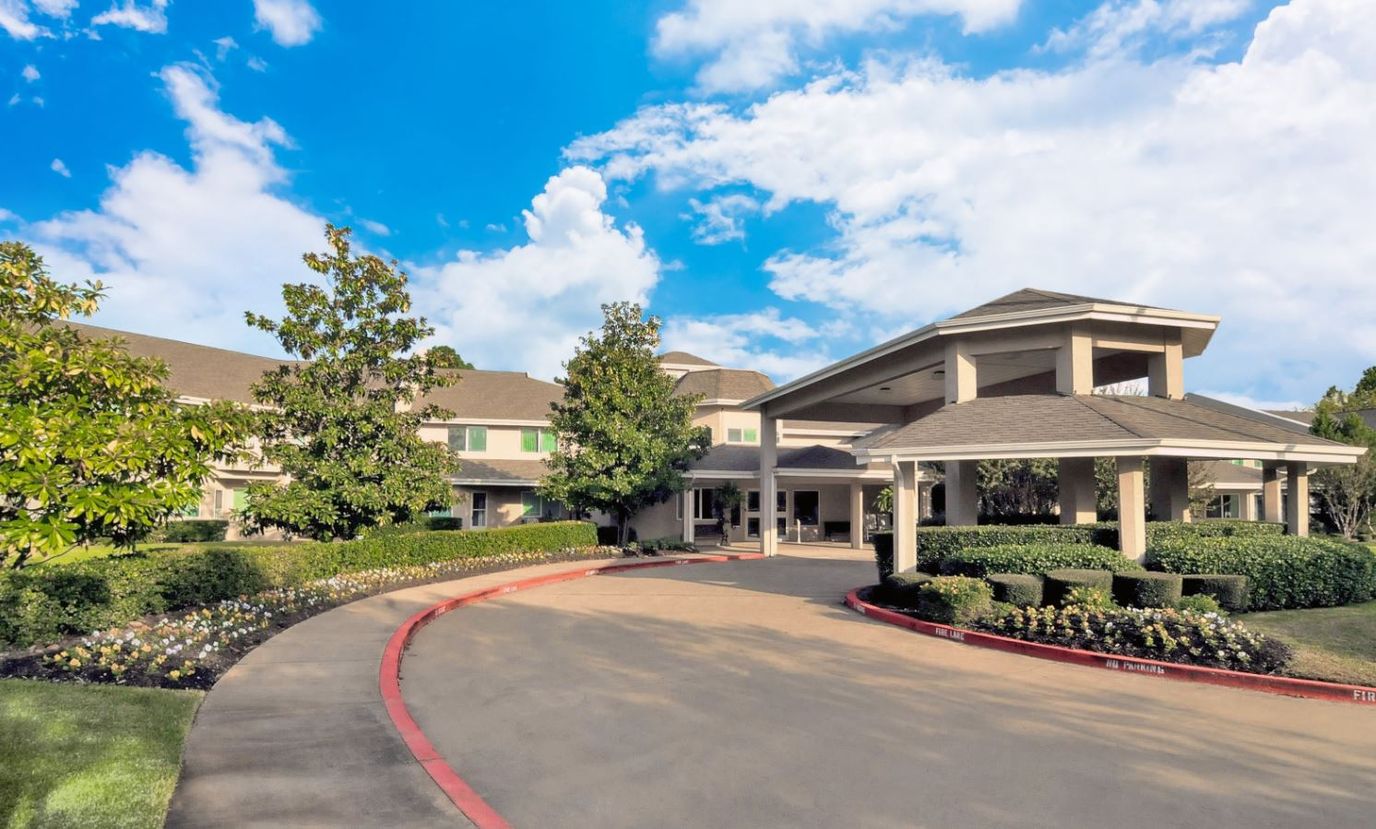
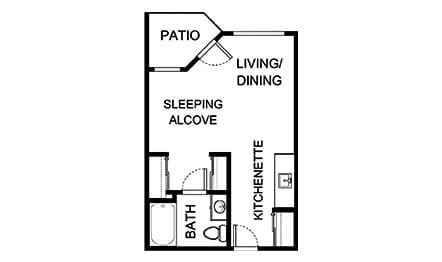
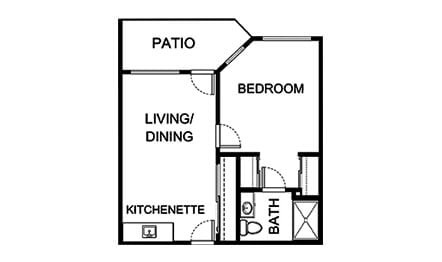
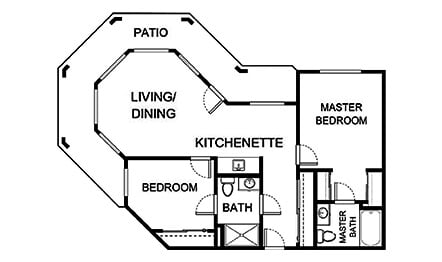
Set on wooded grounds in a residential neighborhood of Tyler, Texas, Asher Point Independent Living of Tyler is an idyllic senior living community that provides independent living for active seniors. Relax in luxury and style in beautifully decorated studios, one bedroom apartments, and two bedroom apartments that are all wheelchair accessible and equipped with kitchenettes, basic cable, and a private balcony or patio to enjoy. A broad range of services, including housekeeping, maintenance, light linen, scheduled transportation helps residents free up their time and energy for more enjoyable activities.

There’s always something to keep residents engaged and entertained, with a broad range of interesting activities tailored to residents’ unique interests, passions, and current abilities. The community is a social hub with many communal spaces to enjoy and share with fellow residents, such as a game room, activity room, library, and beautiful community grounds. Residents are encouraged to maintain their overall well-being by participating in the community’s health and wellness initiatives, using fitness equipment, or taking fun and refreshing walks at the many walking paths. Asher Point Independent Living of Tyler is a community you can rely on when it comes to a vibrant and fulfilling senior living.

Quality ratings

Measured by Centers for Medicare & Medicaid Services (CMS)

Overall rating Info The Overall CMS Rating combines results from health inspections, staffing levels and quality measures. Health inspections carry the most weight. Staffing and quality scores can increase or decrease the final rating based on performance compared to state and national standards.
▲ 43.1% Above TX avg. ▲ 43.1% Above TX avg.TX average: 2.8Click the badge to see the full State ranking.Click here to see the full State ranking.
Health Inspection Info Based on the results of the facility's three most recent standard inspections and any complaint investigations. CMS reviews the number, scope, and severity of deficiencies, with more recent findings weighted more heavily.
▲ 44.7% Above TX avg. ▲ 44.7% Above TX avg.TX average: 2.8Click the badge to see the full State ranking.Click here to see the full State ranking.
Staffing Info Measures average nursing staff hours per resident per day, including Registered Nurses (RNs) and total nursing staff. Ratings are adjusted based on the level of care residents require and are compared to state and national benchmarks.
▼ 5.7% Below TX avg. ▼ 5.7% Below TX avg.TX average: 2.1Click the badge to see the full State ranking.Click here to see the full State ranking.
Quality Measures Info Based on clinical and physical health indicators reported to CMS, such as hospital readmissions, falls, pressure ulcers, and improvements in mobility. These measures reflect how well residents' health needs are being managed.
▲ 6.5% Above TX avg. ▲ 6.5% Above TX avg.TX average: 3.8Click the badge to see the full State ranking.Click here to see the full State ranking.

Staffing hours breakdown

Info Daily nursing hours per resident by staff type, reported to CMS. Higher is generally better — compare this facility to state and national averages to see where staffing stands.

Hours per resident per day — compared to Texas state averages

Total nursing care / resident Info This home is ranked 222nd out of 296 homes in Texas for nurse hours. Total adjusted nursing hours per resident per day, combining RN, LPN, and aide time. CMS adjusts this for case-mix so facilities can be fairly compared.
3h 13m per day
Rank #222 / 296Nurse hours — State benchmarkedThis home is ranked 222nd out of 296 homes in Texas. Shows adjusted nurse hours per resident per day benchmarked to the Texas average, with a ranking across 296 Texas facilities. More hours mean more direct care. The national average is about 3.5 hrs; below 3.0 is a red flag.Rankings are based only on facilities in Texas that report data for that category. Facilities without available data are excluded from the ranking.Click the rank badge to see the full State ranking.Click here to see the full State ranking.
This facility Texas avg (3h 38m per day)
vs Texas avg
-11%

5 of 6 metrics below state avg

Standout metric LPN / LVN is +18% above state avg
Staff typeHours / Day / Residentvs state avg
Registered Nurse (RN) Info RNs hold the highest nursing license and can assess residents, interpret test results, and direct care plans. More RN hours per day often signals stronger clinical oversight and faster response to health changes. 24m per day ▼ 4% State avg: 25m per day · National avg: 41m per day
LPN / LVN Info Licensed Practical Nurses (LPNs) or Licensed Vocational Nurses (LVNs) deliver routine hands-on care — medication administration, wound dressing, and monitoring vital signs. They work under RN supervision and make up a large share of daily bedside care. 1h 7m per day ▲ 18% State avg: 57m per day · National avg: 52m per day
Nurse Aide Info Certified Nurse Aides (CNAs) provide the most direct day-to-day assistance: bathing, dressing, feeding, and mobility. Nurse aide hours are typically the largest staffing category and directly affect residents' quality of life. 1h 28m per day ▼ 27% State avg: 2h 1m per day · National avg: 2h 20m per day
Weekend Total Nursing Info Combined nursing hours (RN + LPN + Nurse Aide) per resident per day on weekends. Staffing often drops on weekends — this figure reveals whether the facility maintains adequate coverage outside of weekday hours. 2h 46m per day ▼ 8% State avg: 3h 0m per day · National avg: 3h 27m per day
Physical Therapist Info Hours per resident per day provided by licensed Physical Therapists (PTs) or PT Assistants. PT services help residents recover mobility after injury or illness and are especially important for post-acute (short-stay) rehabilitation. 1m per day ▼ 74% State avg: 4m per day · National avg: 4m per day
Weekend RN Info Registered nurse hours specifically on weekends. Facilities sometimes reduce RN presence on Saturdays and Sundays — a low weekend RN figure compared to weekday hours can indicate reduced clinical oversight when most administrative staff are absent. 17m per day ▼ 14% State avg: 20m per day · National avg: 29m per day

Capacity and availability

This home usually has limited availability

Higher occupancy than the Texas average: 63.5%
Occupancy rate
90.8% Rank #14 / 304Occupancy rate — State benchmarkedThis home is ranked 14th out of 304 homes in Texas. Shows this facility's occupancy rate versus the Texas average, with its Statewide rank out of 304. Higher occupancy signals strong local demand and financial stability.Rankings are based only on facilities in Texas that report data for that category. Facilities without available data are excluded from the ranking.Click the rank badge to see the full State ranking.Click here to see the full State ranking.
Avg. Length of Stay
195 days
Bed community size
63-bed community Rank #577 / 988Bed count — State benchmarkedThis home is ranked 577th out of 988 homes in Texas. Shows this facility's certified or reported bed count compared to other Texas facilities. Larger communities may offer more amenities, programs, and on-site services for residents and families.Rankings are based only on facilities in Texas that report data for that category. Facilities without available data are excluded from the ranking.Click the rank badge to see the full State ranking.Click here to see the full State ranking.
A moderately sized community that may balance personal attention with shared amenities and social activities.
Walk Score
Walk Score: 55 / 100 Rank #387 / 1391Walk Score — State benchmarkedThis home is ranked 387th out of 1391 homes in Texas. Shows how walkable this facility's neighborhood is compared to the average Walk Score across Texas facilities. Higher scores benefit residents, families, and staff.Rankings are based only on facilities in Texas that report data for that category. Facilities without available data are excluded from the ranking.Click the rank badge to see the full State ranking.Click here to see the full State ranking.
Moderately walkable. Some errands can be accomplished on foot, with a mix of nearby amenities.

Safety & Compliance

Wheelchair Accessible
Emergency SystemsYes
Safety FeaturesSafety rails, Emergency response devices, Wheelchair accessibility, Smoke alarms and sprinklers

Additional Policies & Features

Pets Allowed
HousekeepingYes
Linen ServiceYes

Amenities & Lifestyle

Library
Salon
Barber
Spa
Restaurant
Garden
Patio
Walking Paths
Transportation
Concierge
Housekeeping
Linen Service
ActivitiesResidents participate in various classes, activities, and social events that focus on health, wellness, learning, and connection

Pricing & Financial Information

Starting Price$2415 per month

Contact Asher Point Independent Living of Tyler

Staffing Data

Reporting period: October 1 – December 31, 2025 (Q4 2025). Source: CMS Payroll-Based Journal report.

Total staff 69
Employees 64
Contractors 5
Staff to resident ratio 1.17 : 1
21% fewer staff per resident than Texas average
Texas average ratio: 1.48 : 1 Texas average ratio: 1.48 : 1See full Texas ranking
Avg staff/day 25
Average shift 7.9 hours
0% compared with Texas average
Texas average: 8.1 hours Texas average shift: 8.1 hoursSee full Texas ranking
Total staff hours (quarter) 18,119

Nursing staff breakdown

Q4 2025 · Oct 1 – Dec 31 More info This data comes from the CMS Payroll-Based Journal report covering October 1 – December 31, 2025.
Registered Nurse

Manages medical care and health needs.

RN Staff Info All 7 RN Staff are full-time employees. No contractors work on this role. 7
Average shift length Info Average shift length. Calculated as total hours divided by days worked and average staff per day. 8.1 hours
Licensed Practical Nurse

Assists with medical care and medications.

LPN Staff Info All 14 LPN Staff are full-time employees. No contractors work on this role. 14
Average shift length Info Average shift length. Calculated as total hours divided by days worked and average staff per day. 8.8 hours
Certified Nursing Assistant

Helps with daily care and mobility.

CNA Staff Info All 26 CNA Staff are full-time employees. No contractors work on this role. 26
Average shift length Info Average shift length. Calculated as total hours divided by days worked and average staff per day. 8.5 hours

Contractor staffing

Q4 2025 · Oct 1 – Dec 31 More info This data comes from the CMS Payroll-Based Journal report covering October 1 – December 31, 2025.

Total hours from contractors

0.9%

155 contractor hours this quarter

Medical Director: 2 Occupational Therapy Aide: 1 Occupational Therapy Assistant: 1 Feeding Assistant: 1

Staff by category

Q4 2025 · Oct 1 – Dec 31 More info This data comes from the CMS Payroll-Based Journal report covering October 1 – December 31, 2025.
Certified Nursing Assistant260267,17292100%8.5
Licensed Practical Nurse140144,67992100%8.8
Registered Nurse7071,62192100%8.1
RN Director of Nursing2021,0236571%8
Physical Therapy Aide3037686672%7.1
Speech Language Pathologist2025626672%7.4
Administrator1015126470%8
Nurse Practitioner1014405560%8
Mental Health Service Worker1013724145%9.1
Qualified Social Worker2023105762%5.4
Nurse Aide in Training1012823639%7.8
Respiratory Therapy Technician202904751%1.9
Physical Therapy Assistant101894852%1.9
Feeding Assistant0115678%8
Dietitian1014567%7.5
Medical Director0223955%7.8
Occupational Therapy Aide011361921%1.9
Occupational Therapy Assistant0112467%4
26 Certified Nursing Assistant
% of Days 100%
14 Licensed Practical Nurse
% of Days 100%
7 Registered Nurse
% of Days 100%
2 RN Director of Nursing
% of Days 71%
3 Physical Therapy Aide
% of Days 72%
2 Speech Language Pathologist
% of Days 72%
1 Administrator
% of Days 70%
1 Nurse Practitioner
% of Days 60%
1 Mental Health Service Worker
% of Days 45%
2 Qualified Social Worker
% of Days 62%
1 Nurse Aide in Training
% of Days 39%
2 Respiratory Therapy Technician
% of Days 51%
1 Physical Therapy Assistant
% of Days 52%
1 Feeding Assistant
% of Days 8%
1 Dietitian
% of Days 7%
2 Medical Director
% of Days 5%
1 Occupational Therapy Aide
% of Days 21%
1 Occupational Therapy Assistant
% of Days 7%

Penalties and fines

Federal penalties imposed by CMS for regulatory violations, including civil money penalties (fines) and denials of payment for new Medicare/Medicaid admissions.

Source: CMS Penalties Database (Data as of Jan 2026)

Total fines amount $5K Rank #1 / 301Federal fines — State benchmarkedThis home is ranked 1st out of 301 homes in Texas. Shows this facility's cumulative CMS federal fine dollars versus the Texas average among facilities with fines, and where it ranks among 301 facilities in the pool. Lower total dollars mean a better rank.Rankings are based only on facilities in Texas that report data for that category. Facilities without available data are excluded from the ranking.Click the rank badge to see the full State ranking.Click here to see the full State ranking.
94% lower than Texas average

Texas average: $80K

Number of fines 1
60% fewer fines than Texas average

Texas average: 2.5

Payment Denials Info Serious action where Medicare and/or Medicaid temporarily stops payments for new residents until issues are fixed. 1
354% more payment denials than Texas average

Texas average: 0.2

Fines amount comparison
This facility $5K
Texas average $80K

No penalties in the past 3 years

No civil money penalties or payment denials were reported in the last 3 years.

Quality of care over time

These measures show how residents usually do over time at this home, based on health outcomes and preventive care.

High-risk clinical events score Info A composite score based on pressure ulcers, falls with injury, weight loss, walking ability decline, and activities of daily living decline. 4.6
47% better than Texas average

Texas average: 8.6

Functional decline score Info A composite score based on activities of daily living decline, walking ability decline, and incontinence. 9.7
40% better than Texas average

Texas average: 16.0

Long-stay resident measures
Need for Help with Daily Activities Increased Info Percent of long-stay residents whose need for help with daily activities has increased 10.5%
35% better than Texas average

Texas average: 16.2%

Walking Ability Worsened Info Percent of long-stay residents whose ability to move independently worsened 6.2%
62% better than Texas average

Texas average: 16.2%

Low Risk Residents with Bowel/Bladder Incontinence Info Percent of low risk long-stay residents who lose control of their bowels or bladder 12.3%
22% better than Texas average

Texas average: 15.7%

Falls with Major Injury Info Percent of long-stay residents experiencing one or more falls with major injury 1.8%
45% better than Texas average

Texas average: 3.2%

High Risk Residents with Pressure Ulcers Info Percent of long-stay high risk residents with pressure ulcers 3.4%
24% better than Texas average

Texas average: 4.4%

Urinary Tract Infection Info Percent of long-stay residents with a urinary tract infection 0.0%
100% better than Texas average

Texas average: 0.8%

Lost Too Much Weight Info Percent of long-stay residents who lose too much weight 1.1%
68% better than Texas average

Texas average: 3.5%

Depressive Symptoms Info Percent of long-stay residents who have depressive symptoms 0.9%
68% better than Texas average

Texas average: 2.9%

Antipsychotic Use Info Percent of long-stay residents who received an antipsychotic medication 0.6%
92% better than Texas average

Texas average: 7.9%

Pneumococcal Vaccine Info Percent of long-stay residents assessed and appropriately given the pneumococcal vaccine 98.2%
In line with Texas average

Texas average: 97.3%

Influenza Vaccine Info Percent of long-stay residents assessed and appropriately given the seasonal influenza vaccine 100.0%
In line with Texas average

Texas average: 97.9%

Short-stay resident measures
Pneumococcal Vaccine Info Percent of short-stay residents assessed and appropriately given the pneumococcal vaccine 94.4%
In line with Texas average

Texas average: 90.4%

Antipsychotic medication increase Info Percent of short-stay residents who newly received an antipsychotic medication 0.0%
100% better than Texas average

Texas average: 1.4%

Breakdown by payment type

Medicare

45% of new residents, usually for short-term rehab.

Typical stay 3 - 4 months

Private pay

16% of new residents, often for short stays.

Typical stay 6 - 7 months

Medicaid

39% of new residents, often for long-term daily care.

Typical stay 12 months

Facility Characteristics

Source: CMS Long-Term Care Facility Characteristics (Data as of Jan 2026)

Total residents 59
Medicare
14
23.7% of residents
Medicaid
37
62.7% of residents
Private pay or other
8
13.6% of residents
Programs & Services
Residents Group

Residents meet regularly to discuss policies, care quality, and activities

Active Resident Council

Organized group of residents that meets regularly to discuss facility policies, quality of life, and activities.

Finances and operations

Based on CMS SNF Cost Report for fiscal year ending in 11/2023.

Government
Operated by county authorities.
Net patient revenue Info Net patient revenue — what the home actually collects for resident care, after contractual allowances, bad debt and discounts are subtracted from its gross charges (CMS cost report, Worksheet G-3). It covers resident care only; money the home earns from other sources is shown separately as "Other income."
$5.7M
Net patient income Info Net patient income: net patient revenue minus the home's total operating expenses. A positive figure means it earns more from resident care than it spends to deliver it; a negative figure means the opposite. It excludes non-operating "other income."
$1.1M
Government Operated by county authorities.
Net patient revenue Info Net patient revenue — what the home actually collects for resident care, after contractual allowances, bad debt and discounts are subtracted from its gross charges (CMS cost report, Worksheet G-3). It covers resident care only; money the home earns from other sources is shown separately as "Other income."
$5.7M Rank #259 / 304Revenue — State benchmarkedThis home is ranked 259th out of 304 homes in Texas. Shows this facility's annual revenue compared to the Texas average. Higher revenue generally means more resources for staffing and capital — read alongside Payroll %.Rankings are based only on facilities in Texas that report data for that category. Facilities without available data are excluded from the ranking.Click the rank badge to see the full State ranking.Click here to see the full State ranking.
Net patient income Info Net patient income: net patient revenue minus the home's total operating expenses. A positive figure means it earns more from resident care than it spends to deliver it; a negative figure means the opposite. It excludes non-operating "other income."
$1.1M
Other income Info Money the home earns outside of resident care — such as investments, grants, rentals and other non-operating sources (CMS cost report, Worksheet G-3). It is tracked separately from net patient revenue: it is not part of that figure, and it is not included in net patient income.
$1.1M
Payroll costs Info Staff salaries plus wage-related costs — benefits such as payroll taxes, health insurance and retirement — from the home's own accounting records (CMS cost report, Worksheet A). Contract or agency labor is counted separately, under other operating costs. Rank #288 / 304Payroll — State benchmarkedThis home is ranked 288th out of 304 homes in Texas. Shows total annual staff payroll benchmarked to the Texas average. Higher payroll investment relative to peers often signals better staffing and less reliance on cheaper contract labor.Rankings are based only on facilities in Texas that report data for that category. Facilities without available data are excluded from the ranking.Click the rank badge to see the full State ranking.Click here to see the full State ranking.
$2.4M 41.3% of net patient revenue Info Payroll as a share of revenue: staff salaries and wage-related benefits divided by net patient revenue. A higher figure means more of each revenue dollar goes to staff pay. Rank #273 / 304Payroll % — State benchmarkedThis home is ranked 273rd out of 304 homes in Texas. Shows payroll as a percentage of revenue versus the Texas average. Well-run Texas facilities typically land around 51–63% — the top third Statewide. Below 25% may signal understaffing or heavy agency use — read with Staffing ratings.Rankings are based only on facilities in Texas that report data for that category. Facilities without available data are excluded from the ranking.Click the rank badge to see the full State ranking.Click here to see the full State ranking.
Other operating costs Info Everything it costs to run the home apart from payroll — food, utilities, supplies, maintenance, contract labor and administration. Calculated as total operating expense minus payroll (staff salaries and wage-related benefits).
$2.3M
Total costs Info The home's total operating expense for the year — all the costs of running it, salaries included (CMS cost report, Worksheet G-3).
$4.7M

What does this home offer?

Room sizes icon
Room sizes icon

Room Sizes: 335 - 901 sq. ft

Housing options icon

Housing Options: Studio / 1 Bed / 2 Bed

Building type icon
Building type icon

Building Type: Two-story

Fitness and recreation icon

Fitness and Recreation

Who this home usually serves

TYPE OF STAY

Mostly short-term rehab stays

Most residents typically stay for a few weeks or months before returning home or moving on.

New residents most often arrive under Medicare (45% of admissions), and a typical Medicare stay runs around 3 - 4 months.

Admissions
87 total

Coverage residents most often arrive under.

Medicare 45%
Private pay 16%
Medicaid 39%
Discharges
98 total

Coverage residents most often leave under.

Medicare 51%
Private pay 14%
Medicaid 35%

Living Spaces & Floor Plans for Asher Point Independent Living of Tyler

Studio Floor Plan A-1
Studio
One Bedroom Floor Plan B-1
1 Bedroom
Two Bedroom Floor Plan C-1
2 bedroom

Places of interest near Asher Point Independent Living of Tyler

Address 4.4 miles from city center Info Estimated distance in miles from Tyler's city center to Asher Point Independent Living of Tyler's address, calculated via Google Maps.

Calculate Travel Distance to Asher Point Independent Living of Tyler

Add your location

Address

Compare Nursing Homes around Tyler

2 facilities compared · CMS & TX Dept. of Health data

Meadow Lake Senior Living – Tyler
NH
AL
IL
MC
RC
Tyler
20
Facility 20
TX AVG 80
Rank #804 / 988
80.1%
Facility 80.1%
TX AVG 63.5%
Rank #72 / 304
+26%
4.30
Facility 4.30
TX AVG 3.63
Rank #56 / 296
+156%+18%
$0
Facility $0
TX AVG $81.8k
Rank #1 / 301
4
Facility 4
TX AVG 25.9
Rank #2 / 299
1.3
Facility 1.3
TX AVG 3.7
Rank #2 / 299
-27A+
33
Facility 33
TX AVG 41
Rank #884 / 1391
Robbin Bell
$9.8M
Facility $9.8M
TX AVG $8.4M
Rank #141 / 304
$5.0M
Facility $5.0M
TX AVG $3.5M
Rank #120 / 304
51.5%
Facility 51.5%
TX AVG 47%
Rank #113 / 304
676286
Asher Point Independent Living of Tyler
NH
IL
Tyler
63
Facility 63
TX AVG 80
Rank #577 / 988
90.8%
Facility 90.8%
TX AVG 63.5%
Rank #14 / 304
+43%
3.22
Facility 3.22
TX AVG 3.63
Rank #222 / 296
+32%-11%
$0
Facility $0
TX AVG $81.8k
Rank #1 / 301
12
Facility 12
TX AVG 25.9
Rank #39 / 299
4.0
Facility 4.0
TX AVG 3.7
Rank #215 / 299
-55-
55
Facility 55
TX AVG 41
Rank #387 / 1391
Operators Of Pilot Point LLC
$5.7M
Facility $5.7M
TX AVG $8.4M
Rank #259 / 304
$2.4M
Facility $2.4M
TX AVG $3.5M
Rank #288 / 304
41.3%
Facility 41.3%
TX AVG 47%
Rank #273 / 304
675902

Financial Assistance for
Nursing Home in Texas

Asher Point Independent Living of Tyler is located in Tyler, Texas.
Here are the financial assistance programs available to residents in Texas.

Get Financial aid guidance

Community Care for the Aged and Disabled (CCAD)

TX Medicaid CCAD

Age 65+ or disabled
General Texas resident, Medicaid-eligible, care need (not always nursing home level).
Income Limits (2025) ~$2,829/month 300% FBR, individual
Asset Limits $2,000 (individual), $3,000 (couple).
TX

Large state; rural access challenges.

Benefits
Personal care (5-7 hours/day) Respite (240 hours/year) Adult day care (~$60/day) Home aides

Texas Community Care Services

TX CCS

Age 60+
General Texas resident, at risk of decline.
Income Limits ~$2,000/month individual, varies
Asset Limits $5,000 individual
TX

Limited funding; high demand in urban areas.

Benefits
In-home care (3-5 hours/week) Respite (up to 10 days/year) Transportation (~5 trips/month)

Area Agency on Aging (AAA) Services

Texas AAA Services

Age 60+
General TX resident; no income/asset limits.
Income Limits (2025) None; donations encouraged.
Asset Limits Not assessed.
TX

28 AAAs; includes Meals on Wheels in some areas.

Benefits
Meals (~$5-$7/meal) Transportation Homemaker services (~4 hours/week) Respite (~5 days/year) Legal aid

Medicare Savings Program (MSP)

Texas Medicare Savings Program

Age 65+ or disabled
General TX resident, Medicare Part A/B.
Income Limits (2025) ~$2,510/month (QMB), ~$3,380/month (SLMB), ~$3,598/month (QI)—individual.
Asset Limits $9,430 (individual), $14,130 (couple).
TX

Includes Extra Help for Part D; no waitlist.

Benefits
Covers Part B premiums ($174.70/month) Deductibles ($240/year) Copays (~20%)

Family Caregiver Support Program (FCSP)

Texas Family Caregiver Support Program

Age
General Caregivers of 60+ needing care or 55+ caregivers of others; TX resident; 2+ ADLs.
Income Limits (2025) No strict cap; prioritizes low-income ~$24,980/year
Asset Limits Not assessed.
TX

High rural demand; includes grandparent caregivers.

Benefits
Respite (4-6 hours/week or 5 days/year) Adult day care ($60/day) Training Supplies (~$500/year)

VA Aid and Attendance (A&A) and Housebound Benefits

Texas VA Aid and Attendance/Housebound

Age 65+ or disabled veteran/spouse
General TX resident, wartime service, ADL help (A&A) or homebound.
Income Limits (2025) Net income < ~$1,984/month (veteran with dependent, A&A); pension offsets income.
Asset Limits ~$155,356 net worth
TX

High veteran population; supports rural/urban needs.

Benefits
Cash (~$1,433-$2,642/month veteran, ~$951-$1,318 spouse) for care costs

Property Tax Exemption for Seniors

Texas Senior Property Tax Exemption

Age 65+
General TX resident, homeowner (homestead).
Income Limits (2025) None; tax-based eligibility.
Asset Limits Not assessed.
TX

$25,000+ exemption; optional freeze in some counties; saves ~$500-$1,000/year.

Benefits
Tax exemption or freeze (~$500-$1,000/year savings)

Senior Farmers’ Market Nutrition Program (SFMNP)

Texas SFMNP

Age 60+
General TX resident, low-income.
Income Limits (2025) ~$2,322/month 185% FPL
Asset Limits Not assessed.
TX

Vouchers (~$50/season); serves ~20,000 via 28 AAAs.

Benefits
Vouchers (~$50/season) for produce at farmers’ markets

Frequently Asked Questions about Asher Point Independent Living of Tyler

Is Asher Point Independent Living of Tyler in a walkable area?

Asher Point Independent Living of Tyler has a walk score of 55. Moderately walkable. Some errands can be accomplished on foot, with a mix of nearby amenities.

What is the occupancy rate at Asher Point Independent Living of Tyler?

Asher Point Independent Living of Tyler's occupancy is 90.8%.

Does Asher Point Independent Living of Tyler have different floorplan options?

Yes — see the floorplan options available at Asher Point Independent Living of Tyler on this page.

Is Asher Point Independent Living of Tyler a government-operated facility?

Asher Point Independent Living of Tyler is a government-operated nursing facility.

Are there photos of Asher Point Independent Living of Tyler?

Yes — there are 21 photos of Asher Point Independent Living of Tyler in the photo gallery on this page.

What is the address of Asher Point Independent Living of Tyler?

Asher Point Independent Living of Tyler is located at 506 Rice Rd, Tyler, TX 75703.

What is the phone number of Asher Point Independent Living of Tyler?

(903) 326-2252 will put you in contact with the team at Asher Point Independent Living of Tyler.

Guides for Better Senior Living

Care Cost Calculator: See Prices in Your Area

Nursing Home Data Explorer

Don’t Wait Too Long: 7 Red Flag Signs Your Parent Needs Assisted Living Now

The True Cost of Assisted Living in 2025 – And How Families Are Paying For It

Understanding Senior Living Costs: Pricing Models, Discounts & Financial Assistance