


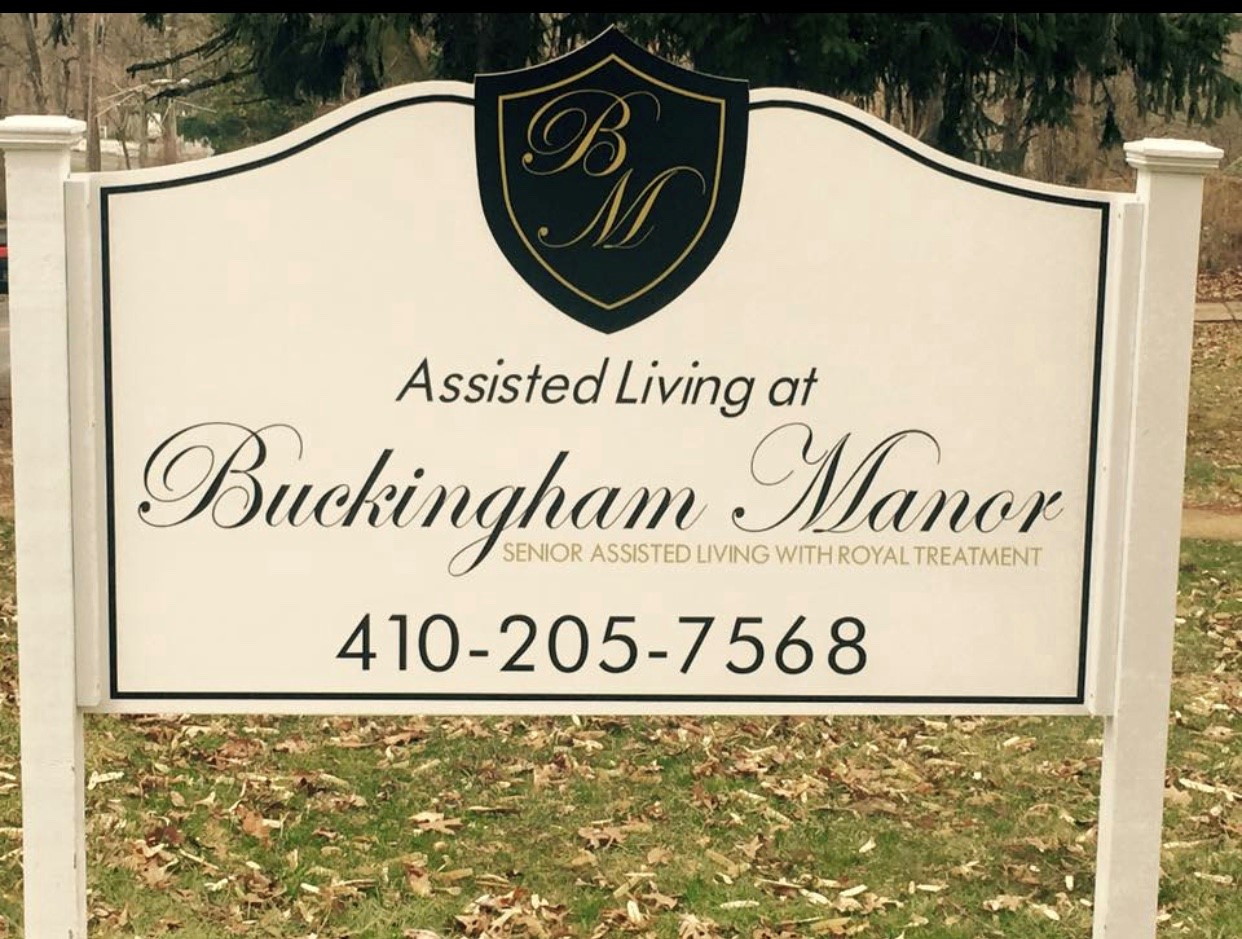
Assisted Living at Buckingham Manor
Assisted Living · Maryland, MD
Assisted Living at Buckingham Manor
Assisted Living · Maryland, MD
Assisted Living at Buckingham Manor accepts Medicaid.
Overview of Assisted Living at Buckingham Manor
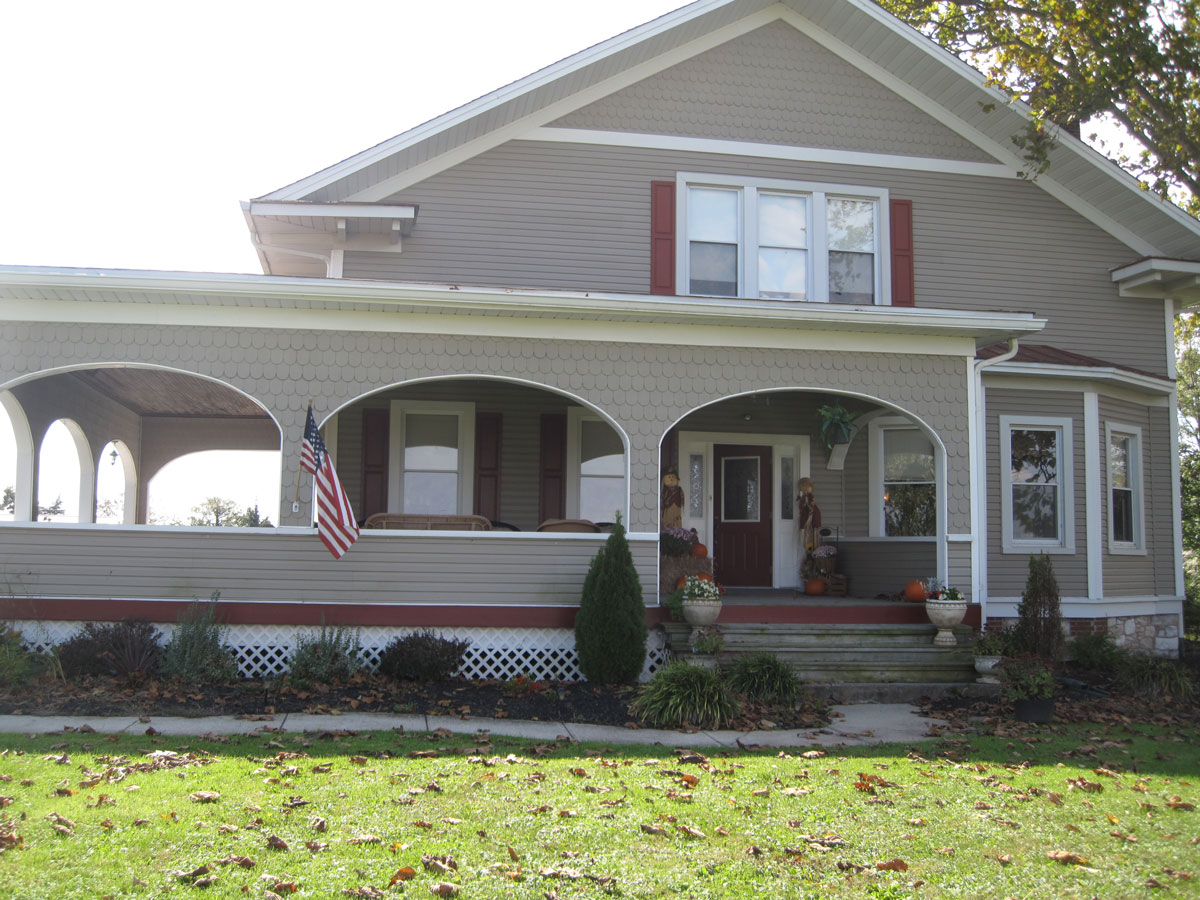
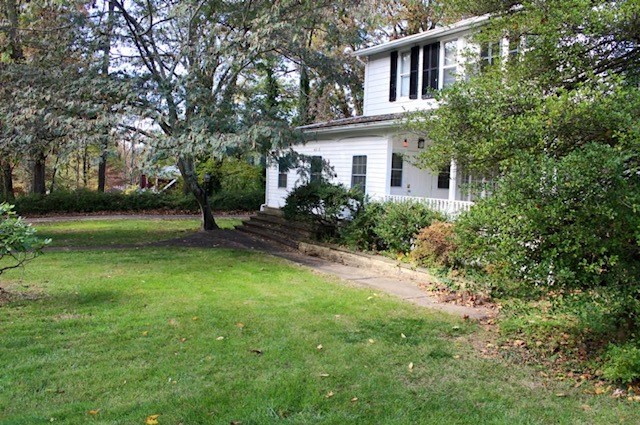
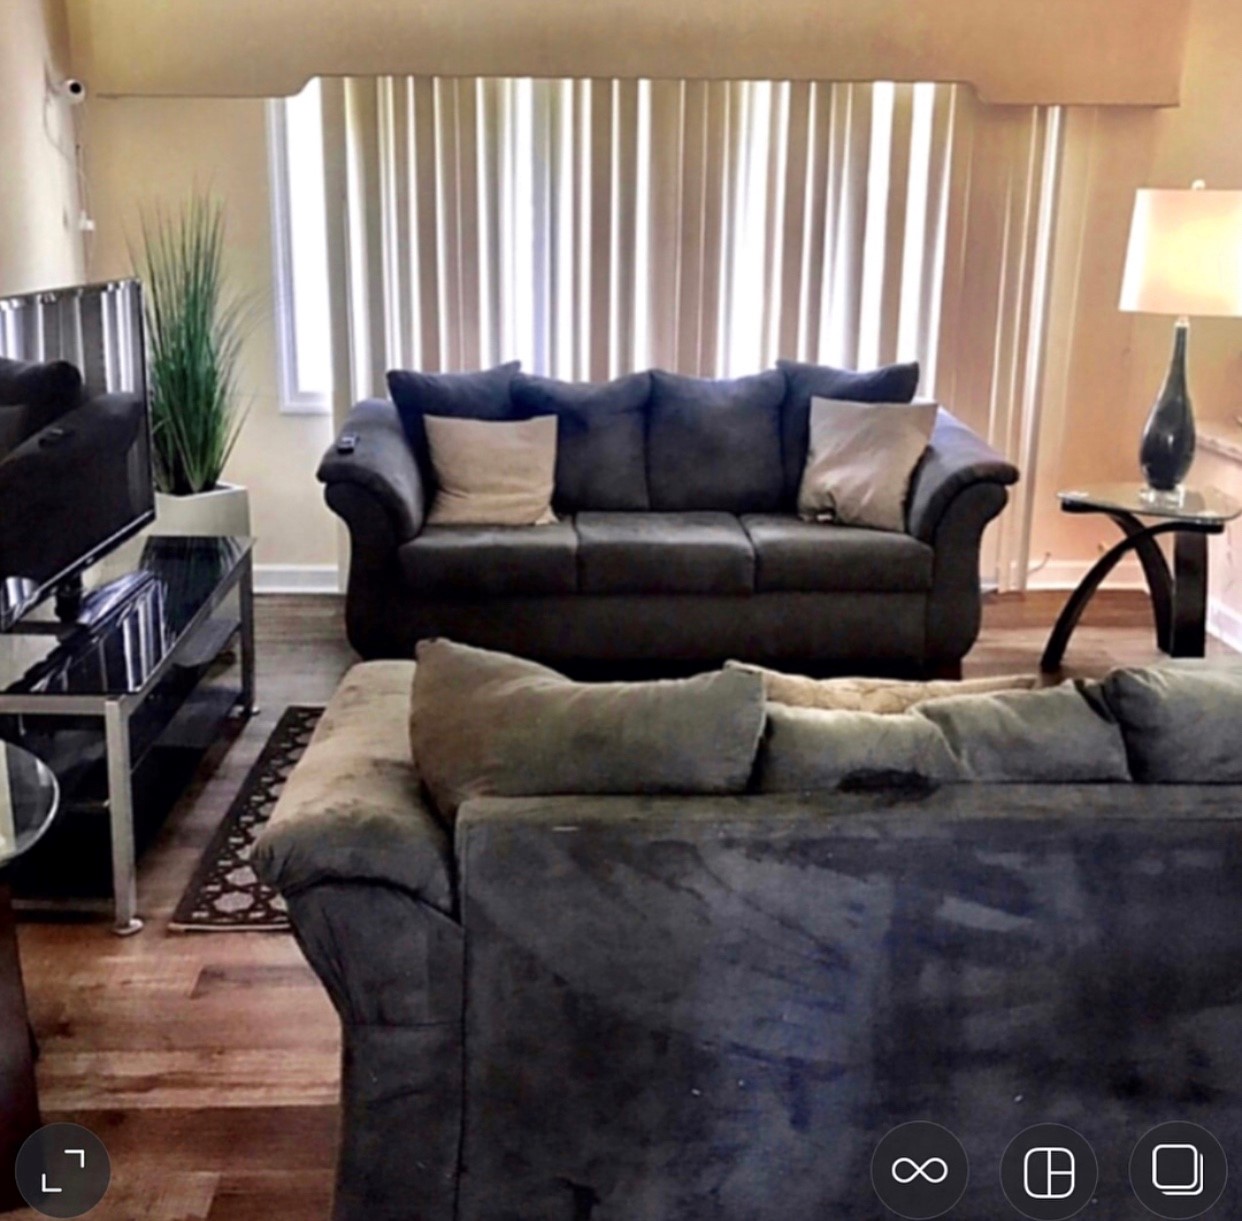
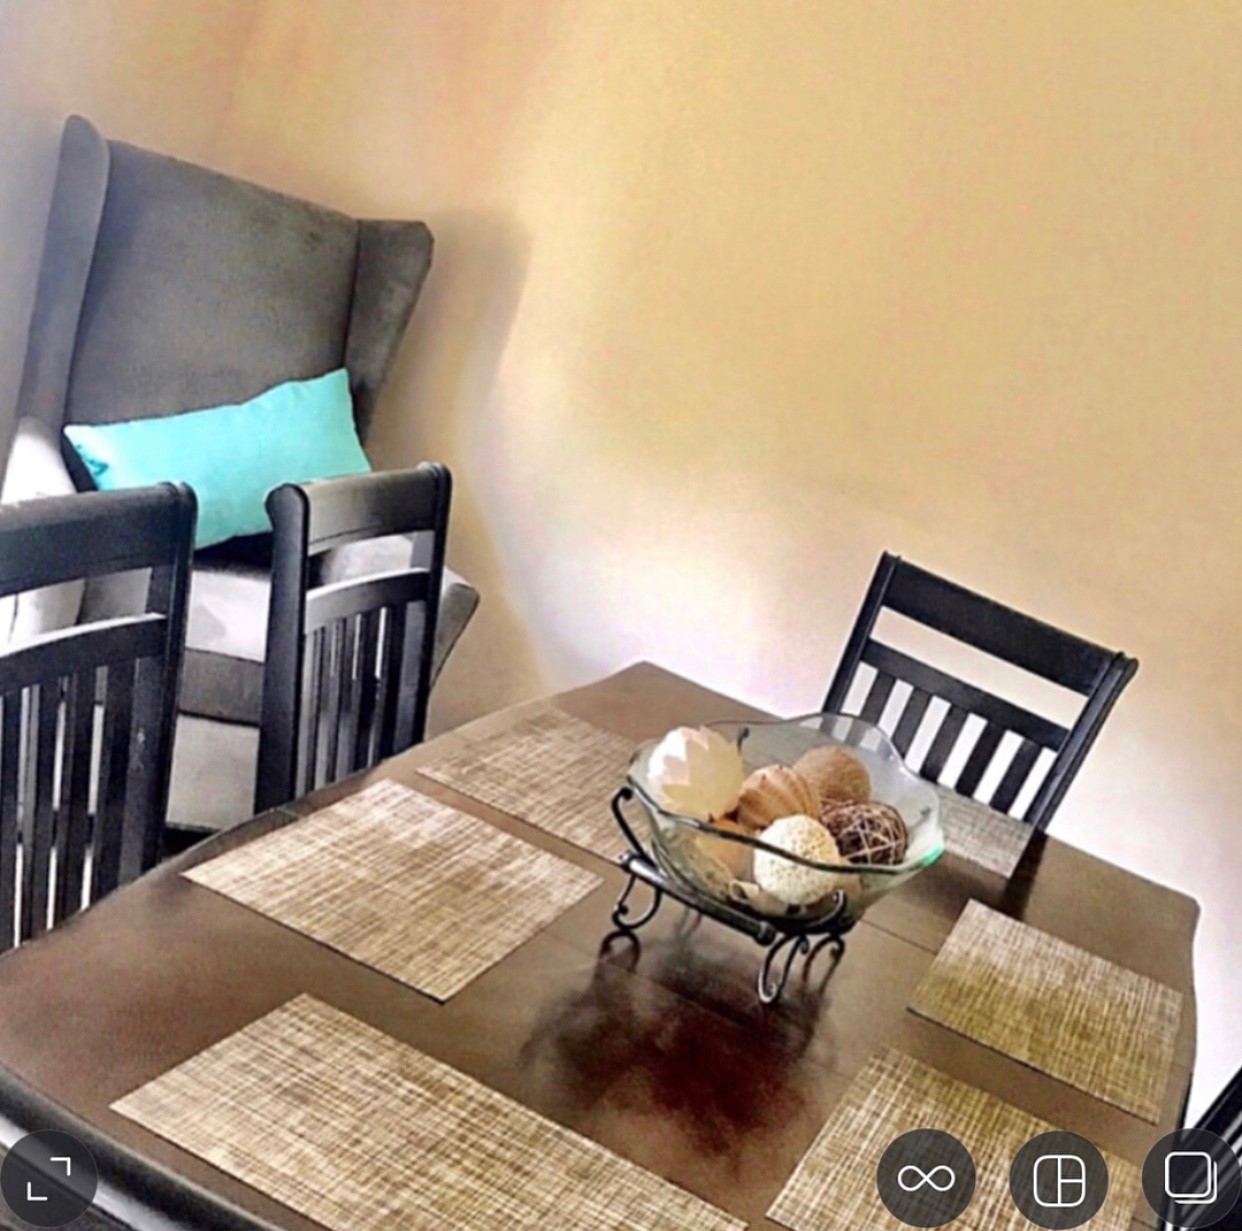
Beautifully situated in the tree-lined neighborhood of Gwynn Oak, MD, Assisted Living at Buckingham Manor is a loving retreat that offers assisted living. The community is dedicated to enhancing residents’ living experiences, providing the highest quality of support for their daily living activities, including grooming and dressing, 24/7. With private and semi-private accommodations, residents can rest assured of finding the right place to spend retirement.
Plenty of fun activities and engaging programs, like trivia games and happy hour, allow residents to interact with their surroundings and maintain social connections. Residents also enjoy a hassle-free dining experience with delicious and healthy dining options that cater to their dietary needs and preferences. Medication management and supplementary transportation are also provided for convenience and safety. The community strives to provide a maintenance-free living with its exceptional services and well-maintained amenities.
Types of Care at Assisted Living at Buckingham Manor
Assisted Living
12-bed community Rank #302 / 705Bed count — State benchmarkedThis home is ranked 302nd out of 705 homes in Maryland. Shows this facility's certified or reported bed count compared to other Maryland SNFs. Larger communities may offer more amenities, programs, and on-site services for residents and families.Click the rank badge to see the full State ranking.Click here to see the full State ranking.
A smaller, more intimate setting that may offer a quieter environment and closer staff-resident interactions.
13 years in operation Rank #140 / 209Years in operation — State benchmarkedThis home is ranked 140th out of 209 homes in Maryland. Shows how long this facility has been in operation compared to other Maryland SNFs. Longer operating histories may benefit residents, families, and staff.Click the rank badge to see the full State ranking.Click here to see the full State ranking.
A community with a solid operating history and experience delivering ongoing care.
Walk Score: 24 / 100 Rank #694 / 986Walk Score — State benchmarkedThis home is ranked 694th out of 986 homes in Maryland. Shows how walkable this facility's neighborhood is compared to the average Walk Score across Maryland SNFs. Higher scores benefit residents, families, and staff.Click the rank badge to see the full State ranking.Click here to see the full State ranking.
Car-dependent. Most errands require a car, with limited nearby walkable options.
About this community
CountyBaltimore
Services
Profit StatusTrue
Private Room
$70 - $110 per day
Semi-Private Room
$60 - $70 per day
Hospice Affiliations
Staffing
Key information about the people who lead and staff this community.
No CNA training program
Rehabilitation Services
Licensed Nurses/CNAs
24-Hour Staffing
Mild Alzheimer's Level
Moderate Alzheimer's Level
Severe Alzheimer's Level
ActivitiesActivities planned every day of the week.
Specific ProgramsIn House Visits, Podiatrist, X-Rays, Urinalysis Testing, PT/OT, 24 Hour Staff, Holiday Parties, Birthdays
Religious ServicesYes
Food DescriptionDining services are provided.
Demographics
Resident demographic information for this facility.
Gender
- Female 66.7%
- Male 33.3%
Age Distribution
- 75-84 50%
- ≤64 33.3%
- 65-74 16.7%
Ethnicity
- African American 50%
- White 50%
Infection Prevention & Vaccination
How this facility protects residents through staff vaccination policies and immunization practices.
Influenza Gold Star
Awarded by the Maryland Health Care Commission (MHCC) to healthcare facilities that achieve a high influenza vaccination rate.
What does this home offer?
Housing Options: Studio / Semi-Private Rooms
Dining Services
Housekeeping Services
Social and Recreational Activities
Places of interest near Assisted Living at Buckingham Manor
![]() 2.9 miles from city center
2.9 miles from city center
![]() Estimated distance in miles from Gwynn Oak's city center to Assisted Living at Buckingham Manor's address, calculated via Google Maps.
Estimated distance in miles from Gwynn Oak's city center to Assisted Living at Buckingham Manor's address, calculated via Google Maps.
Calculate Travel Distance to Assisted Living at Buckingham Manor
Add your location
Financial Assistance for
Assisted Living in Maryland
Assisted Living at Buckingham Manor is located in Gwynn Oak, Maryland.
Here are the financial assistance programs available to residents in Maryland.
Compare Assisted Living around Maryland
The information below is reported by the Maryland Department of Health, Office of Health Care Quality.
Filter by care type
| Bay Village of Annapolis |
NH Nursing Home Licensed facility providing 24/7 skilled nursing care for residents with complex, ongoing medical needs. Staffed by RNs, LPNs, and CNAs. Inspected and star-rated annually by CMS. Accepts Medicare (short-term rehab) and Medicaid (long-term care).
AL Assisted Living A licensed, long-term care setting for seniors or individuals with disabilities who need help with daily activities — like bathing, dressing, and medication management — but not 24-hour skilled nursing. Offers housing, meals, and around-the-clock support while aiming to maximize resident independence. | Annapolis | 88 | Yes | 75 | Studio / Semi-Private Rooms | 5 |
32% Male Residents — State Benchmarked 32% of residents are male, compared to the Maryland average of 31%. This facility caters to a majority female resident pool (68% female), consistent with the broader assisted living trend where women significantly outnumber men. |
68% Female Residents — State Benchmarked 68% of residents are female, compared to the Maryland average of 69%. Women comprise the large majority, consistent with national assisted living demographics where women live longer and enter care facilities at higher rates. |
99% White Residents — State Benchmarked 99% of residents are reported as White, compared to the Maryland average of 82%. A higher White share than is typical for assisted living in Maryland in this dataset — compare with peer facilities for local context. |
0% African American Residents — State Benchmarked 0% of residents are reported as African American or Black, compared to the Maryland average of 12%. A lower African American share than is typical in Maryland; local markets still vary widely. |
1% Other Ethnicity Residents — State Benchmarked 1% of residents fall into categories other than White or African American (combined), compared to the Maryland average of 6%. This column aggregates Hispanic, Asian, multiracial, and any other labeled groups that are not classified as White or African American. Reported subgroups in this total: Hispanic (1%). |
14% Residents Age 65–74 — State Benchmarked 14% of residents are 65–74, compared to the Maryland average of 12%. In line with the statewide profile for this youngest senior bracket in assisted living. |
28% Residents Age 75–84 — State Benchmarked 28% of residents are 75–84, compared to the Maryland average of 31%. This is the second most common age bracket in assisted living, representing residents with moderate care needs. |
50% Residents Age 85–94 — State Benchmarked 50% of residents are 85–94, compared to the Maryland average of 44%. A high concentration of very elderly residents signals a higher-acuity facility with experience caring for advanced age-related needs. |
8% Residents Age 95+ — State Benchmarked 8% of residents are 95 or older, compared to the Maryland average of 16%. Most residents here have not yet reached the oldest-old bracket, suggesting a younger overall community. |
| Brightview Annapolis |
MC Memory Care Secured, specialized care for people living with Alzheimer's or dementia. Staff trained in cognitive impairment, with higher staff-to-resident ratios and an environment designed to reduce confusion and wandering risk.
AL Assisted Living A licensed, long-term care setting for seniors or individuals with disabilities who need help with daily activities — like bathing, dressing, and medication management — but not 24-hour skilled nursing. Offers housing, meals, and around-the-clock support while aiming to maximize resident independence. | Annapolis | 85 | Yes | 34 | Studio / Semi-Private Rooms | 7 |
27% Male Residents — State Benchmarked 27% of residents are male, compared to the Maryland average of 31%. This facility caters to a majority female resident pool (73% female), consistent with the broader assisted living trend where women significantly outnumber men. |
73% Female Residents — State Benchmarked 73% of residents are female, compared to the Maryland average of 69%. Women comprise the large majority, consistent with national assisted living demographics where women live longer and enter care facilities at higher rates. |
97% White Residents — State Benchmarked 97% of residents are reported as White, compared to the Maryland average of 82%. A higher White share than is typical for assisted living in Maryland in this dataset — compare with peer facilities for local context. |
0% African American Residents — State Benchmarked 0% of residents are reported as African American or Black, compared to the Maryland average of 12%. A lower African American share than is typical in Maryland; local markets still vary widely. |
3% Other Ethnicity Residents — State Benchmarked 3% of residents fall into categories other than White or African American (combined), compared to the Maryland average of 6%. This column aggregates Hispanic, Asian, multiracial, and any other labeled groups that are not classified as White or African American. Reported subgroups in this total: Hispanic (3%). |
3% Residents Age 65–74 — State Benchmarked 3% of residents are 65–74, compared to the Maryland average of 12%. Fewer younger seniors suggests the resident population skews older, likely requiring higher acuity care and more hands-on support. |
27% Residents Age 75–84 — State Benchmarked 27% of residents are 75–84, compared to the Maryland average of 31%. This is the second most common age bracket in assisted living, representing residents with moderate care needs. |
59% Residents Age 85–94 — State Benchmarked 59% of residents are 85–94, compared to the Maryland average of 44%. A high concentration of very elderly residents signals a higher-acuity facility with experience caring for advanced age-related needs. |
9% Residents Age 95+ — State Benchmarked 9% of residents are 95 or older, compared to the Maryland average of 16%. Most residents here have not yet reached the oldest-old bracket, suggesting a younger overall community. |
| Sunrise of Silver Spring |
AL Assisted Living A licensed, long-term care setting for seniors or individuals with disabilities who need help with daily activities — like bathing, dressing, and medication management — but not 24-hour skilled nursing. Offers housing, meals, and around-the-clock support while aiming to maximize resident independence.
MC Memory Care Secured, specialized care for people living with Alzheimer's or dementia. Staff trained in cognitive impairment, with higher staff-to-resident ratios and an environment designed to reduce confusion and wandering risk. | Silver Spring (New Hampshire Avenue) | 84 | Yes | 40 | Studio / Semi-Private Rooms | 24 |
31% Male Residents — State Benchmarked 31% of residents are male, compared to the Maryland average of 31%. This facility caters to a majority female resident pool (69% female), consistent with the broader assisted living trend where women significantly outnumber men. |
69% Female Residents — State Benchmarked 69% of residents are female, compared to the Maryland average of 69%. Women comprise the large majority, consistent with national assisted living demographics where women live longer and enter care facilities at higher rates. |
53% White Residents — State Benchmarked 53% of residents are reported as White, compared to the Maryland average of 82%. A lower White share than the Maryland average — the community may draw a more diverse resident mix relative to other facilities in Maryland. |
39% African American Residents — State Benchmarked 39% of residents are reported as African American or Black, compared to the Maryland average of 12%. A higher African American share than the typical Maryland average — useful context when comparing cultural fit and community composition. |
9% Other Ethnicity Residents — State Benchmarked 9% of residents fall into categories other than White or African American (combined), compared to the Maryland average of 6%. This column aggregates Hispanic, Asian, multiracial, and any other labeled groups that are not classified as White or African American. Reported subgroups in this total: Asian (4%), Hawaiian/Pacific Islander (3%), Hispanic (1%). |
4% Residents Age 65–74 — State Benchmarked 4% of residents are 65–74, compared to the Maryland average of 12%. Fewer younger seniors suggests the resident population skews older, likely requiring higher acuity care and more hands-on support. |
43% Residents Age 75–84 — State Benchmarked 43% of residents are 75–84, compared to the Maryland average of 31%. A high concentration in this mid-range bracket, where residents typically need moderate support with daily activities. |
37% Residents Age 85–94 — State Benchmarked 37% of residents are 85–94, compared to the Maryland average of 44%. The population here skews younger than the statewide norm, which may indicate a more active, lower-acuity community. |
14% Residents Age 95+ — State Benchmarked 14% of residents are 95 or older, compared to the Maryland average of 16%. In line with the statewide profile for the oldest resident bracket. |
| Modena Reserve at Kensington |
AL Assisted Living A licensed, long-term care setting for seniors or individuals with disabilities who need help with daily activities — like bathing, dressing, and medication management — but not 24-hour skilled nursing. Offers housing, meals, and around-the-clock support while aiming to maximize resident independence.
IL Independent Living Lifestyle-focused communities for older adults offering dining, activities, and transportation with minimal personal care. Best for active, independent seniors who want community without medical support.
MC Memory Care Secured, specialized care for people living with Alzheimer's or dementia. Staff trained in cognitive impairment, with higher staff-to-resident ratios and an environment designed to reduce confusion and wandering risk. | Kensington (Metropolitan Avenue) | 80 | No | 85 | Studio / Semi-Private Rooms | 4 | - | - | - | - | - | - | - | - | - |
| Assisted Living at Buckingham Manor |
AL Assisted Living A licensed, long-term care setting for seniors or individuals with disabilities who need help with daily activities — like bathing, dressing, and medication management — but not 24-hour skilled nursing. Offers housing, meals, and around-the-clock support while aiming to maximize resident independence. | Gwynn Oak (Lochearn) | 12 | No | 24 | Studio / Semi-Private Rooms | 13 |
33% Male Residents — State Benchmarked 33% of residents are male, compared to the Maryland average of 31%. This facility caters to a majority female resident pool (67% female), consistent with the broader assisted living trend where women significantly outnumber men. |
67% Female Residents — State Benchmarked 67% of residents are female, compared to the Maryland average of 69%. Women comprise the large majority, consistent with national assisted living demographics where women live longer and enter care facilities at higher rates. |
50% White Residents — State Benchmarked 50% of residents are reported as White, compared to the Maryland average of 82%. A lower White share than the Maryland average — the community may draw a more diverse resident mix relative to other facilities in Maryland. |
50% African American Residents — State Benchmarked 50% of residents are reported as African American or Black, compared to the Maryland average of 12%. A higher African American share than the typical Maryland average — useful context when comparing cultural fit and community composition. |
0% Other Ethnicity Residents — State Benchmarked 0% of residents fall into categories other than White or African American (combined), compared to the Maryland average of 6%. This column aggregates Hispanic, Asian, multiracial, and any other labeled groups that are not classified as White or African American. |
17% Residents Age 65–74 — State Benchmarked 17% of residents are 65–74, compared to the Maryland average of 12%. A higher share of younger seniors often signals a more independent, active resident community with lower acuity care needs. |
50% Residents Age 75–84 — State Benchmarked 50% of residents are 75–84, compared to the Maryland average of 31%. A high concentration in this mid-range bracket, where residents typically need moderate support with daily activities. | - | - |
Frequently Asked Questions about Assisted Living at Buckingham Manor
What neighborhood is Assisted Living at Buckingham Manor in?
Assisted Living at Buckingham Manor is in the Lochearn neighborhood of Gwynn Oak.
Is Assisted Living at Buckingham Manor in a walkable area?
Assisted Living at Buckingham Manor has a walk score of 24. Car-dependent. Most errands require a car, with limited nearby walkable options.
How many beds does Assisted Living at Buckingham Manor have?
Assisted Living at Buckingham Manor has 12 beds.
Are there photos of Assisted Living at Buckingham Manor?
Yes — there are 6 photos of Assisted Living at Buckingham Manor in the photo gallery on this page.
What is the address of Assisted Living at Buckingham Manor?
Assisted Living at Buckingham Manor is located at 4010 Buckingham Road, Gwynn Oak, MD 21207.
What is the phone number of Assisted Living at Buckingham Manor?
(410) 205-7568 will put you in contact with the team at Assisted Living at Buckingham Manor.
What county is Assisted Living at Buckingham Manor located in?
Assisted Living at Buckingham Manor is in Baltimore County.
Guides for Better Senior Living
Care Cost Calculator: See Prices in Your Area
Nursing Home Data Explorer
Don’t Wait Too Long: 7 Red Flag Signs Your Parent Needs Assisted Living Now
The True Cost of Assisted Living in 2025 – And How Families Are Paying For It
Understanding Senior Living Costs: Pricing Models, Discounts & Financial Assistance
Contact Us

Published on
Updated on
Feedback
Write a review for Assisted Living at Buckingham Manor
Rate your overall experience with this community
Explore Open Rooms
1
Contact details
2
What type of senior care service are you looking for?
3
What budget do you have in mind for senior care?
4
How soon do you need to find care?
5
Additional details
Thank you for your interest!
Our team will be in touch shortly to help with next steps.
Need Help?
Let us help you or a loved one find the perfect senior home.
