Astoria Skilled Nursing and Rehabilitation
Nursing Home & Assisted Living · Canton, OH
CMS overall rating Info CMS (the Centers for Medicare & Medicaid Services) is the federal agency that rates nursing home quality. Its Overall Rating runs from 1 to 5 stars, combining health inspections, staffing, and quality measures, with inspections weighted most heavily.

Astoria Skilled Nursing and Rehabilitation

Nursing Home & Assisted Living · Canton, OH
CMS overall rating Info CMS (the Centers for Medicare & Medicaid Services) is the federal agency that rates nursing home quality. Its Overall Rating runs from 1 to 5 stars, combining health inspections, staffing, and quality measures, with inspections weighted most heavily.
Calculator: See prices in your area
Astoria Skilled Nursing and Rehabilitation accepts Medicare, Medicaid, and private pay.

Overview of Astoria Skilled Nursing and Rehabilitation

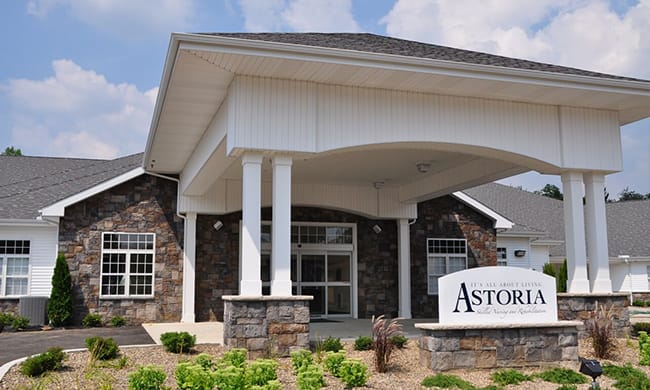
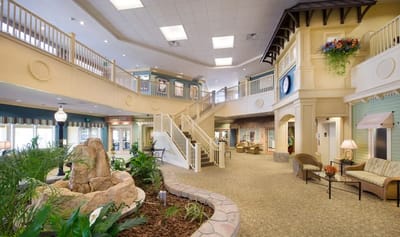
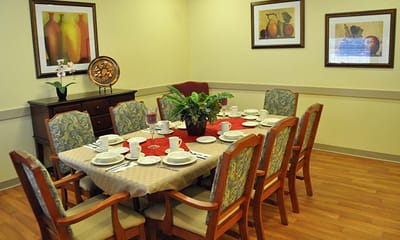
Considered one of the best nursing homes in Canton, offering an exquisite and inclusive atmosphere, Astoria Skilled Nursing and Rehabilitation provides resort-like accommodations with exceptional world-class hospitality in a tightly-knit setting. The upscale nursing center is gorgeous, offering a dedicated environment wherein every resident’s need is met.
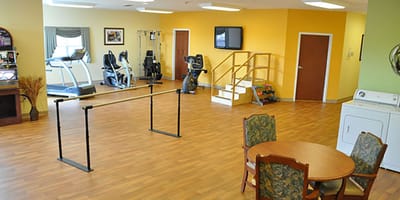
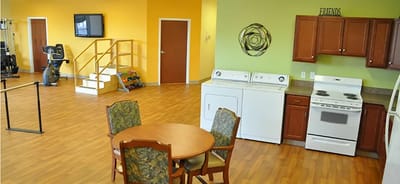
The Astoria nursing home is comprised of a team of well-trained professionals committed to providing compassionate care for senior recovery. Community services include 24-hour nursing care, memory care activities, engaging social activities and programs, and therapy services, including speech, occupational, and physical therapy. An individualized care plan also offers maximum care to unique seniors.

(330) 455-5500

Quality ratings

Measured by Centers for Medicare & Medicaid Services (CMS)

Overall rating Info The Overall CMS Rating combines results from health inspections, staffing levels and quality measures. Health inspections carry the most weight. Staffing and quality scores can increase or decrease the final rating based on performance compared to state and national standards.
▼ 68.6% Below OH avg. ▼ 68.6% Below OH avg.OH average: 3.2Click the badge to see the full State ranking.Click here to see the full State ranking.
Health Inspection Info Based on the results of the facility's three most recent standard inspections and any complaint investigations. CMS reviews the number, scope, and severity of deficiencies, with more recent findings weighted more heavily.
▼ 64.3% Below OH avg. ▼ 64.3% Below OH avg.OH average: 2.8Click the badge to see the full State ranking.Click here to see the full State ranking.
Staffing Info Measures average nursing staff hours per resident per day, including Registered Nurses (RNs) and total nursing staff. Ratings are adjusted based on the level of care residents require and are compared to state and national benchmarks.
▼ 59.1% Below OH avg. ▼ 59.1% Below OH avg.OH average: 2.4Click the badge to see the full State ranking.Click here to see the full State ranking.
Quality Measures Info Based on clinical and physical health indicators reported to CMS, such as hospital readmissions, falls, pressure ulcers, and improvements in mobility. These measures reflect how well residents' health needs are being managed.
▼ 8.2% Below OH avg. ▼ 8.2% Below OH avg.OH average: 4.4Click the badge to see the full State ranking.Click here to see the full State ranking.

Staffing hours breakdown

Info Daily nursing hours per resident by staff type, reported to CMS. Higher is generally better — compare this facility to state and national averages to see where staffing stands.

Hours per resident per day — compared to Ohio state averages

Total nursing care / resident Info This home is ranked 190th out of 210 homes in Ohio for nurse hours. Total adjusted nursing hours per resident per day, combining RN, LPN, and aide time. CMS adjusts this for case-mix so facilities can be fairly compared.
2h 55m per day
Rank #190 / 210Nurse hours — State benchmarkedThis home is ranked 190th out of 210 homes in Ohio. Shows adjusted nurse hours per resident per day benchmarked to the Ohio average, with a ranking across 210 Ohio facilities. More hours mean more direct care. The national average is about 3.5 hrs; below 3.0 is a red flag.Rankings are based only on facilities in Ohio that report data for that category. Facilities without available data are excluded from the ranking.Click the rank badge to see the full State ranking.Click here to see the full State ranking.
This facility Ohio avg (3h 32m per day)
vs Ohio avg
-17%

6 of 6 metrics below state avg

Staff typeHours / Day / Residentvs state avg
Registered Nurse (RN) Info RNs hold the highest nursing license and can assess residents, interpret test results, and direct care plans. More RN hours per day often signals stronger clinical oversight and faster response to health changes. 33m per day ▼ 12% State avg: 38m per day · National avg: 41m per day
LPN / LVN Info Licensed Practical Nurses (LPNs) or Licensed Vocational Nurses (LVNs) deliver routine hands-on care — medication administration, wound dressing, and monitoring vital signs. They work under RN supervision and make up a large share of daily bedside care. 28m per day ▼ 53% State avg: 58m per day · National avg: 52m per day
Nurse Aide Info Certified Nurse Aides (CNAs) provide the most direct day-to-day assistance: bathing, dressing, feeding, and mobility. Nurse aide hours are typically the largest staffing category and directly affect residents' quality of life. 1h 41m per day ▼ 21% State avg: 2h 8m per day · National avg: 2h 21m per day
Weekend Total Nursing Info Combined nursing hours (RN + LPN + Nurse Aide) per resident per day on weekends. Staffing often drops on weekends — this figure reveals whether the facility maintains adequate coverage outside of weekday hours. 2h 21m per day ▼ 28% State avg: 3h 17m per day · National avg: 3h 26m per day
Physical Therapist Info Hours per resident per day provided by licensed Physical Therapists (PTs) or PT Assistants. PT services help residents recover mobility after injury or illness and are especially important for post-acute (short-stay) rehabilitation. 0m per day ▼ 98% State avg: 3m per day · National avg: 4m per day
Weekend RN Info Registered nurse hours specifically on weekends. Facilities sometimes reduce RN presence on Saturdays and Sundays — a low weekend RN figure compared to weekday hours can indicate reduced clinical oversight when most administrative staff are absent. 22m per day ▼ 12% State avg: 25m per day · National avg: 29m per day

Capacity and availability

This home usually has availability

Similar occupancy to the Ohio average: 78.7%
Occupancy rate
78.8% Rank #136 / 211Occupancy rate — State benchmarkedThis home is ranked 136th out of 211 homes in Ohio. Shows this facility's occupancy rate versus the Ohio average, with its Statewide rank out of 211. Higher occupancy signals strong local demand and financial stability.Rankings are based only on facilities in Ohio that report data for that category. Facilities without available data are excluded from the ranking.Click the rank badge to see the full State ranking.Click here to see the full State ranking.
Avg. Length of Stay
53 days
Bed community size
83-bed community Rank #133 / 323Bed count — State benchmarkedThis home is ranked 133rd out of 323 homes in Ohio. Shows this facility's certified or reported bed count compared to other Ohio facilities. Larger communities may offer more amenities, programs, and on-site services for residents and families.Rankings are based only on facilities in Ohio that report data for that category. Facilities without available data are excluded from the ranking.Click the rank badge to see the full State ranking.Click here to see the full State ranking.
A larger shared setting that may offer more common spaces and organized community services.
Walk Score
Walk Score: 59 / 100 Rank #161 / 705Walk Score — State benchmarkedThis home is ranked 161st out of 705 homes in Ohio. Shows how walkable this facility's neighborhood is compared to the average Walk Score across Ohio facilities. Higher scores benefit residents, families, and staff.Rankings are based only on facilities in Ohio that report data for that category. Facilities without available data are excluded from the ranking.Click the rank badge to see the full State ranking.Click here to see the full State ranking.
Moderately walkable. Some errands can be accomplished on foot, with a mix of nearby amenities.

About this community

License Details

Accreditations2019 Bronze - Commitment to Quality Award by the American Health Care Association (AHCA)

Therapy & Rehabilitation

2 services
Rehabilitation Services
Respite Care

Staffing & Medical

1 service
24-Hour Staffing

Additional Services

1 service
Respite & Extended Care

Amenities & Lifestyle

Rehabilitation Gym
Private Rehab Suites
Dining Room
Whirlpool Spa
Therapy Gym
Golf Putting Green
Specific ProgramsPulmonary Program
Operating Hours24 hours a day, 7 days a week

Contact Astoria Skilled Nursing and Rehabilitation

Staffing Data

Reporting period: October 1 – December 31, 2025 (Q4 2025). Source: CMS Payroll-Based Journal report.

Total staff 79
Employees 76
Contractors 3
Staff to resident ratio 1.30 : 1
36% fewer staff per resident than Ohio average
Ohio average ratio: 2.04 : 1 Ohio average ratio: 2.04 : 1See full Ohio ranking
Avg staff/day 27
Average shift 8.1 hours
0% compared with Ohio average
Ohio average: 8.1 hours Ohio average shift: 8.1 hoursSee full Ohio ranking
Total staff hours (quarter) 20,164

Nursing staff breakdown

Q4 2025 · Oct 1 – Dec 31 More info This data comes from the CMS Payroll-Based Journal report covering October 1 – December 31, 2025.
Registered Nurse

Manages medical care and health needs.

RN Staff Info All 7 RN Staff are full-time employees. No contractors work on this role. 7
Average shift length Info Average shift length. Calculated as total hours divided by days worked and average staff per day. 9.5 hours
Licensed Practical Nurse

Assists with medical care and medications.

LPN Staff Info All 9 LPN Staff are full-time employees. No contractors work on this role. 9
Average shift length Info Average shift length. Calculated as total hours divided by days worked and average staff per day. 10.4 hours
Certified Nursing Assistant

Helps with daily care and mobility.

CNA Staff Info All 34 CNA Staff are full-time employees. No contractors work on this role. 34
Average shift length Info Average shift length. Calculated as total hours divided by days worked and average staff per day. 8.4 hours

Contractor staffing

Q4 2025 · Oct 1 – Dec 31 More info This data comes from the CMS Payroll-Based Journal report covering October 1 – December 31, 2025.

Total hours from contractors

0.7%

140 contractor hours this quarter

Clinical Nurse Specialist: 1 Medical Director: 1 Occupational Therapy Assistant: 1

Staff by category

Q4 2025 · Oct 1 – Dec 31 More info This data comes from the CMS Payroll-Based Journal report covering October 1 – December 31, 2025.
Certified Nursing Assistant340349,79392100%8.4
Licensed Practical Nurse9092,1699199%10.4
Registered Nurse7071,99392100%9.5
Speech Language Pathologist5051,4417480%7
Clinical Nurse Specialist2138037480%8
Physical Therapy Aide6067477885%5.4
Dietitian1015456571%8.4
Administrator1015286672%8
Mental Health Service Worker1015046368%8
RN Director of Nursing2024914650%8.8
Nurse Practitioner1014245358%8
Qualified Activities Professional1013935459%7.3
Occupational Therapy Aide1011522426%6.3
Qualified Social Worker1011075459%2
Occupational Therapy Assistant0112533%8.3
Physical Therapy Assistant303251011%2.3
Medical Director011191213%1.6
Respiratory Therapy Technician101633%2
34 Certified Nursing Assistant
% of Days 100%
9 Licensed Practical Nurse
% of Days 99%
7 Registered Nurse
% of Days 100%
5 Speech Language Pathologist
% of Days 80%
3 Clinical Nurse Specialist
% of Days 80%
6 Physical Therapy Aide
% of Days 85%
1 Dietitian
% of Days 71%
1 Administrator
% of Days 72%
1 Mental Health Service Worker
% of Days 68%
2 RN Director of Nursing
% of Days 50%
1 Nurse Practitioner
% of Days 58%
1 Qualified Activities Professional
% of Days 59%
1 Occupational Therapy Aide
% of Days 26%
1 Qualified Social Worker
% of Days 59%
1 Occupational Therapy Assistant
% of Days 3%
3 Physical Therapy Assistant
% of Days 11%
1 Medical Director
% of Days 13%
1 Respiratory Therapy Technician
% of Days 3%

Penalties and fines

Includes penalties issued in 2024-2025

Federal penalties imposed by CMS for regulatory violations, including civil money penalties (fines) and denials of payment for new Medicare/Medicaid admissions.

Source: CMS Penalties Database (Data as of Jan 2026)

Total fines amount $180K Rank #198 / 211Federal fines — State benchmarkedThis home is ranked 198th out of 211 homes in Ohio. Shows this facility's cumulative CMS federal fine dollars versus the Ohio average among facilities with fines, and where it ranks among 211 facilities in the pool. Lower total dollars mean a better rank.Rankings are based only on facilities in Ohio that report data for that category. Facilities without available data are excluded from the ranking.Click the rank badge to see the full State ranking.Click here to see the full State ranking.
162% higher than Ohio average

Ohio average: $69K

Number of fines 2
8% more fines than Ohio average

Ohio average: 1.9

Payment Denials Info Serious action where Medicare and/or Medicaid temporarily stops payments for new residents until issues are fixed. 0
100% fewer payment denials than Ohio average

Ohio average: 0.5

Fines amount comparison
This facility $180K
Ohio average $69K
Penalty History

Penalties are imposed by CMS for violations of federal nursing home regulations.

2 penalties in the past 3 years

Multiple penalties were reported in the last 3 years.

Civil Money Penalty Info Fines imposed for noncompliance, which can be assessed per day or per instance of violation. Jun 4, 2025
$92K
Civil Money Penalty Info Fines imposed for noncompliance, which can be assessed per day or per instance of violation. Jun 12, 2024
$88K

Last updated: Jan 2026

Quality of care over time

These measures show how residents usually do over time at this home, based on health outcomes and preventive care.

High-risk clinical events score Info A composite score based on pressure ulcers, falls with injury, weight loss, walking ability decline, and activities of daily living decline. 9.0
55% worse than Ohio average

Ohio average: 5.8

Functional decline score Info A composite score based on activities of daily living decline, walking ability decline, and incontinence. 20.1
58% worse than Ohio average

Ohio average: 12.7

Long-stay resident measures
Above average Ohio avg: 4.7 Info CMS star rating based on long-stay quality measure performance. 5 stars = significantly above average, 1 star = significantly below average.
Need for Help with Daily Activities Increased Info Percent of long-stay residents whose need for help with daily activities has increased 9.2%
35% worse than Ohio average

Ohio average: 6.8%

Walking Ability Worsened Info Percent of long-stay residents whose ability to move independently worsened 23.1%
159% worse than Ohio average

Ohio average: 8.9%

Low Risk Residents with Bowel/Bladder Incontinence Info Percent of low risk long-stay residents who lose control of their bowels or bladder 27.9%
27% worse than Ohio average

Ohio average: 22.0%

Falls with Major Injury Info Percent of long-stay residents experiencing one or more falls with major injury 2.0%
42% better than Ohio average

Ohio average: 3.4%

High Risk Residents with Pressure Ulcers Info Percent of long-stay high risk residents with pressure ulcers 3.7%
6% better than Ohio average

Ohio average: 3.9%

Urinary Tract Infection Info Percent of long-stay residents with a urinary tract infection 0.0%
100% better than Ohio average

Ohio average: 0.5%

Lost Too Much Weight Info Percent of long-stay residents who lose too much weight 7.2%
16% worse than Ohio average

Ohio average: 6.2%

Depressive Symptoms Info Percent of long-stay residents who have depressive symptoms 45.3%
89% worse than Ohio average

Ohio average: 24.0%

Antipsychotic Use Info Percent of long-stay residents who received an antipsychotic medication 13.6%
61% worse than Ohio average

Ohio average: 8.4%

Pneumococcal Vaccine Info Percent of long-stay residents assessed and appropriately given the pneumococcal vaccine 96.6%
5% better than Ohio average

Ohio average: 92.4%

Influenza Vaccine Info Percent of long-stay residents assessed and appropriately given the seasonal influenza vaccine 100.0%
6% better than Ohio average

Ohio average: 94.5%

Short-stay resident measures
Pneumococcal Vaccine Info Percent of short-stay residents assessed and appropriately given the pneumococcal vaccine 96.8%
24% better than Ohio average

Ohio average: 78.0%

Antipsychotic medication increase Info Percent of short-stay residents who newly received an antipsychotic medication 1.6%
23% worse than Ohio average

Ohio average: 1.3%

Influenza Vaccine Info Percent of short-stay residents assessed and appropriately given the seasonal influenza vaccine 100.0%
32% better than Ohio average

Ohio average: 75.6%

Successful return to home or community Info Rate of successful return to home or community from a skilled nursing facility. 55.0%
9% better than Ohio average

Ohio average: 50.6%

Breakdown by payment type

Medicare

17% of new residents, usually for short-term rehab.

Typical stay 17 days

Private pay

37% of new residents, often for short stays.

Typical stay 1 - 2 months

Medicaid

46% of new residents, often for long-term daily care.

Typical stay 3 - 4 months

Facility Characteristics

Source: CMS Long-Term Care Facility Characteristics (Data as of Jan 2026)

Total residents 61
Medicare
2
3.3% of residents
Medicaid
48
78.7% of residents
Private pay or other
11
18% of residents
Programs & Services
Residents Group

Residents meet regularly to discuss policies, care quality, and activities

Family Member Group

Family members meet regularly to discuss policies, care quality, and activities

Active Family Council

Organized group of family members that meets regularly to discuss facility policies, resident care, and activities.

Active Resident Council

Organized group of residents that meets regularly to discuss facility policies, quality of life, and activities.

Finances and operations

Based on CMS SNF Cost Report for fiscal year ending in 12/2023.

Voluntary non-profit community
Operated by a church.
Net patient revenue Info Net patient revenue — what the home actually collects for resident care, after contractual allowances, bad debt and discounts are subtracted from its gross charges (CMS cost report, Worksheet G-3). It covers resident care only; money the home earns from other sources is shown separately as "Other income."
$9.1M
Net patient income Info Net patient income: net patient revenue minus the home's total operating expenses. A positive figure means it earns more from resident care than it spends to deliver it; a negative figure means the opposite. It excludes non-operating "other income."
-$367.5K
Voluntary non-profit community Operated by a church.
Net patient revenue Info Net patient revenue — what the home actually collects for resident care, after contractual allowances, bad debt and discounts are subtracted from its gross charges (CMS cost report, Worksheet G-3). It covers resident care only; money the home earns from other sources is shown separately as "Other income."
$9.1M Rank #120 / 210Revenue — State benchmarkedThis home is ranked 120th out of 210 homes in Ohio. Shows this facility's annual revenue compared to the Ohio average. Higher revenue generally means more resources for staffing and capital — read alongside Payroll %.Rankings are based only on facilities in Ohio that report data for that category. Facilities without available data are excluded from the ranking.Click the rank badge to see the full State ranking.Click here to see the full State ranking.
Net patient income Info Net patient income: net patient revenue minus the home's total operating expenses. A positive figure means it earns more from resident care than it spends to deliver it; a negative figure means the opposite. It excludes non-operating "other income."
-$367.5K
Other income Info Money the home earns outside of resident care — such as investments, grants, rentals and other non-operating sources (CMS cost report, Worksheet G-3). It is tracked separately from net patient revenue: it is not part of that figure, and it is not included in net patient income.
$578.7K
Payroll costs Info Staff salaries plus wage-related costs — benefits such as payroll taxes, health insurance and retirement — from the home's own accounting records (CMS cost report, Worksheet A). Contract or agency labor is counted separately, under other operating costs. Rank #127 / 210Payroll — State benchmarkedThis home is ranked 127th out of 210 homes in Ohio. Shows total annual staff payroll benchmarked to the Ohio average. Higher payroll investment relative to peers often signals better staffing and less reliance on cheaper contract labor.Rankings are based only on facilities in Ohio that report data for that category. Facilities without available data are excluded from the ranking.Click the rank badge to see the full State ranking.Click here to see the full State ranking.
$4.0M 44.1% of net patient revenue Info Payroll as a share of revenue: staff salaries and wage-related benefits divided by net patient revenue. A higher figure means more of each revenue dollar goes to staff pay. Rank #124 / 210Payroll % — State benchmarkedThis home is ranked 124th out of 210 homes in Ohio. Shows payroll as a percentage of revenue versus the Ohio average. Well-run Ohio facilities typically land around 54–64% — the top third Statewide. Below 25% may signal understaffing or heavy agency use — read with Staffing ratings.Rankings are based only on facilities in Ohio that report data for that category. Facilities without available data are excluded from the ranking.Click the rank badge to see the full State ranking.Click here to see the full State ranking.
Other operating costs Info Everything it costs to run the home apart from payroll — food, utilities, supplies, maintenance, contract labor and administration. Calculated as total operating expense minus payroll (staff salaries and wage-related benefits).
$5.4M
Total costs Info The home's total operating expense for the year — all the costs of running it, salaries included (CMS cost report, Worksheet G-3).
$9.4M

Who this home usually serves

TYPE OF STAY

Mostly long-term care residents

Most residents stay for extended periods and receive ongoing daily care.

New residents most often arrive under Medicaid (46% of admissions), and a typical Medicaid stay runs around 3 - 4 months.

Admissions
353 total

Coverage residents most often arrive under.

Medicare 17%
Private pay 37%
Medicaid 46%
Discharges
454 total

Coverage residents most often leave under.

Medicare 7%
Private pay 42%
Medicaid 51%

Places of interest near Astoria Skilled Nursing and Rehabilitation

Address 2.1 miles from city center Info Estimated distance in miles from Canton's city center to Astoria Skilled Nursing and Rehabilitation's address, calculated via Google Maps. — 0.88 miles to nearest hospital (Fresenius Medical Care @ Mercy Medical Center)

Calculate Travel Distance to Astoria Skilled Nursing and Rehabilitation

Add your location

Address

Compare Nursing Homes around Canton

The information below is reported by the Ohio Department of Health, Bureau of Survey and Certification.

5 facilities compared · CMS & OH Dept. of Health data

Windsor Medical Center
NH
AL
North Canton
20
Facility 20
OH AVG 78
Rank #311 / 323
90.0%
Facility 90.0%
OH AVG 78.7%
Rank #69 / 211
+14%
6.36
Facility 6.36
OH AVG 3.54
Rank #4 / 210
-12%+80%
$6.5k
Facility $6.5k
OH AVG $74.0k
Rank #149 / 211
5
Facility 5
OH AVG 30.9
Rank #11 / 210
2.5
Facility 2.5
OH AVG 4.6
Rank #27 / 210
118A+
31
Facility 31
OH AVG 40
Rank #433 / 705
Thomas Swallen
$3.0M
Facility $3.0M
OH AVG $10.1M
Rank #205 / 210
$3.0M
Facility $3.0M
OH AVG $3.9M
Rank #178 / 210
101.7%
Facility 101.7%
OH AVG 40.2%
Rank #3 / 210
366456
Bethany
NH
AL
Canton (Edgefield)
86
Facility 86
OH AVG 78
Rank #123 / 323
90.7%
Facility 90.7%
OH AVG 78.7%
Rank #64 / 211
+15%
5.10
Facility 5.10
OH AVG 3.54
Rank #14 / 210
-15%+44%
$0
Facility $0
OH AVG $74.0k
Rank #1 / 211
8
Facility 8
OH AVG 30.9
Rank #21 / 210
4.0
Facility 4.0
OH AVG 4.6
Rank #95 / 210
-81-
54
Facility 54
OH AVG 40
Rank #209 / 705
Elizabeth Baum
$8.7M
Facility $8.7M
OH AVG $10.1M
Rank #138 / 210
$6.3M
Facility $6.3M
OH AVG $3.9M
Rank #63 / 210
72.5%
Facility 72.5%
OH AVG 40.2%
Rank #7 / 210
366334
Canton Christian Home
NH
AL
NC
RC
Canton
84
Facility 84
OH AVG 78
Rank #127 / 323
66.7%
Facility 66.7%
OH AVG 78.7%
Rank #175 / 211
-15%
4.52
Facility 4.52
OH AVG 3.54
Rank #22 / 210
-35%+28%
$9.1k
Facility $9.1k
OH AVG $74.0k
Rank #151 / 211
31
Facility 31
OH AVG 30.9
Rank #117 / 210
6.2
Facility 6.2
OH AVG 4.6
Rank #186 / 210
549A+
53
Facility 53
OH AVG 40
Rank #223 / 705
Ray Beal
$5.2M
Facility $5.2M
OH AVG $10.1M
Rank #164 / 210
$3.4M
Facility $3.4M
OH AVG $3.9M
Rank #116 / 210
64.3%
Facility 64.3%
OH AVG 40.2%
Rank #10 / 210
366300
McKinley Health Care Center
NH
AL
Canton (Downtown Canton)
176
Facility 176
OH AVG 78
Rank #7 / 323
88.6%
Facility 88.6%
OH AVG 78.7%
Rank #81 / 211
+13%
3.34
Facility 3.34
OH AVG 3.54
Rank #131 / 210
-58%-6%
$0
Facility $0
OH AVG $74.0k
Rank #1 / 211
42
Facility 42
OH AVG 30.9
Rank #165 / 210
4.2
Facility 4.2
OH AVG 4.6
Rank #111 / 210
1152-
84
Facility 84
OH AVG 40
Rank #11 / 705
Rothner Health Ventures I
$13.3M
Facility $13.3M
OH AVG $10.1M
Rank #35 / 210
$7.5M
Facility $7.5M
OH AVG $3.9M
Rank #35 / 210
56.2%
Facility 56.2%
OH AVG 40.2%
Rank #90 / 210
365655
Astoria Skilled Nursing and Rehabilitation
NH
AL
Canton (Meyers Lake)
83
Facility 83
OH AVG 78
Rank #133 / 323
78.8%
Facility 78.8%
OH AVG 78.7%
Rank #136 / 211
0%
2.92
Facility 2.92
OH AVG 3.54
Rank #190 / 210
-3%-17%
$147.9k
Facility $147.9k
OH AVG $74.0k
Rank #198 / 211
58
Facility 58
OH AVG 30.9
Rank #189 / 210
3.9
Facility 3.9
OH AVG 4.6
Rank #92 / 210
663-
59
Facility 59
OH AVG 40
Rank #161 / 705
-
$9.1M
Facility $9.1M
OH AVG $10.1M
Rank #120 / 210
$4.0M
Facility $4.0M
OH AVG $3.9M
Rank #127 / 210
44.1%
Facility 44.1%
OH AVG 40.2%
Rank #124 / 210
366391

Financial Assistance for
Nursing Home in Ohio

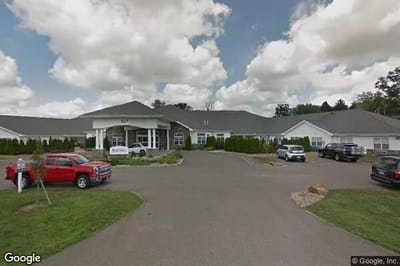
Astoria Skilled Nursing and Rehabilitation is located in Canton, Ohio.
Here are the financial assistance programs available to residents in Ohio.

Get Financial aid guidance

PASSPORT Waiver

Ohio Medicaid PASSPORT

Age 60+
General Ohio resident, Medicaid-eligible, nursing home-level care need.
Income Limits (2025) ~$2,829/month 300% FBR, individual
Asset Limits $2,000 (individual), $3,000 (couple).
OH

Administered through regional agencies; waitlists possible.

Benefits
Personal care (5-7 hours/day) Respite (240 hours/year) Adult day care ($65/day) Home modifications ($1,500 avg.)

Ohio Home Care Program (non-Medicaid)

OH HCP

Age 60+
General Ohio resident, at risk of decline.
Income Limits ~$2,000/month individual, varies
Asset Limits $5,000 individual
OH

Limited funding; regional variation.

Benefits
In-home care (3-5 hours/week) Respite (up to 10 days/year) Transportation (~5 trips/month)

Assisted Living Waiver (ALW)

Ohio Assisted Living Waiver

Age 21+ (65+ prioritized)
General OH resident, Medicaid-eligible, NFLOC.
Income Limits (2025) ~$2,829/month (individual); QIT required.
Asset Limits $2,000 (individual), $3,000 (couple).
OH

Covers ~300 facilities; room/board not included (separate cost).

Benefits
Personal care Meals Medication management Transportation (~$3,000-$4,000/month value)

Program of All-Inclusive Care for the Elderly (PACE)

Ohio PACE (e.g., McGregor PACE)

Age 55+
General OH resident (specific counties), NFLOC, safe with PACE support.
Income Limits (2025) ~$2,829/month (Medicaid-eligible); private pay option available.
Asset Limits $2,000 (individual), $3,000 (couple) for Medicaid enrollees.
OH

Available in 9 counties (e.g., Cuyahoga, Franklin); expanding via Healthy Aging Grants.

Benefits
Personal care (5-7 hours/day) Medical care Meals Transportation Respite Therapies

Medicare Savings Program (MSP)

Ohio Medicare Savings Program

Age 65+ or disabled
General OH resident, Medicare Part A/B.
Income Limits (2025) ~$2,510/month (QMB), ~$3,380/month (SLMB), ~$3,598/month (QI)—individual.
Asset Limits $9,430 (individual), $14,130 (couple).
OH

Three tiers; includes Extra Help for Part D; no waitlist.

Benefits
Covers Part B premiums ($174.70/month) Deductibles ($240/year) Copays (~20%)

Home Energy Assistance Program (HEAP)

Ohio HEAP

Age 60+ prioritized
General OH resident, low-income household.
Income Limits (2025) ~$3,970/month individual, 185% FPL
Asset Limits Not assessed; income-focused.
OH

Covers gas, electric, oil; emergency aid via Winter/Summer Crisis Programs.

Benefits
Heating/cooling aid ($300-$1,000/season) Emergency aid ($500 max)

Family Caregiver Support Program (FCSP)

Ohio Family Caregiver Support Program

Age
General Caregivers of 60+ needing care or 55+ caregivers of others; OH resident; functional needs (2+ ADLs).
Income Limits (2025) Prioritizes ~$24,980/year (individual); no strict cap.
Asset Limits Not assessed; need-based.
OH

12 AAAs; rural/low-income priority; volunteer respite option.

Benefits
Respite (4-6 hours/week or 5 days/year) Adult day care ($60/day) Training Supplies (~$500/year)

VA Aid and Attendance (A&A) and Housebound Benefits

Ohio VA Aid and Attendance/Housebound

Age 65+ or disabled veteran/spouse
General OH resident, wartime service, need for ADL help (A&A) or homebound.
Income Limits (2025) Net income < ~$1,984/month (veteran with dependent, A&A); pension offsets income.
Asset Limits ~$155,356 net worth limit
OH

High veteran demand; supports care in multiple settings.

Benefits
Cash (~$1,433-$2,642/month veteran, ~$951-$1,318 spouse) for care costs (e.g., in-home, assisted living)

Homestead Exemption

Ohio Homestead Exemption

Age 65+ (or disabled)
General OH resident, homeowner, low-income.
Income Limits (2025) ~$38,500/year individual, adjusted annually
Asset Limits Not assessed; home ownership required.
OH

Reduces taxable value by $25,000; applies to primary residence.

Benefits
Tax reduction (~$400-$800/year avg., varies by county)

Save the Dream Ohio (Homeowner Assistance Fund)

Ohio Save the Dream

Age 60+ prioritized
General OH resident, homeowner, hardship post-Jan 21, 2020.
Income Limits (2025) ~$147,600/year family of 4, 150% AMI; varies by county
Asset Limits Not assessed; hardship-focused.
OH

Covers delinquent mortgages, utilities, taxes; max $25,000 mortgage aid.

Benefits
Mortgage aid ($25,000 max) Utility/property tax aid ($5,000 avg.)

Frequently Asked Questions about Astoria Skilled Nursing and Rehabilitation

What neighborhood is Astoria Skilled Nursing and Rehabilitation in?

Astoria Skilled Nursing and Rehabilitation is in the Meyers Lake neighborhood.

Is Astoria Skilled Nursing and Rehabilitation in a walkable area?

Astoria Skilled Nursing and Rehabilitation has a walk score of 59. Moderately walkable. Some errands can be accomplished on foot, with a mix of nearby amenities.

What is the occupancy rate at Astoria Skilled Nursing and Rehabilitation?

Astoria Skilled Nursing and Rehabilitation's occupancy is 78.8%.

Are there photos of Astoria Skilled Nursing and Rehabilitation?

Yes — there are 9 photos of Astoria Skilled Nursing and Rehabilitation in the photo gallery on this page.

What is the address of Astoria Skilled Nursing and Rehabilitation?

Astoria Skilled Nursing and Rehabilitation is located at 3537 12Th St Nw, Canton, OH 44708.

What is the phone number of Astoria Skilled Nursing and Rehabilitation?

(330) 455-5500 will put you in contact with the team at Astoria Skilled Nursing and Rehabilitation.

Is Astoria Skilled Nursing and Rehabilitation Medicare or Medicaid certified?

Yes — Astoria Skilled Nursing and Rehabilitation is a CMS-certified provider of Medicare and Medicaid.

Guides for Better Senior Living

Care Cost Calculator: See Prices in Your Area

Nursing Home Data Explorer

Don’t Wait Too Long: 7 Red Flag Signs Your Parent Needs Assisted Living Now

The True Cost of Assisted Living in 2025 – And How Families Are Paying For It

Understanding Senior Living Costs: Pricing Models, Discounts & Financial Assistance