Atlas Healthcare Washington Township
Nursing Home & Nursing Care · Sewell, NJ
CMS overall rating Info The Overall CMS Rating is scored from 1 to 5 stars and combines results from health inspections, staffing levels, and quality measures. Health inspections carry the most weight. Staffing and quality scores can increase or decrease the final rating based on performance compared to state and national standards.

Atlas Healthcare Washington Township

Nursing Home & Nursing Care · Sewell, NJ
CMS overall rating Info The Overall CMS Rating is scored from 1 to 5 stars and combines results from health inspections, staffing levels, and quality measures. Health inspections carry the most weight. Staffing and quality scores can increase or decrease the final rating based on performance compared to state and national standards.
Calculator: See prices in your area
Atlas Healthcare Washington Township accepts Medicare, Medicaid, and private pay.

Overview of Atlas Healthcare Washington Township

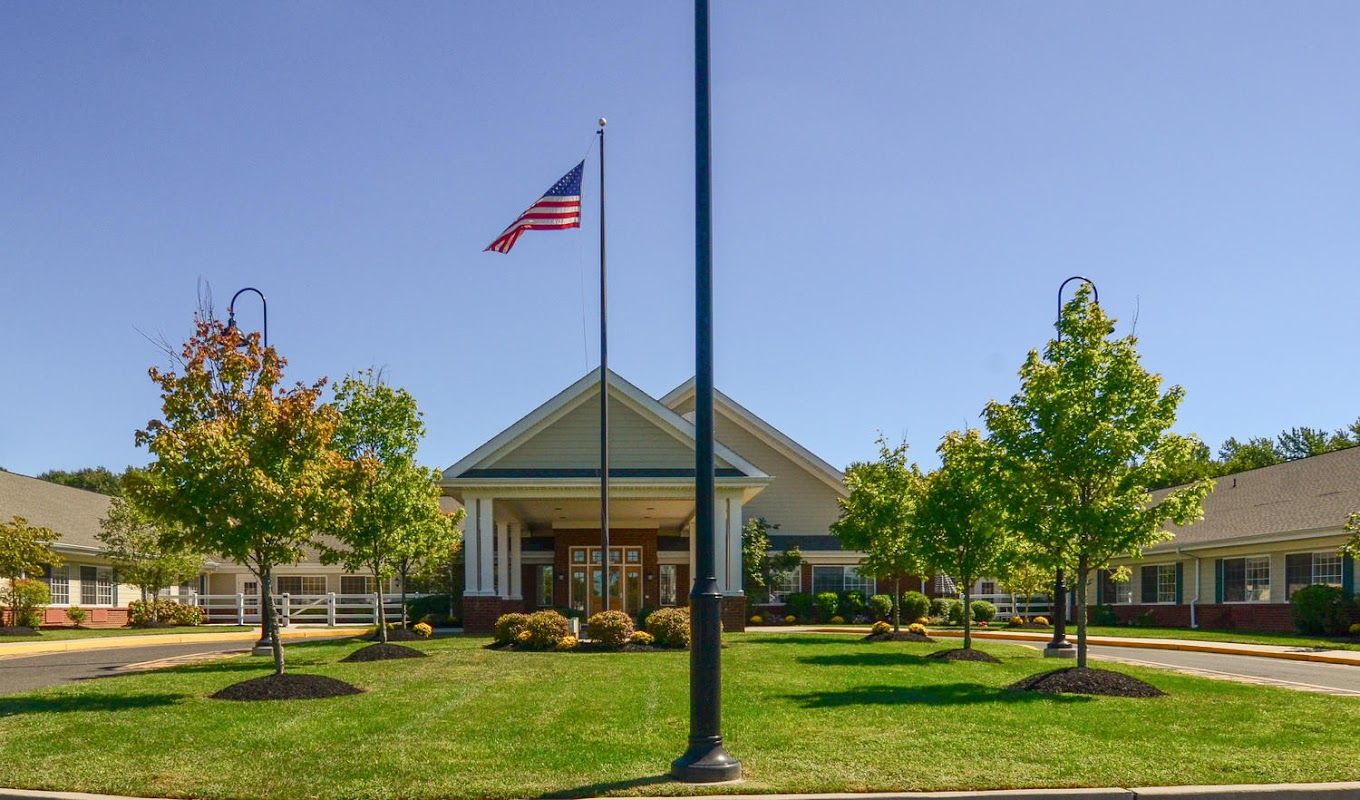
Atlas Healthcare Washington Township is a welcoming senior living community in Sewell, NJ that offers rehabilitation and long-term care. Residents here recover in their well-appointed rooms with housekeeping, maintenance, and laundry services for their convenience. An excellent care team customizes residents’ care plans based on their needs and preferences–making sure they receive the proper care and treatments.

The community offers physical, speech, and occupational therapies in their fully equipped rehabilitation gym to help residents maintain their overall functionality. These are combined with exciting activities and events to keep them happy and entertained. Amenities like relaxing outdoor areas, a spacious day room, and activity room are also offered to make their lives enjoyable.

(856) 218-4200

Quality ratings

Measured by Centers for Medicare & Medicaid Services (CMS)

Overall rating Info The Overall CMS Rating combines results from health inspections, staffing levels and quality measures. Health inspections carry the most weight. Staffing and quality scores can increase or decrease the final rating based on performance compared to state and national standards.
▼ 8.0% Below NJ avg. ▼ 8.0% Below NJ avg.Click the badge to see the full State ranking.Click here to see the full State ranking.
Health Inspection Info Based on the results of the facility's three most recent standard inspections and any complaint investigations. CMS reviews the number, scope, and severity of deficiencies, with more recent findings weighted more heavily.
▼ 28.0% Below NJ avg. ▼ 28.0% Below NJ avg.Click the badge to see the full State ranking.Click here to see the full State ranking.
Staffing Info Measures average nursing staff hours per resident per day, including Registered Nurses (RNs) and total nursing staff. Ratings are adjusted based on the level of care residents require and are compared to state and national benchmarks.
▼ 34.4% Below NJ avg. ▼ 34.4% Below NJ avg.Click the badge to see the full State ranking.Click here to see the full State ranking.
Quality Measures Info Based on clinical and physical health indicators reported to CMS, such as hospital readmissions, falls, pressure ulcers, and improvements in mobility. These measures reflect how well residents' health needs are being managed.
▲ 16.1% Above NJ avg. ▲ 16.1% Above NJ avg.Click the badge to see the full State ranking.Click here to see the full State ranking.

Staffing hours breakdown

Info Daily nursing hours per resident by staff type, reported to CMS. Higher is generally better — compare this facility to state and national averages to see where staffing stands.

Hours per resident per day — compared to New Jersey state averages

Total nursing care / resident Info This home is ranked 244th out of 274 homes in New Jersey. Total adjusted nursing hours per resident per day, combining RN, LPN, and aide time. CMS adjusts this for case-mix so facilities can be fairly compared.
3h 8m per day
Rank #244 / 274Nurse hours — State benchmarkedThis home is ranked 244th out of 274 homes in New Jersey. Shows adjusted nurse hours per resident per day benchmarked to the New Jersey average, with a ranking across 274 New Jersey SNFs. More hours mean more direct care. The national average is about 3.5 hrs; below 3.0 is a red flag.Click the rank badge to see the full State ranking.Click here to see the full State ranking.
This facility New Jersey avg (3h 53m per day)
vs New Jersey avg
-19%

4 of 6 metrics below state avg

Standout metric LPN / LVN is +23% above state avg
Staff typeHours / Day / Residentvs state avg
Registered Nurse (RN) Info RNs hold the highest nursing license and can assess residents, interpret test results, and direct care plans. More RN hours per day often signals stronger clinical oversight and faster response to health changes. 29m per day ▼ 29% State avg: 41m per day · National avg: 41m per day
LPN / LVN Info Licensed Practical Nurses (LPNs) or Licensed Vocational Nurses (LVNs) deliver routine hands-on care — medication administration, wound dressing, and monitoring vital signs. They work under RN supervision and make up a large share of daily bedside care. 1h 9m per day ▲ 23% State avg: 56m per day · National avg: 52m per day
Nurse Aide Info Certified Nurse Aides (CNAs) provide the most direct day-to-day assistance: bathing, dressing, feeding, and mobility. Nurse aide hours are typically the largest staffing category and directly affect residents' quality of life. 1h 53m per day ▼ 16% State avg: 2h 14m per day · National avg: 2h 21m per day
Weekend Total Nursing Info Combined nursing hours (RN + LPN + Nurse Aide) per resident per day on weekends. Staffing often drops on weekends — this figure reveals whether the facility maintains adequate coverage outside of weekday hours. 3h 12m per day ▼ 7% State avg: 3h 27m per day · National avg: 3h 26m per day
Physical Therapist Info Hours per resident per day provided by licensed Physical Therapists (PTs) or PT Assistants. PT services help residents recover mobility after injury or illness and are especially important for post-acute (short-stay) rehabilitation. 6m per day ■ Avg State avg: 6m per day · National avg: 4m per day
Weekend RN Info Registered nurse hours specifically on weekends. Facilities sometimes reduce RN presence on Saturdays and Sundays — a low weekend RN figure compared to weekday hours can indicate reduced clinical oversight when most administrative staff are absent. 19m per day ▼ 34% State avg: 29m per day · National avg: 29m per day

Types of Care at Atlas Healthcare Washington Township

Nursing Care

Capacity and availability

This home usually has limited availability

Occupancy between 85% and 95% suggests balanced demand.

Higher occupancy than the New Jersey average: 77%
Occupancy rate 90.6% Rank #92 / 493Occupancy rate — State benchmarkedThis home is ranked 92nd out of 493 homes in New Jersey. Shows this facility's occupancy rate versus the New Jersey average, with its Statewide rank out of 493. Higher occupancy signals strong local demand and financial stability.Click the rank badge to see the full State ranking.Click here to see the full State ranking.
Avg. Length of Stay 38 days
Occupancy rate
90.6% Rank #92 / 493Occupancy rate — State benchmarkedThis home is ranked 92nd out of 493 homes in New Jersey. Shows this facility's occupancy rate versus the New Jersey average, with its Statewide rank out of 493. Higher occupancy signals strong local demand and financial stability.Click the rank badge to see the full State ranking.Click here to see the full State ranking.
Avg. Length of Stay
38 days
Walk Score
Walk Score: 26 / 100 Rank #461 / 640Walk Score — State benchmarkedThis home is ranked 461st out of 640 homes in New Jersey. Shows how walkable this facility's neighborhood is compared to the average Walk Score across New Jersey SNFs. Higher scores benefit residents, families, and staff.Click the rank badge to see the full State ranking.Click here to see the full State ranking.
Somewhat walkable. A few nearby services may be reachable on foot, but most trips require transportation.

Contact Atlas Healthcare Washington Township

Staffing Data

Reporting period: October 1 – December 31, 2025 (Q4 2025). Source: CMS Payroll-Based Journal report.

Total staff 168
Employees 118
Contractors 50
Staff to resident ratio 1.65:1
8% worse than New Jersey average
New Jersey average ratio: 1.79:1 New Jersey average ratio: 1.79:1See full New Jersey ranking
Avg staff/day 70
Average shift 7.6 hours
5% worse than New Jersey average
New Jersey average: 8 hours New Jersey average shift: 8 hoursSee full New Jersey ranking
Total staff hours (quarter) 49,124

Nursing staff breakdown

Q4 2025 · Oct 1 – Dec 31 More info This data comes from the CMS Payroll-Based Journal report covering October 1 – December 31, 2025.
Registered Nurse

Manages medical care and health needs.

RN Staff 16
Average shift length Info Average shift length. Calculated as total hours divided by days worked and average staff per day. 8 hours

This role is partially covered by contractors.

Licensed Practical Nurse

Assists with medical care and medications.

LPN Staff 31
Average shift length Info Average shift length. Calculated as total hours divided by days worked and average staff per day. 8.4 hours

This role is partially covered by contractors.

Certified Nursing Assistant

Helps with daily care and mobility.

CNA Staff 62
Average shift length Info Average shift length. Calculated as total hours divided by days worked and average staff per day. 8 hours

This role is partially covered by contractors.

Contractor staffing

Q4 2025 · Oct 1 – Dec 31 More info This data comes from the CMS Payroll-Based Journal report covering October 1 – December 31, 2025.

Total hours from contractors

15.8%

7,771 contractor hours this quarter

Clinical Nurse Specialist: 10 Registered Nurse: 7 Physical Therapy Aide: 7 Physical Therapy Assistant: 6 Respiratory Therapy Technician: 6 Speech Language Pathologist: 5 Qualified Social Worker: 3 Licensed Practical Nurse: 2 Certified Nursing Assistant: 1 Occupational Therapy Assistant: 1 Qualified Activities Professional: 1 Medical Director: 1

Staff by category

Q4 2025 · Oct 1 – Dec 31 More info This data comes from the CMS Payroll-Based Journal report covering October 1 – December 31, 2025.
Certified Nursing Assistant6116221,80792100%8
Licensed Practical Nurse2923111,47792100%8.4
Registered Nurse97162,67092100%8
Physical Therapy Aide0771,9428693%7.1
Other Dietary Services Staff8081,82792100%6
Clinical Nurse Specialist310131,80292100%4.8
RN Director of Nursing3031,4247076%8
Physical Therapy Assistant0661,1177480%7.4
Respiratory Therapy Technician0661,0107885%7.1
Qualified Social Worker0339679098%8.1
Dental Services Staff2029646975%7.9
Dietitian1015206571%8
Nurse Practitioner1015046368%8
Administrator1014645863%8
Speech Language Pathologist0554136874%5.2
Medical Director0111241213%10.3
Occupational Therapy Assistant01172910%8
Qualified Activities Professional011211112%1.9
62 Certified Nursing Assistant
% of Days 100%
31 Licensed Practical Nurse
% of Days 100%
16 Registered Nurse
% of Days 100%
7 Physical Therapy Aide
% of Days 93%
8 Other Dietary Services Staff
% of Days 100%
13 Clinical Nurse Specialist
% of Days 100%
3 RN Director of Nursing
% of Days 76%
6 Physical Therapy Assistant
% of Days 80%
6 Respiratory Therapy Technician
% of Days 85%
3 Qualified Social Worker
% of Days 98%
2 Dental Services Staff
% of Days 75%
1 Dietitian
% of Days 71%
1 Nurse Practitioner
% of Days 68%
1 Administrator
% of Days 63%
5 Speech Language Pathologist
% of Days 74%
1 Medical Director
% of Days 13%
1 Occupational Therapy Assistant
% of Days 10%
1 Qualified Activities Professional
% of Days 12%

Penalties and fines

Includes penalties issued in 2023

Federal penalties imposed by CMS for regulatory violations, including civil money penalties (fines) and denials of payment for new Medicare/Medicaid admissions.

Source: CMS Penalties Database (Data as of Jan 2026)

Total fines amount $96K Rank #244 / 276Federal fines — State benchmarkedThis home is ranked 244th out of 276 homes in New Jersey. Shows this facility's cumulative CMS federal fine dollars versus the New Jersey average among facilities with fines, and where it ranks among 276 skilled nursing facilities in the pool. Lower total dollars mean a better rank.Click the rank badge to see the full State ranking.Click here to see the full State ranking.
25% higher than New Jersey average

New Jersey average: $77K

Number of fines 3
49% more fines than New Jersey average

New Jersey average: 2.0

Payment Denials Info Serious action where Medicare and/or Medicaid temporarily stops payments for new residents until issues are fixed. 0
100% fewer payment denials than New Jersey average

New Jersey average: 0.1

Fines amount comparison
This facility $96K
New Jersey average $77K
Penalty History

Penalties are imposed by CMS for violations of federal nursing home regulations.

2 penalties in the past 3 years

Multiple penalties were reported in the last 3 years.

Civil Money Penalty Info Fines imposed for noncompliance, which can be assessed per day or per instance of violation. Sep 30, 2023
$33K
Civil Money Penalty Info Fines imposed for noncompliance, which can be assessed per day or per instance of violation. Aug 14, 2023
$11K

Last updated: Jan 2026

Quality of care over time

These measures show how residents usually do over time at this home, based on health outcomes and preventive care.

High-risk clinical events score Info A composite score based on pressure ulcers, falls with injury, weight loss, walking ability decline, and activities of daily living decline. 3.5
49% better than New Jersey average

New Jersey average: 6.8

Functional decline score Info A composite score based on activities of daily living decline, walking ability decline, and incontinence. 10.3
17% better than New Jersey average

New Jersey average: 12.4

Long-stay resident measures
Significantly above average New Jersey avg: 4.5 Info CMS star rating based on long-stay quality measure performance. 5 stars = significantly above average, 1 star = significantly below average.
Need for Help with Daily Activities Increased Info Percent of long-stay residents whose need for help with daily activities has increased 2.2%
78% better than New Jersey average

New Jersey average: 10.1%

Walking Ability Worsened Info Percent of long-stay residents whose ability to move independently worsened 5.8%
47% better than New Jersey average

New Jersey average: 11.0%

Low Risk Residents with Bowel/Bladder Incontinence Info Percent of low risk long-stay residents who lose control of their bowels or bladder 23.0%
44% worse than New Jersey average

New Jersey average: 16.0%

Falls with Major Injury Info Percent of long-stay residents experiencing one or more falls with major injury 1.7%
28% better than New Jersey average

New Jersey average: 2.4%

High Risk Residents with Pressure Ulcers Info Percent of long-stay high risk residents with pressure ulcers 5.7%
7% better than New Jersey average

New Jersey average: 6.1%

Urinary Tract Infection Info Percent of long-stay residents with a urinary tract infection 0.0%
100% better than New Jersey average

New Jersey average: 1.0%

Lost Too Much Weight Info Percent of long-stay residents who lose too much weight 1.9%
59% better than New Jersey average

New Jersey average: 4.6%

Depressive Symptoms Info Percent of long-stay residents who have depressive symptoms 29.0%
156% worse than New Jersey average

New Jersey average: 11.3%

Antipsychotic Use Info Percent of long-stay residents who received an antipsychotic medication 6.7%
39% better than New Jersey average

New Jersey average: 11.1%

Pneumococcal Vaccine Info Percent of long-stay residents assessed and appropriately given the pneumococcal vaccine 73.2%
21% worse than New Jersey average

New Jersey average: 93.0%

Influenza Vaccine Info Percent of long-stay residents assessed and appropriately given the seasonal influenza vaccine 98.7%
In line with New Jersey average

New Jersey average: 97.2%

Hospitalizations per 1,000 days Info Number of hospitalizations per 1,000 long-stay resident days. 1.27
39% better than New Jersey average

New Jersey average: 2.08

ED visits per 1,000 days Info Number of outpatient emergency department visits per 1,000 long-stay resident days. 1.30
16% worse than New Jersey average

New Jersey average: 1.12

Short-stay resident measures
Average New Jersey avg: 3.8 Info CMS star rating based on short-stay quality measure performance. 5 stars = much above average, 1 star = much below average.
Pneumococcal Vaccine Info Percent of short-stay residents assessed and appropriately given the pneumococcal vaccine 55.8%
29% worse than New Jersey average

New Jersey average: 78.9%

Antipsychotic medication increase Info Percent of short-stay residents who newly received an antipsychotic medication 1.4%
24% worse than New Jersey average

New Jersey average: 1.2%

Influenza Vaccine Info Percent of short-stay residents assessed and appropriately given the seasonal influenza vaccine 75.1%
6% worse than New Jersey average

New Jersey average: 80.1%

Re-hospitalized after SNF stay Info Percentage of short-stay residents who were re-hospitalized after their nursing home admission. 26.6%
5% worse than New Jersey average

New Jersey average: 25.4%

Emergency department visits Info Percentage of short-stay residents who had an outpatient emergency department visit. 13.3%
62% worse than New Jersey average

New Jersey average: 8.2%

Falls with major injury Info Percentage of SNF residents who experience falls with major injury during their stay. 0.0%
100% better than New Jersey average

New Jersey average: 0.8%

Ability to care for self at discharge Info Percentage of residents at or above expected ability to care for themselves at discharge. 61.9%
15% better than New Jersey average

New Jersey average: 53.7%

Successful return to home or community Info Rate of successful return to home or community from a skilled nursing facility. 60.0%
19% better than New Jersey average

New Jersey average: 50.6%

Breakdown by payment type

Medicare

35% of new residents, usually for short-term rehab.

Typical stay 27 days

Private pay

52% of new residents, often for short stays.

Typical stay 19 days

Medicaid

13% of new residents, often for long-term daily care.

Typical stay 5 - 6 months

Facility Characteristics

Source: CMS Long-Term Care Facility Characteristics (Data as of Jan 2026)

Total residents 102
Medicare
42
41.2% of residents
Medicaid
54
52.9% of residents
Private pay or other
6
5.9% of residents

Finances and operations

Voluntary non-profit community
Home revenue
$18.5M
Surplus of revenue
$586.6K
Voluntary non-profit community
Home revenue
$18.5M Rank #148 / 272Revenue — State benchmarkedThis home is ranked 148th out of 272 homes in New Jersey. Shows this facility's annual revenue compared to the New Jersey SNF average. Higher revenue generally means more resources for staffing and capital — read alongside Payroll %.Click the rank badge to see the full State ranking.Click here to see the full State ranking.
Surplus of revenue
$586.6K
Payroll costs Info The portion of the home's budget spent on staff, including nurses, caregivers, and other employees who support care and operations. Rank #148 / 272Payroll — State benchmarkedThis home is ranked 148th out of 272 homes in New Jersey. Shows total annual staff payroll benchmarked to the New Jersey average. Higher payroll investment relative to peers often signals better staffing and less reliance on cheaper contract labor.Click the rank badge to see the full State ranking.Click here to see the full State ranking.
$9.0M
48.8% of revenue Rank #166 / 272Payroll % — State benchmarkedThis home is ranked 166th out of 272 homes in New Jersey. Shows payroll as a percentage of revenue versus the New Jersey average. Well-run New Jersey SNFs typically land around 55–65% — the top third Statewide. Below 25% may signal understaffing or heavy agency use — read with Staffing ratings.Click the rank badge to see the full State ranking.Click here to see the full State ranking.
Other operating costs Info All remaining costs needed to run the home, such as food, utilities, building maintenance, supplies and administrative expenses.
$8.9M
Total costs $17.9M

What does this home offer?

Pets allowed icon
Pets allowed icon

Pets Allowed

Housing options icon

Housing Options: Private / Semi-Private Rooms

Building type icon
Building type icon

Building Type: Single-story

Transportation services icon

Transportation Services

Fitness and recreation icon

Fitness and Recreation

Dining services icon

Three Meals Per Day

Who this home usually serves

TYPE OF STAY

Mix of rehab and long-term care

This home supports both short-term rehab and long-term care, with residents staying for a wide range of durations.

Places of interest near Atlas Healthcare Washington Township

Address 7.2 miles from city center Info Estimated distance in miles from Sewell's city center to Atlas Healthcare Washington Township's address, calculated via Google Maps.

Calculate Travel Distance to Atlas Healthcare Washington Township

Add your location

Address

Financial Assistance for
Nursing Home in New Jersey

Atlas Healthcare Washington Township is located in Sewell, New Jersey.
Here are the financial assistance programs available to residents in New Jersey.

Get Financial aid guidance

Managed Long Term Services and Supports

NJ Medicaid MLTSS

Age 65+ or disabled
General New Jersey resident, Medicaid- eligible, nursing home-level care need.
Income Limits (2025) ~$2,829/month 300% FBR, individual
Asset Limits $2,000 (individual), $3,000 (couple).
NJ

High urban demand; managed care model.

Benefits
In-home care (5-7 hours/day) Assisted living Respite (240 hours/year) Medical services

JACC (Jersey Assistance for Community Caregiving)

NJ JACC

Age 60+
General New Jersey resident, at risk of nursing home.
Income Limits ~$2,500/month individual, varies
Asset Limits $40,000 individual
NJ

Higher asset limit; limited funding.

Benefits
In-home care (3-5 hours/week) Respite (up to 10 days/year) Home modifications (~$1,000 avg.)

Pharmaceutical Assistance to the Aged and Disabled (PAAD)

New Jersey PAAD

Age 65+
General NJ resident, enrolled in Medicare Part D or eligible.
Income Limits (2025) ~$42,142/year (individual), ~$49,209/year (couple).
Asset Limits Not assessed.
NJ

Copays $5 (generic), $7 (brand); covers Part D premiums up to benchmark.

Benefits
Prescription cost reduction ($500-$1,000/year savings) Premium assistance ($20/month above benchmark)

Senior Gold Prescription Discount Program

New Jersey Senior Gold

Age 65+
General NJ resident, enrolled in Medicare Part D or eligible.
Income Limits (2025) ~$42,142-$52,142/year (individual), ~$49,209-$59,209/year (couple).
Asset Limits Not assessed.
NJ

Copays $15 + 50% of remaining cost; no premium assistance.

Benefits
Prescription cost reduction (~$300-$800/year savings)

Medicare Savings Program (MSP)

New Jersey Medicare Savings Program

Age 65+ or disabled
General NJ resident, Medicare Part A/B.
Income Limits (2025) ~$2,510/month (QMB), ~$3,380/month (SLMB), ~$3,598/month (QI)—individual.
Asset Limits $9,430 (individual), $14,130 (couple).
NJ

Three tiers; no waitlist; includes Extra Help for Part D.

Benefits
Covers Part B premiums ($174.70/month) Deductibles ($240/year) Copays (~20%)

Senior Freeze (Property Tax Reimbursement)

New Jersey Senior Freeze

Age 65+ by Dec 31 prior year
General NJ resident, homeowner, paid property taxes.
Income Limits (2025) ~$150,000/year combined household, projected
Asset Limits Not assessed; home ownership required.
NJ

Combines with ANCHOR/Stay NJ via PAS-1; annual application.

Benefits
Tax reimbursement (~$500-$2,000/year) for increases since base year

ANCHOR (Affordable NJ Communities for Homeowners and Renters)

New Jersey ANCHOR

Age 65+ prioritized
General NJ resident, homeowner/renter, paid property taxes/rent.
Income Limits (2025) ~$150,000/year (homeowners), ~$75,000/year (renters).
Asset Limits Not assessed.
NJ

Combines with Senior Freeze/Stay NJ; broader than prior Homestead program.

Benefits
Tax relief (~$700-$1,500/year homeowners, ~$250-$450 renters)

Stay NJ

New Jersey Stay NJ

Age 65+ by Dec 31 prior year
General NJ resident, homeowner, lived in home 10+ years.
Income Limits (2025) ~$500,000/year projected, subject to final regs
Asset Limits Not assessed; home ownership required.
NJ

Up to 50% tax credit (max $6,500); phased implementation.

Benefits
Tax credit (~$3,000-$6,500/year, projected) starting 2026

Universal Service Fund (USF)

New Jersey Universal Service Fund

Age 65+ prioritized
General NJ resident, utility customer, low-income.
Income Limits (2025) ~$3,970/month individual, 185% FPL
Asset Limits Not assessed; income-focused.
NJ

Must owe >$25 on bill; combines with LIHEAP if eligible.

Benefits
Bill credits (~$300-$1,500/year) to cap energy costs at 6% of income

NJ Family Caregiver Support Program (via NFCSP)

New Jersey Family Caregiver Support Program

Age
General Caregivers of 60+ needing care or 55+ caregivers of others; NJ resident; functional needs (2+ ADLs).
Income Limits (2025) Prioritizes ~$24,980/year (individual); no strict cap.
Asset Limits Not assessed; need-based.
NJ

21 AAAs; rural/low-income priority.

Benefits
Respite (4-6 hours/week or 5 days/year) Adult day care ($60/day) Training Supplies (~$500/year)

VA Aid and Attendance (A&A) and Housebound Benefits

New Jersey VA Aid and Attendance/Housebound

Age 65+ or disabled veteran/spouse
General NJ resident, wartime service, need for ADL help (A&A) or homebound.
Income Limits (2025) Net income < ~$1,984/month (veteran with dependent, A&A); pension offsets income.
Asset Limits ~$155,356 net worth limit
NJ

High veteran demand in urban/rural areas.

Benefits
Cash (~$1,433-$2,642/month veteran, ~$951-$1,318 spouse) for care costs (e.g., in-home, assisted living)

Compare Nursing Home around Linden

The information below is reported by the Michigan Department of Licensing and Regulatory Affairs (LARA).

2 facilities compared · CMS & MI Dept. of Health data

Filter by care type
Atlas Healthcare Washington Township
NH

Nursing Home Licensed facility providing 24/7 skilled nursing care for residents with complex, ongoing medical needs. Staffed by RNs, LPNs, and CNAs. Inspected and star-rated annually by CMS. Accepts Medicare (short-term rehab) and Medicaid (long-term care).

AL

Assisted Living A licensed, long-term care setting for seniors or individuals with disabilities who need help with daily activities — like bathing, dressing, and medication management — but not 24-hour skilled nursing. Offers housing, meals, and around-the-clock support while aiming to maximize resident independence.

IL

Independent Living Lifestyle-focused communities for older adults offering dining, activities, and transportation with minimal personal care. Best for active, independent seniors who want community without medical support.

MC

Memory Care Secured, specialized care for people living with Alzheimer's or dementia. Staff trained in cognitive impairment, with higher staff-to-resident ratios and an environment designed to reduce confusion and wandering risk.

Sewell120 90.6% +18%3.13 +3%-19%$96.5k317.82111 26 -$18.5M$9.0M48.8%315506
Symphony Linden
NH

Nursing Home Licensed facility providing 24/7 skilled nursing care for residents with complex, ongoing medical needs. Staffed by RNs, LPNs, and CNAs. Inspected and star-rated annually by CMS. Accepts Medicare (short-term rehab) and Medicaid (long-term care).

AL

Assisted Living A licensed, long-term care setting for seniors or individuals with disabilities who need help with daily activities — like bathing, dressing, and medication management — but not 24-hour skilled nursing. Offers housing, meals, and around-the-clock support while aiming to maximize resident independence.

IL

Independent Living Lifestyle-focused communities for older adults offering dining, activities, and transportation with minimal personal care. Best for active, independent seniors who want community without medical support.

MC

Memory Care Secured, specialized care for people living with Alzheimer's or dementia. Staff trained in cognitive impairment, with higher staff-to-resident ratios and an environment designed to reduce confusion and wandering risk.

Linden20 63.1% -17%3.63 -28%-16%$9.8k6811.3157 52 Ronda Pype$13.0M$6.4M49.2%235646

Frequently Asked Questions about Atlas Healthcare Washington Township

What neighborhood is Atlas Healthcare Washington Township in?

Atlas Healthcare Washington Township is in the Sewell neighborhood.

Is Atlas Healthcare Washington Township in a walkable area?

Atlas Healthcare Washington Township has a walk score of 26. Somewhat walkable. A few nearby services may be reachable on foot, but most trips require transportation.

Who is the administrator of Atlas Healthcare Washington Township?

field_administrator is the administrator of Atlas Healthcare Washington Township.

What is the address of Atlas Healthcare Washington Township?

Atlas Healthcare Washington Township is located at 378 Fries Mill Rd, Sewell, NJ 08080, United States.

What is the phone number of Atlas Healthcare Washington Township?

(856) 218-4200 will put you in contact with the team at Atlas Healthcare Washington Township.

Is Atlas Healthcare Washington Township Medicare or Medicaid certified?

Yes — Atlas Healthcare Washington Township is a CMS-certified provider of Medicare and Medicaid.

Guides for Better Senior Living

Care Cost Calculator: See Prices in Your Area

Nursing Home Data Explorer

Don’t Wait Too Long: 7 Red Flag Signs Your Parent Needs Assisted Living Now

The True Cost of Assisted Living in 2025 – And How Families Are Paying For It

Understanding Senior Living Costs: Pricing Models, Discounts & Financial Assistance

Explore Open Rooms
1 Contact details
2 What type of senior care service are you looking for?
3 What budget do you have in mind for senior care?
4 How soon do you need to find care?
5 Additional details

Thank you for your interest!

Our team will be in touch shortly to help with next steps.