


Occupancy rate
100%
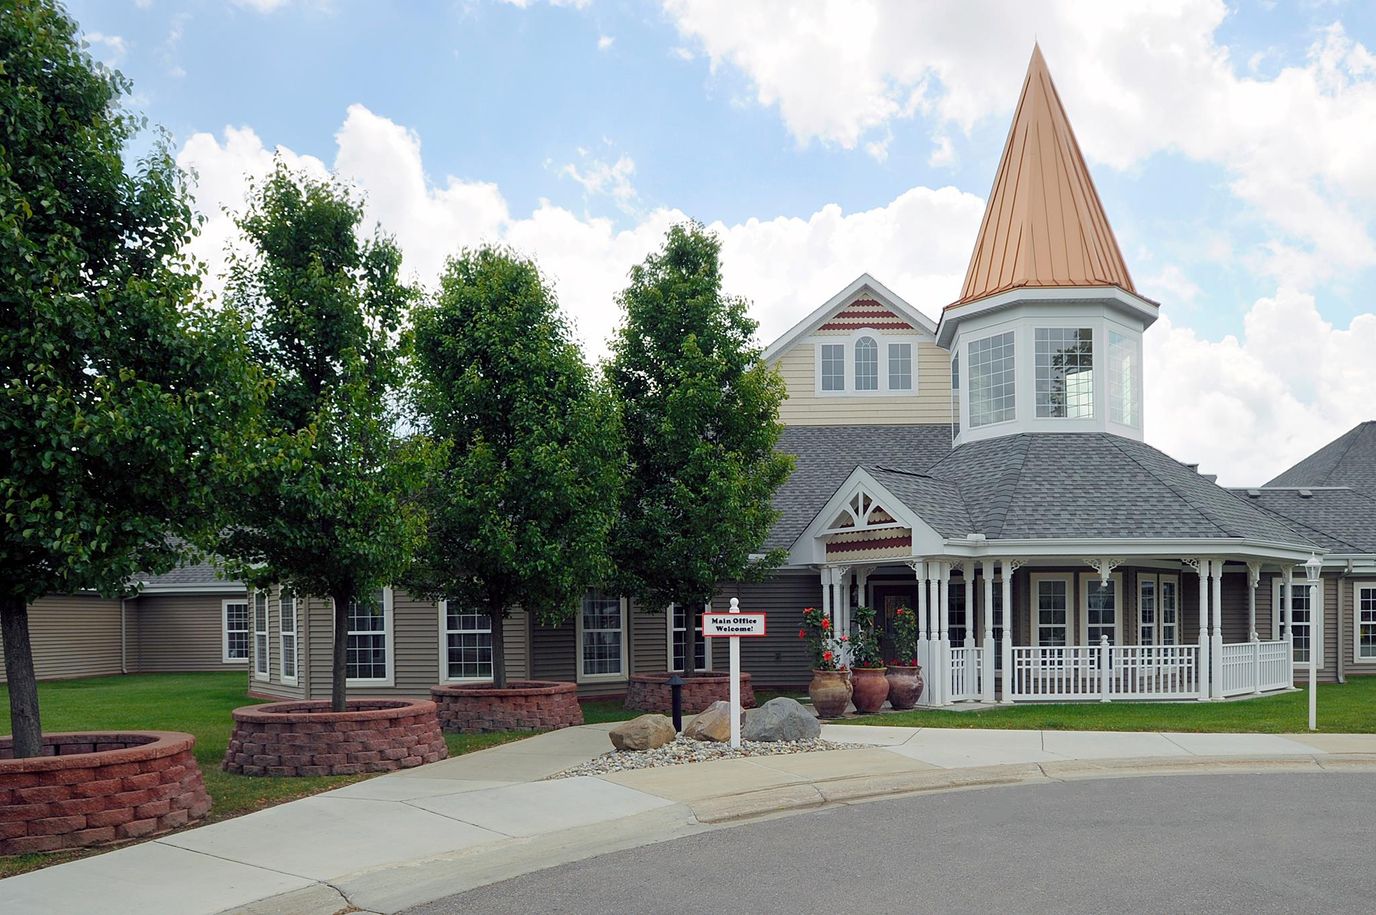
Symphony Linden in Linden, MI, is an outstanding senior living community, offering innovative assisted living and post-acute care services. Committed to delivering unparalleled care to residents in a homelike environment, the community features a highly dedicated team that works 24/7 to provide a harmonious approach to care to address every resident’s unique needs. Here, residents are provided with a carefully crafted personalized rehabilitation program to offer the most complete possible recovery.
Dedicated to helping its residents continue living life to the fullest extent possible while maintaining their independence and peace of mind, the community offers a variety of top-notch amenities and services, including family visits anytime, recreational activities, and delicious meals. Explore the community’s picturesque courtyards and meet new companions along the way. Symphony Linden strives to deliver the highest quality of service and care so residents could focus on making new memories.
| Staff type | Hours / Day / Resident | vs state avg |
|---|---|---|
|
Registered Nurse (RN)
| 52m per day | ▲ 12% State avg: 46m per day · National avg: 41m per day |
|
LPN / LVN
| 1h 3m per day | ▲ 19% State avg: 53m per day · National avg: 52m per day |
|
Nurse Aide
| 2h 15m per day | ▼ 6% State avg: 2h 23m per day · National avg: 2h 21m per day |
|
Weekend Total Nursing
| 3h 29m per day | ■ Avg State avg: 3h 31m per day · National avg: 3h 26m per day |
|
Physical Therapist
| 3m per day | ▼ 18% State avg: 4m per day · National avg: 4m per day |
|
Weekend RN
| 32m per day | ▲ 10% State avg: 29m per day · National avg: 29m per day |
Symphony Linden is legally operated by Symphony of Linden Health Care Center, LLC.
In Michigan, the Department of Licensing and Regulatory Affairs (LARA) conducts unannounced inspections and investigations to ensure long-term care facilities comply with state health codes.
Deficiencies
| This Facility | MI Average | vs. MI Avg |
|---|---|---|---|
|
Total deficiencies
| 72 | 8 | This facility has 800% more total deficiencies than a typical Michigan nursing home (72 vs. MI avg 8).↑ 800% worse |
|
Deficiencies per inspection
| 14.4 | 1.6 | This facility has 800% more deficiencies per inspection than a typical Michigan nursing home (14.4 vs. MI avg 1.6).↑ 800% worse |
Inspections
| This Facility | MI Average | vs. MI Avg |
|---|---|---|---|
|
Total inspections
| 5 | 5 | This facility has total inspections in line with the Michigan average (5 vs. MI avg 5).— At avg |
State average 6.5
Last Health inspection on Sep 2025
State average 33.5
State average 5.18
Health citations are formal notices following inspections when they fail to comply with safety and care standards.
35 of 68 citations resulted from standard inspections; 16 of 68 resulted from complaint investigations; and 17 of 68 came from combined inspections (standard and complaint).
State average: 0.3
State average: 1.9
Reporting period: October 1 – December 31, 2025 (Q4 2025). Source: CMS Payroll-Based Journal report.
Manages medical care and health needs.
Assists with medical care and medications.
Helps with daily care and mobility.
Total hours from contractors
2,353 contractor hours this quarter
| Certified Nursing Assistant | 44 | 0 | 44 | 11,961 | 92 | 100% | 8.8 |
| Licensed Practical Nurse | 19 | 0 | 19 | 5,070 | 92 | 100% | 9.2 |
| Registered Nurse | 8 | 0 | 8 | 2,838 | 92 | 100% | 9.4 |
| Other Dietary Services Staff | 7 | 0 | 7 | 1,744 | 92 | 100% | 7 |
| Clinical Nurse Specialist | 5 | 0 | 5 | 1,250 | 65 | 71% | 7.8 |
| Physical Therapy Assistant | 0 | 5 | 5 | 980 | 74 | 80% | 5.4 |
| Speech Language Pathologist | 0 | 4 | 4 | 505 | 65 | 71% | 4.1 |
| RN Director of Nursing | 1 | 0 | 1 | 504 | 63 | 68% | 8 |
| Nurse Practitioner | 1 | 0 | 1 | 496 | 62 | 67% | 8 |
| Dental Services Staff | 1 | 0 | 1 | 452 | 57 | 62% | 7.9 |
| Qualified Social Worker | 0 | 2 | 2 | 313 | 58 | 63% | 5.4 |
| Administrator | 2 | 0 | 2 | 304 | 38 | 41% | 8 |
| Respiratory Therapy Technician | 0 | 4 | 4 | 293 | 62 | 67% | 4.5 |
| Dietitian | 2 | 0 | 2 | 264 | 33 | 36% | 8 |
| Physical Therapy Aide | 0 | 1 | 1 | 104 | 27 | 29% | 3.8 |
| Occupational Therapy Aide | 0 | 2 | 2 | 98 | 14 | 15% | 6.5 |
| Occupational Therapy Assistant | 0 | 1 | 1 | 31 | 33 | 36% | 0.9 |
| Medical Director | 0 | 1 | 1 | 30 | 3 | 3% | 10 |
Federal penalties imposed by CMS for regulatory violations, including civil money penalties (fines) and denials of payment for new Medicare/Medicaid admissions.
Source: CMS Penalties Database (Data as of Jan 2026)
Michigan average: $76K
Michigan average: 2.0
Michigan average: 0.8
No penalties in the past 3 years
No civil money penalties or payment denials were reported in the last 3 years.
These measures show how residents usually do over time at this home, based on health outcomes and preventive care.
Michigan average: 8.4
Michigan average: 16.3
Michigan average: 12.5%
Michigan average: 15.3%
Michigan average: 21.0%
Michigan average: 3.2%
Michigan average: 5.7%
Michigan average: 1.7%
Michigan average: 5.7%
Michigan average: 3.9%
Michigan average: 15.0%
Michigan average: 94.9%
Michigan average: 95.0%
Michigan average: 82.5%
Michigan average: 1.4%
Michigan average: 79.5%
Michigan average: 24.2%
Michigan average: 11.5%
Michigan average: 0.8%
Michigan average: 53.7%
Michigan average: 50.6%
Quality measures are calculated from Minimum Data Set (MDS) assessments. For most measures, lower percentages indicate better care quality.
24% of new residents, usually for short-term rehab.
72% of new residents, often for short stays.
4% of new residents, often for long-term daily care.
Source: CMS Long-Term Care Facility Characteristics (Data as of Jan 2026)
Residents meet regularly to discuss policies, care quality, and activities
Part of a Continuing Care Retirement Community offering multiple care levels
Organized group of residents that meets regularly to discuss facility policies, quality of life, and activities.
Data sourced from CMS Long-Term Care Facility Characteristics quarterly report. Payer mix reflects the current resident census by primary payment source.
Historical financial and operational data for Symphony Linden from 2011–2023, based on CMS SNF Cost Reports.
Key figures below are for fiscal year ending in 12/2023.
Based on CMS SNF Cost Report for fiscal year ending in 12/2023.
No pets allowed
Housing Options: Studio / Private / Companion Suites
Building Type: Single-story
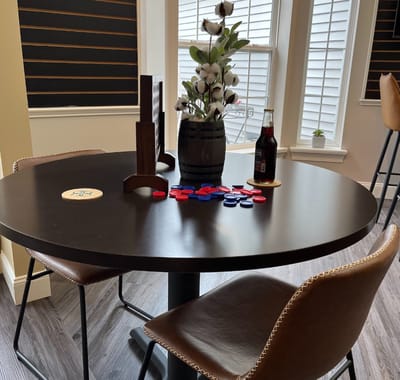
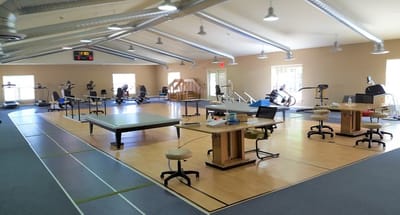
Fitness and Recreation
Three Meals Per Day

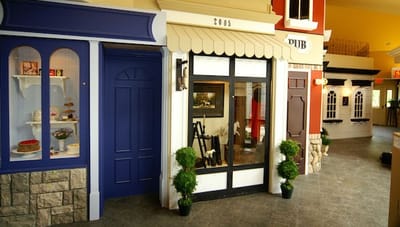
Movie Theater

Parking Available
Residents typically stay for brief periods, with frequent admissions and discharges throughout the year.
Most new residents arrive under private pay (72% of admissions), and a typical private pay stay runs around 3 months.
Coverage residents most often arrive under.
Coverage residents most often leave under.
![]() 0.5 miles from city center
0.5 miles from city center
![]() Estimated distance in miles from Linden's city center to Symphony Linden's address, calculated via Google Maps.
Estimated distance in miles from Linden's city center to Symphony Linden's address, calculated via Google Maps.
Add your location
Info below is compiled from CMS reports & the MI Licensing & Regulatory Affairs (LARA), senior community websites & trusted data sources such as Walk Score & BBB.
Communities are listed from highest to lowest based on our ranking methodology.
| Chelsea Retirement Community | NH AL IL MC SNF | Chelsea | 172
Facility
172
MI AVG
74
Rank
#18 / 430 |
48.3%
Facility
48.3%
MI AVG
74
Rank
#104 / 119 | -35% | 4.49 | -12% | +5% | $0 | 14 | 3.5 | - | 83 | - |
13
Facility
13
MI AVG
39
Rank
#582 / 703 | Umrcph, Inc | $36.6MFiscal year ending 06/2024 | $19.8MFiscal year ending 06/2024 | 54.3%Fiscal year ending 06/2024 | 235021 | ||||
| Lourdes Senior Community | NH AL HOS IL MC SNF | Waterford Twp (Watkins-Pontiac Estates) | 80
Facility
80
MI AVG
74
Rank
#176 / 430 |
88.0%
Facility
88.0%
MI AVG
74
Rank
#46 / 119 | +19% | 4.06 | +37% | -5% | $15.6k | 11 | 3.7 | 1 | 70 | - |
8
Facility
8
MI AVG
39
Rank
#621 / 703 | Richard Acho | $10.9MFiscal year ending 12/2023 | $5.6MFiscal year ending 12/2023 | 51.7%Fiscal year ending 12/2023 | 235252 | ||||
| Michigan Masonic Home | NH AL IL MC PC RC SNF | Alma | 124
Facility
124
MI AVG
74
Rank
#66 / 430 |
51.6%
Facility
51.6%
MI AVG
74
Rank
#99 / 119 | -30% | 3.86 | +123% | -10% | $0 | 9 | 3.0 | - | 64 | A+ |
67
Facility
67
MI AVG
39
Rank
#88 / 703 | Michigan Masonic Home | $21.6MFiscal year ending 03/2024 | $14.8MFiscal year ending 03/2024 | 68.4%Fiscal year ending 03/2024 | 235020 | ||||
| Bay Bluffs Emmet County Medical Care Facility | NH HOS MC SNF | Harbor Springs | 120
Facility
120
MI AVG
74
Rank
#71 / 430 |
59.5%
Facility
59.5%
MI AVG
74
Rank
#91 / 119 | -20% | 6.16 | +72% | +43% | $0 | 12 | 3.0 | - | 71 | - |
29
Facility
29
MI AVG
39
Rank
#438 / 703 | County Of Emmet | $9.2MFiscal year ending 12/2023 | $9.4MFiscal year ending 12/2023 | 102.2%Fiscal year ending 12/2023 | 235033 | ||||
| Symphony Linden | NH AL MC RC SNF | Linden | 20
Facility
20
MI AVG
74
Rank
#327 / 430 | - | - | 3.63 | -28% | -16% | $0 | 68 | 11.3 | 1 | 52 | - |
52
Facility
52
MI AVG
39
Rank
#201 / 703 | Ronda Pype | $10.0MFiscal year ending 12/2023 | $5.3MFiscal year ending 12/2023 | 52.9%Fiscal year ending 12/2023 | 235646 |
Symphony Linden is legally operated by Symphony of Linden Health Care Center, LLC.
Symphony Linden has a walk score of 52. Moderately walkable. Some errands can be accomplished on foot, with a mix of nearby amenities.
According to MI state health department records, Symphony Linden's license number is AL250281713.
According to MI state health department records, Symphony Linden's license expires on August 7, 2027.
Symphony Linden's occupancy is 100%.
No, Symphony Linden has a no-pet policy.
Symphony Linden is registered as a for-profit in MI.
Care Cost Calculator: See Prices in Your Area
Nursing Home Data Explorer
Don’t Wait Too Long: 7 Red Flag Signs Your Parent Needs Assisted Living Now
The True Cost of Assisted Living in 2025 – And How Families Are Paying For It
Understanding Senior Living Costs: Pricing Models, Discounts & Financial Assistance


