Aurora Valley Care
CMS overall rating Info CMS (the Centers for Medicare & Medicaid Services) is the federal agency that rates nursing home quality. Its Overall Rating runs from 1 to 5 stars, combining health inspections, staffing, and quality measures, with inspections weighted most heavily.

Aurora Valley Care

CMS overall rating Info CMS (the Centers for Medicare & Medicaid Services) is the federal agency that rates nursing home quality. Its Overall Rating runs from 1 to 5 stars, combining health inspections, staffing, and quality measures, with inspections weighted most heavily.
Calculator: See prices in your area
Aurora Valley Care accepts Medicare, Medicaid, and private pay.

Overview of Aurora Valley Care

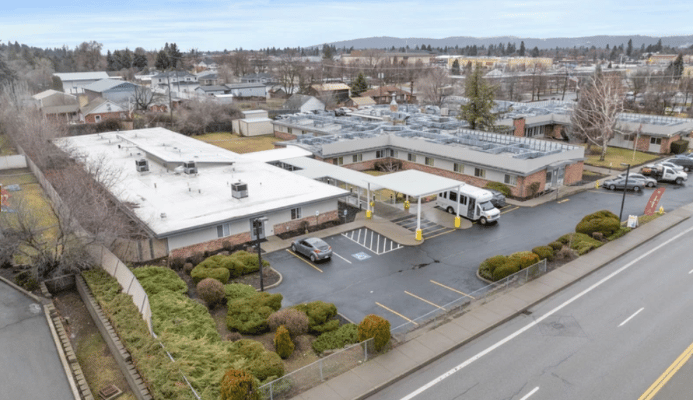
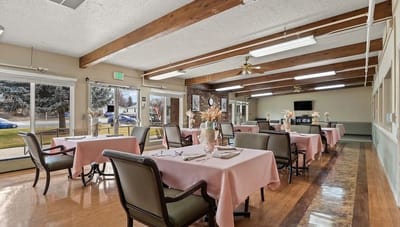
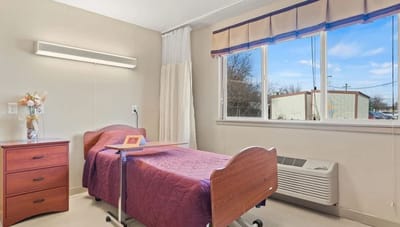
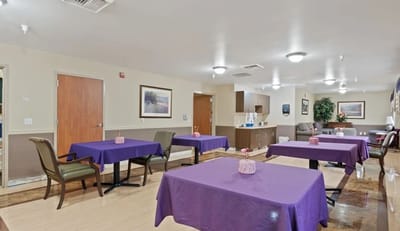
Serving the community of Spokane Valley, WA since 1966, Aurora Valley Care is a leading senior living community that offers rehabilitation and skilled nursing. The community provides a comfortable living space for both short-term rehabilitation and extended stays, all complemented with around-the-clock nursing assistance. Guaranteeing a lively and enjoyable lifestyle, the community also conducts a dynamic range of activities, spanning from games to festive gatherings and outings.

Focused in delivering optimal recovery, independence, and overall wellness, Aurora Valley Care offers comprehensive services, including physical therapy, speech therapy, nutritional support, occupational therapy, along with wellness-focused activities. A devoted team of professionals offers warmth, empathy, and an unyielding commitment to delivering personalized attention and care, fostering the overall well-being of residents within a nurturing environment.

Quality ratings

Measured by Centers for Medicare & Medicaid Services (CMS)

Overall rating Info The Overall CMS Rating combines results from health inspections, staffing levels and quality measures. Health inspections carry the most weight. Staffing and quality scores can increase or decrease the final rating based on performance compared to state and national standards.
▼ 38.0% Below WA avg. ▼ 38.0% Below WA avg.WA average: 3.2Click the badge to see the full State ranking.Click here to see the full State ranking.
Health Inspection Info Based on the results of the facility's three most recent standard inspections and any complaint investigations. CMS reviews the number, scope, and severity of deficiencies, with more recent findings weighted more heavily.
▼ 64.5% Below WA avg. ▼ 64.5% Below WA avg.WA average: 2.8Click the badge to see the full State ranking.Click here to see the full State ranking.
Staffing Info Measures average nursing staff hours per resident per day, including Registered Nurses (RNs) and total nursing staff. Ratings are adjusted based on the level of care residents require and are compared to state and national benchmarks.
▲ 16.8% Above WA avg. ▲ 16.8% Above WA avg.WA average: 3.4Click the badge to see the full State ranking.Click here to see the full State ranking.
Quality Measures Info Based on clinical and physical health indicators reported to CMS, such as hospital readmissions, falls, pressure ulcers, and improvements in mobility. These measures reflect how well residents' health needs are being managed.
▲ 27.2% Above WA avg. ▲ 27.2% Above WA avg.WA average: 3.9Click the badge to see the full State ranking.Click here to see the full State ranking.

Staffing hours breakdown

Info Daily nursing hours per resident by staff type, reported to CMS. Higher is generally better — compare this facility to state and national averages to see where staffing stands.

Hours per resident per day — compared to Washington state averages

Total nursing care / resident Info This home is ranked 77th out of 90 homes in Washington for nurse hours. Total adjusted nursing hours per resident per day, combining RN, LPN, and aide time. CMS adjusts this for case-mix so facilities can be fairly compared.
3h 32m per day
Rank #77 / 90Nurse hours — State benchmarkedThis home is ranked 77th out of 90 homes in Washington. Shows adjusted nurse hours per resident per day benchmarked to the Washington average, with a ranking across 90 Washington facilities. More hours mean more direct care. The national average is about 3.5 hrs; below 3.0 is a red flag.Ranking totals vary by category as each rank only includes facilities that report data for that metric. Homes missing that data point aren't included in the ranking.Click the rank badge to see the full State ranking.Click here to see the full State ranking.
This facility Washington avg (4h 13m per day)
vs Washington avg
-16%

5 of 6 metrics below state avg

Standout metric LPN / LVN is +19% above state avg
Staff typeHours / Day / Residentvs state avg
Registered Nurse (RN) Info RNs hold the highest nursing license and can assess residents, interpret test results, and direct care plans. More RN hours per day often signals stronger clinical oversight and faster response to health changes. 42m per day ▼ 21% State avg: 53m per day · National avg: 41m per day
LPN / LVN Info Licensed Practical Nurses (LPNs) or Licensed Vocational Nurses (LVNs) deliver routine hands-on care — medication administration, wound dressing, and monitoring vital signs. They work under RN supervision and make up a large share of daily bedside care. 58m per day ▲ 19% State avg: 49m per day · National avg: 52m per day
Nurse Aide Info Certified Nurse Aides (CNAs) provide the most direct day-to-day assistance: bathing, dressing, feeding, and mobility. Nurse aide hours are typically the largest staffing category and directly affect residents' quality of life. 2h 26m per day ▼ 9% State avg: 2h 41m per day · National avg: 2h 21m per day
Weekend Total Nursing Info Combined nursing hours (RN + LPN + Nurse Aide) per resident per day on weekends. Staffing often drops on weekends — this figure reveals whether the facility maintains adequate coverage outside of weekday hours. 3h 27m per day ▼ 9% State avg: 3h 47m per day · National avg: 3h 26m per day
Physical Therapist Info Hours per resident per day provided by licensed Physical Therapists (PTs) or PT Assistants. PT services help residents recover mobility after injury or illness and are especially important for post-acute (short-stay) rehabilitation. 4m per day ▼ 15% State avg: 5m per day · National avg: 4m per day
Weekend RN Info Registered nurse hours specifically on weekends. Facilities sometimes reduce RN presence on Saturdays and Sundays — a low weekend RN figure compared to weekday hours can indicate reduced clinical oversight when most administrative staff are absent. 21m per day ▼ 44% State avg: 38m per day · National avg: 29m per day

Capacity and availability

This home usually has availability

Lower occupancy than the Washington average: 72.5%
Occupancy rate
53.3% Rank #274 / 310Occupancy rate — State benchmarkedThis home is ranked 274th out of 310 homes in Washington. Shows this facility's occupancy rate versus the Washington average, with its Statewide rank out of 310. Higher occupancy signals strong local demand and financial stability.Ranking totals vary by category as each rank only includes facilities that report data for that metric. Homes missing that data point aren't included in the ranking.Click the rank badge to see the full State ranking.Click here to see the full State ranking.
Avg. Length of Stay
98 days
Bed community size
124-bed community Rank #40 / 366Bed count — State benchmarkedThis home is ranked 40th out of 366 homes in Washington. Shows this facility's certified or reported bed count compared to other Washington facilities. Larger communities may offer more amenities, programs, and on-site services for residents and families.Ranking totals vary by category as each rank only includes facilities that report data for that metric. Homes missing that data point aren't included in the ranking.Click the rank badge to see the full State ranking.Click here to see the full State ranking.
A larger shared setting that may offer more common spaces and organized community services.
Walk Score
Walk Score: 72 / 100 Rank #132 / 628Walk Score — State benchmarkedThis home is ranked 132nd out of 628 homes in Washington. Shows how walkable this facility's neighborhood is compared to the average Walk Score across Washington facilities. Higher scores benefit residents, families, and staff.Ranking totals vary by category as each rank only includes facilities that report data for that metric. Homes missing that data point aren't included in the ranking.Click the rank badge to see the full State ranking.Click here to see the full State ranking.
Very walkable. Most errands can be accomplished on foot, and many essentials are within a short walk.

About this community

Payment & Insurance

1 service
Accept Medicaid

Therapy & Rehabilitation

2 services
Rehabilitation Services
Short-Term Rehab

Staffing & Medical

2 services
Doctor on Staff
24-Hour Staffing

Amenities & Lifestyle

Specific ProgramsLong-Term Skilled Nursing, Therapy Services

Contact Aurora Valley Care

Staffing Data

Reporting period: October 1 – December 31, 2025 (Q4 2025). Source: CMS Payroll-Based Journal report.

Total staff 148
Employees 97
Contractors 51
Staff to resident ratio 1.97 : 1
6% more staff per resident than Washington average
Washington average ratio: 1.86 : 1 Washington average ratio: 1.86 : 1See full Washington ranking
Avg staff/day 44
Average shift 8.3 hours
0% compared with Washington average
Washington average: 8.1 hours Washington average shift: 8.1 hoursSee full Washington ranking
Total staff hours (quarter) 33,594

Nursing staff breakdown

Q4 2025 · Oct 1 – Dec 31 More info This data comes from the CMS Payroll-Based Journal report covering October 1 – December 31, 2025.
Registered Nurse

Manages medical care and health needs.

RN Staff Info All 10 RN Staff are full-time employees. No contractors work on this role. 10
Average shift length Info Average shift length. Calculated as total hours divided by days worked and average staff per day. 8.7 hours
Licensed Practical Nurse

Assists with medical care and medications.

LPN Staff Info 23 total: 11 full-time employees and 12 contractors. 23
Average shift length Info Average shift length. Calculated as total hours divided by days worked and average staff per day. 8.3 hours
Certified Nursing Assistant

Helps with daily care and mobility.

CNA Staff Info 83 total: 47 full-time employees and 36 contractors. 83
Average shift length Info Average shift length. Calculated as total hours divided by days worked and average staff per day. 8.6 hours

Contractor staffing

Q4 2025 · Oct 1 – Dec 31 More info This data comes from the CMS Payroll-Based Journal report covering October 1 – December 31, 2025.

Total hours from contractors

7.4%

2,486 contractor hours this quarter

Certified Nursing Assistant: 36 Licensed Practical Nurse: 12 Occupational Therapy Assistant: 2 Medical Director: 1

Staff by category

Q4 2025 · Oct 1 – Dec 31 More info This data comes from the CMS Payroll-Based Journal report covering October 1 – December 31, 2025.
Certified Nursing Assistant47368315,51892100%8.6
Licensed Practical Nurse1112235,23992100%8.3
Registered Nurse100103,79192100%8.7
RN Director of Nursing4041,6487986%8.2
Nurse Aide in Training3031,0067683%9
Physical Therapy Assistant4047496975%6.4
Medication Aide/Technician1017008188%8.6
Other Dietary Services Staff2026247278%6.4
Clinical Nurse Specialist3035966470%7.3
Administrator1015286672%8
Nurse Practitioner1015286672%8
Respiratory Therapy Technician2025025964%8.5
Mental Health Service Worker1014836470%7.5
Qualified Social Worker1014776874%7
Dietitian1014655964%7.9
Speech Language Pathologist2024446065%7.1
Occupational Therapy Aide2022315560%4.2
Occupational Therapy Assistant0224089%4.4
Medical Director011241314%1.8
Physical Therapy Aide101411%4.3
83 Certified Nursing Assistant
% of Days 100%
23 Licensed Practical Nurse
% of Days 100%
10 Registered Nurse
% of Days 100%
4 RN Director of Nursing
% of Days 86%
3 Nurse Aide in Training
% of Days 83%
4 Physical Therapy Assistant
% of Days 75%
1 Medication Aide/Technician
% of Days 88%
2 Other Dietary Services Staff
% of Days 78%
3 Clinical Nurse Specialist
% of Days 70%
1 Administrator
% of Days 72%
1 Nurse Practitioner
% of Days 72%
2 Respiratory Therapy Technician
% of Days 64%
1 Mental Health Service Worker
% of Days 70%
1 Qualified Social Worker
% of Days 74%
1 Dietitian
% of Days 64%
2 Speech Language Pathologist
% of Days 65%
2 Occupational Therapy Aide
% of Days 60%
2 Occupational Therapy Assistant
% of Days 9%
1 Medical Director
% of Days 14%
1 Physical Therapy Aide
% of Days 1%

Penalties and fines

Includes penalties issued in 2024

Federal penalties imposed by CMS for regulatory violations, including civil money penalties (fines) and denials of payment for new Medicare/Medicaid admissions.

Source: CMS Penalties Database (Data as of Jan 2026)

Total fines amount $162K Rank #69 / 92Federal fines — State benchmarkedThis home is ranked 69th out of 92 homes in Washington. Shows this facility's cumulative CMS federal fine dollars versus the Washington average among facilities with fines, and where it ranks among 92 facilities in the pool. Lower total dollars mean a better rank.Ranking totals vary by category as each rank only includes facilities that report data for that metric. Homes missing that data point aren't included in the ranking.Click the rank badge to see the full State ranking.Click here to see the full State ranking.
99% higher than Washington average

Washington average: $82K

Number of fines 3
62% more fines than Washington average

Washington average: 1.8

Payment Denials Info Serious action where Medicare and/or Medicaid temporarily stops payments for new residents until issues are fixed. 1
261% more payment denials than Washington average

Washington average: 0.3

Fines amount comparison
This facility $162K
Washington average $82K
Penalty History

Penalties are imposed by CMS for violations of federal nursing home regulations.

1 penalty in the past 3 years

May 9, 2024 · $93K

Civil Money Penalty Info Fines imposed for noncompliance, which can be assessed per day or per instance of violation. May 9, 2024
$93K

Last updated: Jan 2026

Quality of care over time

These measures show how residents usually do over time at this home, based on health outcomes and preventive care.

High-risk clinical events score Info A composite score based on pressure ulcers, falls with injury, weight loss, walking ability decline, and activities of daily living decline. 9.3
7% better than Washington average

Washington average: 10.0

Functional decline score Info A composite score based on activities of daily living decline, walking ability decline, and incontinence. 19.1
8% better than Washington average

Washington average: 20.9

Long-stay resident measures
Above average Washington avg: 3.6 Info CMS star rating based on long-stay quality measure performance. 5 stars = significantly above average, 1 star = significantly below average.
Need for Help with Daily Activities Increased Info Percent of long-stay residents whose need for help with daily activities has increased 12.2%
26% better than Washington average

Washington average: 16.4%

Walking Ability Worsened Info Percent of long-stay residents whose ability to move independently worsened 20.1%
8% better than Washington average

Washington average: 21.8%

Low Risk Residents with Bowel/Bladder Incontinence Info Percent of low risk long-stay residents who lose control of their bowels or bladder 25.1%
In line with Washington average

Washington average: 24.3%

Falls with Major Injury Info Percent of long-stay residents experiencing one or more falls with major injury 2.1%
21% better than Washington average

Washington average: 2.6%

High Risk Residents with Pressure Ulcers Info Percent of long-stay high risk residents with pressure ulcers 7.3%
47% worse than Washington average

Washington average: 4.9%

Urinary Tract Infection Info Percent of long-stay residents with a urinary tract infection 4.2%
138% worse than Washington average

Washington average: 1.7%

Lost Too Much Weight Info Percent of long-stay residents who lose too much weight 5.1%
13% better than Washington average

Washington average: 5.8%

Depressive Symptoms Info Percent of long-stay residents who have depressive symptoms 13.3%
18% better than Washington average

Washington average: 16.2%

Antipsychotic Use Info Percent of long-stay residents who received an antipsychotic medication 21.1%
46% worse than Washington average

Washington average: 14.5%

Pneumococcal Vaccine Info Percent of long-stay residents assessed and appropriately given the pneumococcal vaccine 98.8%
In line with Washington average

Washington average: 96.2%

Influenza Vaccine Info Percent of long-stay residents assessed and appropriately given the seasonal influenza vaccine 100.0%
7% better than Washington average

Washington average: 93.8%

Short-stay resident measures
Above average Washington avg: 3.6 Info CMS star rating based on short-stay quality measure performance. 5 stars = much above average, 1 star = much below average.
Pneumococcal Vaccine Info Percent of short-stay residents assessed and appropriately given the pneumococcal vaccine 78.9%
10% worse than Washington average

Washington average: 88.1%

Antipsychotic medication increase Info Percent of short-stay residents who newly received an antipsychotic medication 0.0%
100% better than Washington average

Washington average: 1.4%

Influenza Vaccine Info Percent of short-stay residents assessed and appropriately given the seasonal influenza vaccine 79.0%
In line with Washington average

Washington average: 82.0%

Re-hospitalized after SNF stay Info Percentage of short-stay residents who were re-hospitalized after their nursing home admission. 21.7%
9% worse than Washington average

Washington average: 19.9%

Emergency department visits Info Percentage of short-stay residents who had an outpatient emergency department visit. 10.9%
17% better than Washington average

Washington average: 13.2%

Falls with major injury Info Percentage of SNF residents who experience falls with major injury during their stay. 0.0%
100% better than Washington average

Washington average: 0.8%

Ability to care for self at discharge Info Percentage of residents at or above expected ability to care for themselves at discharge. 62.5%
16% better than Washington average

Washington average: 53.7%

Successful return to home or community Info Rate of successful return to home or community from a skilled nursing facility. 49.4%
In line with Washington average

Washington average: 50.6%

Breakdown by payment type

Medicare

23% of new residents, usually for short-term rehab.

Typical stay 1 - 2 months

Private pay

64% of new residents, often for short stays.

Typical stay 29 days

Medicaid

13% of new residents, often for long-term daily care.

Typical stay 1 - 2 years

Facility Characteristics

Source: CMS Long-Term Care Facility Characteristics (Data as of Jan 2026)

Total residents 75
Medicare
2
2.7% of residents
Medicaid
55
73.3% of residents
Private pay or other
18
24% of residents
Programs & Services
Residents Group

Residents meet regularly to discuss policies, care quality, and activities

Family Member Group

Family members meet regularly to discuss policies, care quality, and activities

Active Family Council

Organized group of family members that meets regularly to discuss facility policies, resident care, and activities.

Active Resident Council

Organized group of residents that meets regularly to discuss facility policies, quality of life, and activities.

Finances and operations

Based on CMS SNF Cost Report for fiscal year ending in 12/2023.

Privately-owned community
Operated by a single business entity.
Net patient revenue Info Net patient revenue — what the home actually collects for resident care, after contractual allowances, bad debt and discounts are subtracted from its gross charges (CMS cost report, Worksheet G-3). It covers resident care only; money the home earns from other sources is shown separately as "Other income."
$10.1M
Net patient income Info Net patient income: net patient revenue minus the home's total operating expenses. A positive figure means it earns more from resident care than it spends to deliver it; a negative figure means the opposite. It excludes non-operating "other income."
-$384.6K
Privately-owned community Operated by a single business entity.
Net patient revenue Info Net patient revenue — what the home actually collects for resident care, after contractual allowances, bad debt and discounts are subtracted from its gross charges (CMS cost report, Worksheet G-3). It covers resident care only; money the home earns from other sources is shown separately as "Other income."
$10.1M Rank #70 / 94Revenue — State benchmarkedThis home is ranked 70th out of 94 homes in Washington. Shows this facility's annual revenue compared to the Washington average. Higher revenue generally means more resources for staffing and capital — read alongside Payroll %.Ranking totals vary by category as each rank only includes facilities that report data for that metric. Homes missing that data point aren't included in the ranking.Click the rank badge to see the full State ranking.Click here to see the full State ranking.
Net patient income Info Net patient income: net patient revenue minus the home's total operating expenses. A positive figure means it earns more from resident care than it spends to deliver it; a negative figure means the opposite. It excludes non-operating "other income."
-$384.6K
Other income Info Money the home earns outside of resident care — such as investments, grants, rentals and other non-operating sources (CMS cost report, Worksheet G-3). It is tracked separately from net patient revenue: it is not part of that figure, and it is not included in net patient income.
$623.3K
Payroll costs Info Staff salaries plus wage-related costs — benefits such as payroll taxes, health insurance and retirement — from the home's own accounting records (CMS cost report, Worksheet A). Contract or agency labor is counted separately, under other operating costs. Rank #73 / 94Payroll — State benchmarkedThis home is ranked 73rd out of 94 homes in Washington. Shows total annual staff payroll benchmarked to the Washington average. Higher payroll investment relative to peers often signals better staffing and less reliance on cheaper contract labor.Ranking totals vary by category as each rank only includes facilities that report data for that metric. Homes missing that data point aren't included in the ranking.Click the rank badge to see the full State ranking.Click here to see the full State ranking.
$4.7M 46.8% of net patient revenue Info Payroll as a share of revenue: staff salaries and wage-related benefits divided by net patient revenue. A higher figure means more of each revenue dollar goes to staff pay. Rank #71 / 94Payroll % — State benchmarkedThis home is ranked 71st out of 94 homes in Washington. Shows payroll as a percentage of revenue versus the Washington average. Well-run Washington facilities typically land around 53–61% — the top third Statewide. Below 25% may signal understaffing or heavy agency use — read with Staffing ratings.Ranking totals vary by category as each rank only includes facilities that report data for that metric. Homes missing that data point aren't included in the ranking.Click the rank badge to see the full State ranking.Click here to see the full State ranking.
Other operating costs Info Everything it costs to run the home apart from payroll — food, utilities, supplies, maintenance, contract labor and administration. Calculated as total operating expense minus payroll (staff salaries and wage-related benefits).
$5.7M
Total costs Info The home's total operating expense for the year — all the costs of running it, salaries included (CMS cost report, Worksheet G-3).
$10.4M

What does this home offer?

Building type icon
Building type icon

Building Type: Single-story

Fitness and recreation icon

Fitness and Recreation

Who this home usually serves

TYPE OF STAY

Primarily short stays

Residents typically stay for brief periods, with frequent admissions and discharges throughout the year.

Most new residents arrive under private pay (64% of admissions), and a typical private pay stay runs around 29 days.

Admissions
253 total

Coverage residents most often arrive under.

Medicare 23%
Private pay 64%
Medicaid 13%
Discharges
245 total

Coverage residents most often leave under.

Medicare 18%
Private pay 41%
Medicaid 41%

Managed by Jacqueline Palozzolo

Executive Director

Aurora Valley Care Reviews

Suzan Troupe
This facility changed its name from Gardens on University last year.. no doubt to hide from all of the negative reviews .. if you want to see all about what this place is, look up their former name .. *note* the ONLY thing that has changed about this facility is the name .. please thoroughly research this place before you trust the lives of your loved ones in their care .. make sure to look up the news footage as well from 2020 or 2021What do you like most about living here? Answer: Nothing at all Are there enough caregivers to handle the residents' needs, especially during emergencies? Answer: No Are the common areas pleasant and comfortable for socializing or relaxing? Answer: No How would you rate the quality and variety of the meals? (1-5) Answer: 1 Are special diets handled well? Answer: No Is the dining schedule flexible enough to meet your preferences? Answer: No How do you feel about the level of social interaction available with other residents? Answer: There is rarely any social interaction How was the units offered in this community? Answer: Sent from hospital Do you feel safe living in this community? Answer: No How well do you think the community handles emergencies or unexpected events? Answer: They ignore emergencies to keep the numbers down and to bring as little attention to the facility as possible Are there any hidden fees or unexpected charges? Answer: I don't know.. but I do know that the social service administrator, aka Jackie, sabotages transfers until patients Medicare runs out Would you recommend this community to others looking for senior living options? Answer: Absolutely not Is there anything you wish you knew before moving in? Answer: I wish we'd looked up the reviews

Places of interest near Aurora Valley Care

Address 8.7 miles from city center Info Estimated distance in miles from Spokane Valley's city center to Aurora Valley Care's address, calculated via Google Maps. — 0.96 miles to nearest hospital (Innovative Medical Technologies Management LLC)

Calculate Travel Distance to Aurora Valley Care

Add your location

Address

Compare Nursing Home around Spokane

The information below is reported by the Washington Department of Social and Health Services, Residential Care Services.

4 facilities compared · CMS & WA Dept. of Health data

Regency at Northpointe
NH
RC
Spokane (Shiloh Hills)
120
Facility 120
WA AVG 82
Rank #46 / 366
74.0%
Facility 74.0%
WA AVG 72.5%
Rank #162 / 310
+2%
3.83
Facility 3.83
WA AVG 4.22
Rank #61 / 90
-41%-9%
$8.3k
Facility $8.3k
WA AVG $87.7k
Rank #35 / 92
15
Facility 15
WA AVG 48.9
Rank #4 / 92
3.8
Facility 3.8
WA AVG 6.9
Rank #10 / 92
190-
37
Facility 37
WA AVG 51
Rank #427 / 628
Tod Dunfield
$16.2M
Facility $16.2M
WA AVG $13.2M
Rank #28 / 94
$8.8M
Facility $8.8M
WA AVG $5.7M
Rank #24 / 94
54.4%
Facility 54.4%
WA AVG 45.5%
Rank #38 / 94
505369
Rockwood South Hill
NH
AL
IL
MC
Spokane (Downtown Spokane)
90
Facility 90
WA AVG 82
Rank #134 / 366
77.8%
Facility 77.8%
WA AVG 72.5%
Rank #133 / 310
+7%
5.77
Facility 5.77
WA AVG 4.22
Rank #4 / 90
+104%+37%
$0
Facility $0
WA AVG $87.7k
Rank #1 / 92
48
Facility 48
WA AVG 48.9
Rank #45 / 92
12.0
Facility 12.0
WA AVG 6.9
Rank #83 / 92
-35-
96
Facility 96
WA AVG 51
Rank #15 / 628
Chris Bafus
$24.8M
Facility $24.8M
WA AVG $13.2M
Rank #6 / 94
$15.9M
Facility $15.9M
WA AVG $5.7M
Rank #6 / 94
64.3%
Facility 64.3%
WA AVG 45.5%
Rank #67 / 94
505033
Aurora Valley Care
NH
Spokane Valley
124
Facility 124
WA AVG 82
Rank #40 / 366
53.3%
Facility 53.3%
WA AVG 72.5%
Rank #274 / 310
-27%
3.54
Facility 3.54
WA AVG 4.22
Rank #77 / 90
-53%-16%
$93.5k
Facility $93.5k
WA AVG $87.7k
Rank #69 / 92
106
Facility 106
WA AVG 48.9
Rank #88 / 92
5.6
Facility 5.6
WA AVG 6.9
Rank #34 / 92
577-
72
Facility 72
WA AVG 51
Rank #132 / 628
-
$10.1M
Facility $10.1M
WA AVG $13.2M
Rank #70 / 94
$4.7M
Facility $4.7M
WA AVG $5.7M
Rank #73 / 94
46.8%
Facility 46.8%
WA AVG 45.5%
Rank #71 / 94
505114
Spokane Falls Care
NH
Spokane (Nevada Heights)
100
Facility 100
WA AVG 82
Rank #93 / 366
70.5%
Facility 70.5%
WA AVG 72.5%
Rank #196 / 310
-3%
4.42
Facility 4.42
WA AVG 4.22
Rank #24 / 90
-27%+5%
$125.7k
Facility $125.7k
WA AVG $87.7k
Rank #74 / 92
106
Facility 106
WA AVG 48.9
Rank #88 / 92
6.2
Facility 6.2
WA AVG 6.9
Rank #43 / 92
678-
76
Facility 76
WA AVG 51
Rank #107 / 628
Navdeep Dhaliwal
$10.9M
Facility $10.9M
WA AVG $13.2M
Rank #63 / 94
$5.7M
Facility $5.7M
WA AVG $5.7M
Rank #63 / 94
51.8%
Facility 51.8%
WA AVG 45.5%
Rank #56 / 94
505024

Financial Assistance for
Nursing Home in Washington

Aurora Valley Care is located in Spokane Valley, Washington.
Here are the financial assistance programs available to residents in Washington.

Get Financial aid guidance

Community Options Program Entry System (COPES)

WA Medicaid COPES

Age 65+ or disabled
General Washington resident, Medicaid-eligible, nursing home-level care need.
Income Limits (2025) ~$2,829/month 300% FBR, individual
Asset Limits $2,000 (individual), $3,000 (couple).
WA

High demand in urban areas (e.g., Seattle).

Benefits
Personal care (5-7 hours/day) Respite (240 hours/year) Adult day care ($70/day) Home modifications ($1,500 avg.)

Washington Family Caregiver Support Program

WA NFCSP

Age Caregiver of someone 60+ (or with dementia)
General Washington resident.
Income Limits No strict limit; prioritizes low-income.
Asset Limits Not applicable.
WA

High urban demand; rural outreach.

Benefits
In-home respite (4-6 hours/day) Adult day care (~$70/day) Short-term facility care (up to 5 days)

Community First Choice (CFC)

Washington Community First Choice

Age 65+ (or disabled 18+)
General WA resident, Medicaid-eligible, need help with 2+ ADLs/IADLs.
Income Limits (2025) ~$2,829/month; QIT optional.
Asset Limits $2,000 (individual), $3,000 (couple).
WA

Broader than COPES; serves ~20,000; self-directed option.

Benefits
Personal care (4-6 hours/day) Respite (~240 hours/year) Assistive devices Training Transportation

Older Americans Act (OAA) Services

Washington OAA Services

Age 60+
General WA resident; no income/asset limits.
Income Limits (2025) None; donations encouraged.
Asset Limits Not assessed.
WA

13 AAAs; includes Meals on Wheels; rural focus.

Benefits
Meals (~$5-$7/meal) Transportation Homemaker services (~4 hours/week) Respite (~5 days/year) Legal aid

Medicare Savings Program (MSP)

Washington Medicare Savings Program

Age 65+ or disabled
General WA resident, Medicare Part A/B.
Income Limits (2025) ~$2,510/month (QMB), ~$3,380/month (SLMB), ~$3,598/month (QI)—individual.
Asset Limits $9,430 (individual), $14,130 (couple).
WA

Includes Extra Help for Part D; no waitlist.

Benefits
Covers Part B premiums ($174.70/month) Deductibles ($240/year) Copays (~20%)

VA Aid and Attendance (A&A) and Housebound Benefits

Washington VA Aid and Attendance/Housebound

Age 65+ or disabled veteran/spouse
General WA resident, wartime service, ADL help (A&A) or homebound.
Income Limits (2025) Net income < ~$1,984/month (veteran with dependent, A&A); pension offsets income.
Asset Limits ~$155,356 net worth
WA

High veteran use; supports rural/urban needs.

Benefits
Cash (~$1,433-$2,642/month veteran, ~$951-$1,318 spouse) for care costs

Senior Citizens Property Tax Exemption

Washington Senior Property Tax Exemption

Age 61+ or disabled retiree
General WA resident, homeowner, income-based.
Income Limits (2025) ~$45,000-$70,000/year varies by county, e.g., King: $70,000
Asset Limits Not assessed; home value cap varies ~$250,000-$400,000
WA

Saves ~$500-$1,500/year; offered statewide.

Benefits
Tax exemption (~$500-$1,500/year depending on county)

Senior Farmers’ Market Nutrition Program (SFMNP)

Washington SFMNP

Age 60+
General WA resident, low-income.
Income Limits (2025) ~$2,322/month 185% FPL
Asset Limits Not assessed.
WA

Vouchers (~$80/season); serves ~20,000 via AAAs.

Benefits
Vouchers (~$80/season) for produce at farmers’ markets

Frequently Asked Questions about Aurora Valley Care

What neighborhood is Aurora Valley Care in?

Aurora Valley Care is in the Spokane Valley neighborhood.

Is Aurora Valley Care in a walkable area?

Aurora Valley Care has a walk score of 72. Very walkable. Most errands can be accomplished on foot, and many essentials are within a short walk.

What is the occupancy rate at Aurora Valley Care?

Aurora Valley Care's occupancy is 53.3%.

Are there photos of Aurora Valley Care?

Yes — there are 4 photos of Aurora Valley Care in the photo gallery on this page.

What is the phone number of Aurora Valley Care?

(509) 924-4650 will put you in contact with the team at Aurora Valley Care.

Is Aurora Valley Care Medicare or Medicaid certified?

Yes — Aurora Valley Care is a CMS-certified provider of Medicare and Medicaid.

Guides for Better Senior Living

Care Cost Calculator: See Prices in Your Area

Nursing Home Data Explorer

Don’t Wait Too Long: 7 Red Flag Signs Your Parent Needs Assisted Living Now

The True Cost of Assisted Living in 2025 – And How Families Are Paying For It

Understanding Senior Living Costs: Pricing Models, Discounts & Financial Assistance