Spokane Falls Care
CMS overall rating Info CMS (the Centers for Medicare & Medicaid Services) is the federal agency that rates nursing home quality. Its Overall Rating runs from 1 to 5 stars, combining health inspections, staffing, and quality measures, with inspections weighted most heavily.

Spokane Falls Care

CMS overall rating Info CMS (the Centers for Medicare & Medicaid Services) is the federal agency that rates nursing home quality. Its Overall Rating runs from 1 to 5 stars, combining health inspections, staffing, and quality measures, with inspections weighted most heavily.
Calculator: See prices in your area
Spokane Falls Care accepts Medicare, Medicaid, and private pay.

Overview of Spokane Falls Care

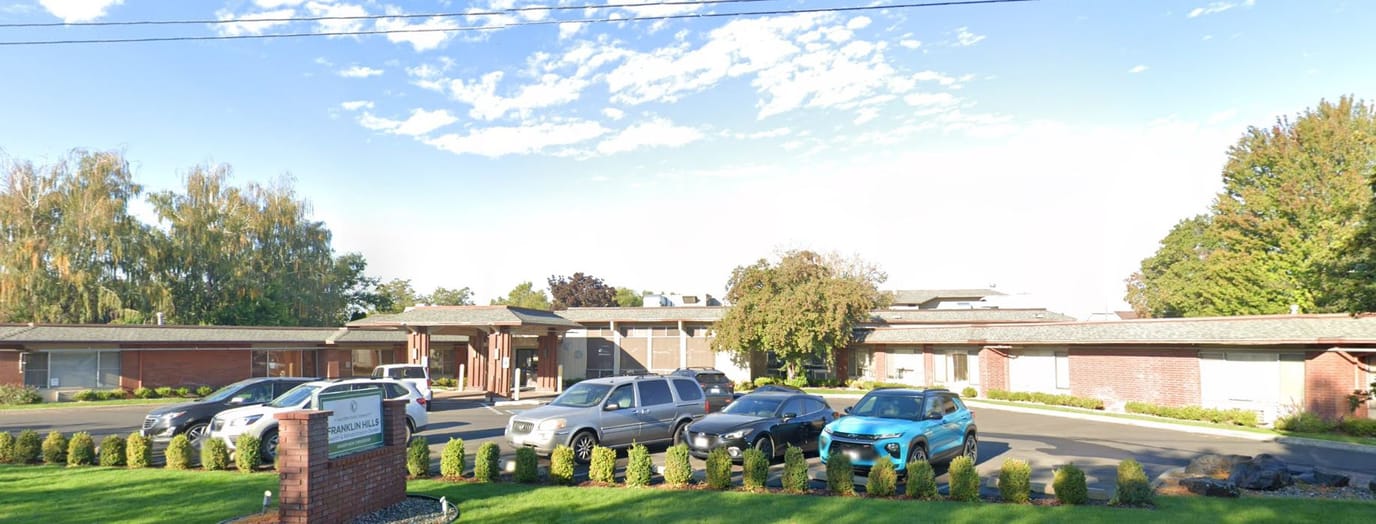
A premier senior living community based on North Lidgerwood Street, Spokane, WA, Spokane Falls Care offers short-term rehab, long-term skilled nursing, and therapy services. Providing care for 64 years, the community promises the highest standard of care and assistance. With a team of dedicated and friendly professionals, seniors and their families keep their peace of mind knowing they are well-respected.

Spokane Falls Center values seniors’ independence, lending support only when necessary and wanted. Moreover, personalized care plans are crafted to ensure seniors’ specific needs and preferences are taken care of. The community provides the help seniors need and empowers them to live their lives confidently and age gracefully with the utmost care and assistance from Spokane Falls Center.

Quality ratings

Measured by Centers for Medicare & Medicaid Services (CMS)

Overall rating Info The Overall CMS Rating combines results from health inspections, staffing levels and quality measures. Health inspections carry the most weight. Staffing and quality scores can increase or decrease the final rating based on performance compared to state and national standards.
▼ 69.0% Below WA avg. ▼ 69.0% Below WA avg.WA average: 3.2Click the badge to see the full State ranking.Click here to see the full State ranking.
Health Inspection Info Based on the results of the facility's three most recent standard inspections and any complaint investigations. CMS reviews the number, scope, and severity of deficiencies, with more recent findings weighted more heavily.
▼ 64.5% Below WA avg. ▼ 64.5% Below WA avg.WA average: 2.8Click the badge to see the full State ranking.Click here to see the full State ranking.
Staffing Info Measures average nursing staff hours per resident per day, including Registered Nurses (RNs) and total nursing staff. Ratings are adjusted based on the level of care residents require and are compared to state and national benchmarks.
▼ 41.6% Below WA avg. ▼ 41.6% Below WA avg.WA average: 3.4Click the badge to see the full State ranking.Click here to see the full State ranking.
Quality Measures Info Based on clinical and physical health indicators reported to CMS, such as hospital readmissions, falls, pressure ulcers, and improvements in mobility. These measures reflect how well residents' health needs are being managed.
▼ 23.7% Below WA avg. ▼ 23.7% Below WA avg.WA average: 3.9Click the badge to see the full State ranking.Click here to see the full State ranking.

Staffing hours breakdown

Info Daily nursing hours per resident by staff type, reported to CMS. Higher is generally better — compare this facility to state and national averages to see where staffing stands.

Hours per resident per day — compared to Washington state averages

Total nursing care / resident Info This home is ranked 24th out of 90 homes in Washington for nurse hours. Total adjusted nursing hours per resident per day, combining RN, LPN, and aide time. CMS adjusts this for case-mix so facilities can be fairly compared.
4h 25m per day
Rank #24 / 90Nurse hours — State benchmarkedThis home is ranked 24th out of 90 homes in Washington. Shows adjusted nurse hours per resident per day benchmarked to the Washington average, with a ranking across 90 Washington facilities. More hours mean more direct care. The national average is about 3.5 hrs; below 3.0 is a red flag.Ranking totals vary by category as each rank only includes facilities that report data for that metric. Homes missing that data point aren't included in the ranking.Click the rank badge to see the full State ranking.Click here to see the full State ranking.
This facility Washington avg (4h 13m per day)
vs Washington avg
+5%

5 of 6 metrics below state avg

Standout metric LPN / LVN is +15% above state avg
Staff typeHours / Day / Residentvs state avg
Registered Nurse (RN) Info RNs hold the highest nursing license and can assess residents, interpret test results, and direct care plans. More RN hours per day often signals stronger clinical oversight and faster response to health changes. 27m per day ▼ 49% State avg: 53m per day · National avg: 41m per day
LPN / LVN Info Licensed Practical Nurses (LPNs) or Licensed Vocational Nurses (LVNs) deliver routine hands-on care — medication administration, wound dressing, and monitoring vital signs. They work under RN supervision and make up a large share of daily bedside care. 57m per day ▲ 15% State avg: 49m per day · National avg: 52m per day
Nurse Aide Info Certified Nurse Aides (CNAs) provide the most direct day-to-day assistance: bathing, dressing, feeding, and mobility. Nurse aide hours are typically the largest staffing category and directly affect residents' quality of life. 2h 22m per day ▼ 12% State avg: 2h 41m per day · National avg: 2h 21m per day
Weekend Total Nursing Info Combined nursing hours (RN + LPN + Nurse Aide) per resident per day on weekends. Staffing often drops on weekends — this figure reveals whether the facility maintains adequate coverage outside of weekday hours. 3h 21m per day ▼ 11% State avg: 3h 47m per day · National avg: 3h 26m per day
Physical Therapist Info Hours per resident per day provided by licensed Physical Therapists (PTs) or PT Assistants. PT services help residents recover mobility after injury or illness and are especially important for post-acute (short-stay) rehabilitation. 4m per day ▼ 12% State avg: 5m per day · National avg: 4m per day
Weekend RN Info Registered nurse hours specifically on weekends. Facilities sometimes reduce RN presence on Saturdays and Sundays — a low weekend RN figure compared to weekday hours can indicate reduced clinical oversight when most administrative staff are absent. 11m per day ▼ 71% State avg: 38m per day · National avg: 29m per day

Capacity and availability

This home usually has availability

Lower occupancy than the Washington average: 72.5%
Occupancy rate
70.5% Rank #196 / 310Occupancy rate — State benchmarkedThis home is ranked 196th out of 310 homes in Washington. Shows this facility's occupancy rate versus the Washington average, with its Statewide rank out of 310. Higher occupancy signals strong local demand and financial stability.Ranking totals vary by category as each rank only includes facilities that report data for that metric. Homes missing that data point aren't included in the ranking.Click the rank badge to see the full State ranking.Click here to see the full State ranking.
Avg. Length of Stay
96 days
Bed community size
100-bed community Rank #93 / 366Bed count — State benchmarkedThis home is ranked 93rd out of 366 homes in Washington. Shows this facility's certified or reported bed count compared to other Washington facilities. Larger communities may offer more amenities, programs, and on-site services for residents and families.Ranking totals vary by category as each rank only includes facilities that report data for that metric. Homes missing that data point aren't included in the ranking.Click the rank badge to see the full State ranking.Click here to see the full State ranking.
A larger shared setting that may offer more common spaces and organized community services.
Walk Score
Walk Score: 76 / 100 Rank #107 / 628Walk Score — State benchmarkedThis home is ranked 107th out of 628 homes in Washington. Shows how walkable this facility's neighborhood is compared to the average Walk Score across Washington facilities. Higher scores benefit residents, families, and staff.Ranking totals vary by category as each rank only includes facilities that report data for that metric. Homes missing that data point aren't included in the ranking.Click the rank badge to see the full State ranking.Click here to see the full State ranking.
Very walkable. Most errands can be accomplished on foot, and many essentials are within a short walk.

About this community

Payment & Insurance

1 service
Accept Medicaid

Therapy & Rehabilitation

2 services
Rehabilitation Services
Short-Term Rehab

Staffing & Medical

2 services
Doctor on Staff
24-Hour Staffing

Amenities & Lifestyle

Specific ProgramsLong-Term Skilled Nursing, Therapy Services

Contact Spokane Falls Care

Staffing Data

Reporting period: October 1 – December 31, 2025 (Q4 2025). Source: CMS Payroll-Based Journal report.

Total staff 144
Employees 96
Contractors 48
Staff to resident ratio 2.03 : 1
9% more staff per resident than Washington average
Washington average ratio: 1.86 : 1 Washington average ratio: 1.86 : 1See full Washington ranking
Avg staff/day 42
Average shift 8.6 hours
6% better than Washington average
Washington average: 8.1 hours Washington average shift: 8.1 hoursSee full Washington ranking
Total staff hours (quarter) 33,115

Nursing staff breakdown

Q4 2025 · Oct 1 – Dec 31 More info This data comes from the CMS Payroll-Based Journal report covering October 1 – December 31, 2025.
Registered Nurse

Manages medical care and health needs.

RN Staff Info 15 total: 8 full-time employees and 7 contractors. 15
Average shift length Info Average shift length. Calculated as total hours divided by days worked and average staff per day. 8.9 hours
Licensed Practical Nurse

Assists with medical care and medications.

LPN Staff Info 30 total: 10 full-time employees and 20 contractors. 30
Average shift length Info Average shift length. Calculated as total hours divided by days worked and average staff per day. 9.7 hours
Certified Nursing Assistant

Helps with daily care and mobility.

CNA Staff Info 56 total: 42 full-time employees and 14 contractors. 56
Average shift length Info Average shift length. Calculated as total hours divided by days worked and average staff per day. 9.2 hours

Contractor staffing

Q4 2025 · Oct 1 – Dec 31 More info This data comes from the CMS Payroll-Based Journal report covering October 1 – December 31, 2025.

Total hours from contractors

6.7%

2,208 contractor hours this quarter

Licensed Practical Nurse: 20 Certified Nursing Assistant: 14 Registered Nurse: 7 Occupational Therapy Assistant: 2 Physical Therapy Assistant: 1 Occupational Therapy Aide: 1 Qualified Social Worker: 1 Speech Language Pathologist: 1 Medical Director: 1

Staff by category

Q4 2025 · Oct 1 – Dec 31 More info This data comes from the CMS Payroll-Based Journal report covering October 1 – December 31, 2025.
Certified Nursing Assistant42145617,00192100%9.2
Licensed Practical Nurse1020305,72892100%9.7
Registered Nurse87151,6998997%8.9
Clinical Nurse Specialist6061,1276773%7.9
Mental Health Service Worker3031,0346975%8.3
RN Director of Nursing3031,0197278%8.1
Other Dietary Services Staff3037938390%7.5
Occupational Therapy Aide3147556267%6.1
Physical Therapy Aide3036326773%7.2
Respiratory Therapy Technician3035286975%5.9
Dietitian1015156571%7.9
Speech Language Pathologist3145106368%7.3
Administrator1014645863%8
Nurse Practitioner2024165257%8
Qualified Social Worker1124146571%6.2
Physical Therapy Assistant4154126672%4.8
Occupational Therapy Assistant02243910%4.8
Medical Director011241213%2
56 Certified Nursing Assistant
% of Days 100%
30 Licensed Practical Nurse
% of Days 100%
15 Registered Nurse
% of Days 97%
6 Clinical Nurse Specialist
% of Days 73%
3 Mental Health Service Worker
% of Days 75%
3 RN Director of Nursing
% of Days 78%
3 Other Dietary Services Staff
% of Days 90%
4 Occupational Therapy Aide
% of Days 67%
3 Physical Therapy Aide
% of Days 73%
3 Respiratory Therapy Technician
% of Days 75%
1 Dietitian
% of Days 71%
4 Speech Language Pathologist
% of Days 68%
1 Administrator
% of Days 63%
2 Nurse Practitioner
% of Days 57%
2 Qualified Social Worker
% of Days 71%
5 Physical Therapy Assistant
% of Days 72%
2 Occupational Therapy Assistant
% of Days 10%
1 Medical Director
% of Days 13%

Penalties and fines

Includes penalties issued in 2023-2024

Federal penalties imposed by CMS for regulatory violations, including civil money penalties (fines) and denials of payment for new Medicare/Medicaid admissions.

Source: CMS Penalties Database (Data as of Jan 2026)

Total fines amount $184K Rank #74 / 92Federal fines — State benchmarkedThis home is ranked 74th out of 92 homes in Washington. Shows this facility's cumulative CMS federal fine dollars versus the Washington average among facilities with fines, and where it ranks among 92 facilities in the pool. Lower total dollars mean a better rank.Ranking totals vary by category as each rank only includes facilities that report data for that metric. Homes missing that data point aren't included in the ranking.Click the rank badge to see the full State ranking.Click here to see the full State ranking.
125% higher than Washington average

Washington average: $82K

Number of fines 3
62% more fines than Washington average

Washington average: 1.8

Payment Denials Info Serious action where Medicare and/or Medicaid temporarily stops payments for new residents until issues are fixed. 0
100% fewer payment denials than Washington average

Washington average: 0.3

Fines amount comparison
This facility $184K
Washington average $82K
Penalty History

Penalties are imposed by CMS for violations of federal nursing home regulations.

2 penalties in the past 3 years

Multiple penalties were reported in the last 3 years.

Civil Money Penalty Info Fines imposed for noncompliance, which can be assessed per day or per instance of violation. Mar 8, 2024
$14K
Civil Money Penalty Info Fines imposed for noncompliance, which can be assessed per day or per instance of violation. Nov 2, 2023
$112K

Last updated: Jan 2026

Quality of care over time

These measures show how residents usually do over time at this home, based on health outcomes and preventive care.

High-risk clinical events score Info A composite score based on pressure ulcers, falls with injury, weight loss, walking ability decline, and activities of daily living decline. 4.4
56% better than Washington average

Washington average: 10.0

Functional decline score Info A composite score based on activities of daily living decline, walking ability decline, and incontinence. 11.4
45% better than Washington average

Washington average: 20.9

Long-stay resident measures
Significantly above average Washington avg: 3.6 Info CMS star rating based on long-stay quality measure performance. 5 stars = significantly above average, 1 star = significantly below average.
Need for Help with Daily Activities Increased Info Percent of long-stay residents whose need for help with daily activities has increased 6.5%
61% better than Washington average

Washington average: 16.4%

Walking Ability Worsened Info Percent of long-stay residents whose ability to move independently worsened 5.1%
77% better than Washington average

Washington average: 21.8%

Low Risk Residents with Bowel/Bladder Incontinence Info Percent of low risk long-stay residents who lose control of their bowels or bladder 22.6%
7% better than Washington average

Washington average: 24.3%

Falls with Major Injury Info Percent of long-stay residents experiencing one or more falls with major injury 4.1%
56% worse than Washington average

Washington average: 2.6%

High Risk Residents with Pressure Ulcers Info Percent of long-stay high risk residents with pressure ulcers 4.1%
16% better than Washington average

Washington average: 4.9%

Urinary Tract Infection Info Percent of long-stay residents with a urinary tract infection 0.9%
48% better than Washington average

Washington average: 1.7%

Lost Too Much Weight Info Percent of long-stay residents who lose too much weight 2.5%
58% better than Washington average

Washington average: 5.8%

Depressive Symptoms Info Percent of long-stay residents who have depressive symptoms 11.1%
31% better than Washington average

Washington average: 16.2%

Antipsychotic Use Info Percent of long-stay residents who received an antipsychotic medication 22.1%
53% worse than Washington average

Washington average: 14.5%

Pneumococcal Vaccine Info Percent of long-stay residents assessed and appropriately given the pneumococcal vaccine 99.1%
In line with Washington average

Washington average: 96.2%

Influenza Vaccine Info Percent of long-stay residents assessed and appropriately given the seasonal influenza vaccine 98.5%
5% better than Washington average

Washington average: 93.8%

Short-stay resident measures
Average Washington avg: 3.6 Info CMS star rating based on short-stay quality measure performance. 5 stars = much above average, 1 star = much below average.
Pneumococcal Vaccine Info Percent of short-stay residents assessed and appropriately given the pneumococcal vaccine 97.8%
11% better than Washington average

Washington average: 88.1%

Antipsychotic medication increase Info Percent of short-stay residents who newly received an antipsychotic medication 3.3%
132% worse than Washington average

Washington average: 1.4%

Influenza Vaccine Info Percent of short-stay residents assessed and appropriately given the seasonal influenza vaccine 97.1%
18% better than Washington average

Washington average: 82.0%

Re-hospitalized after SNF stay Info Percentage of short-stay residents who were re-hospitalized after their nursing home admission. 31.2%
57% worse than Washington average

Washington average: 19.9%

Emergency department visits Info Percentage of short-stay residents who had an outpatient emergency department visit. 12.1%
8% better than Washington average

Washington average: 13.2%

Falls with major injury Info Percentage of SNF residents who experience falls with major injury during their stay. 0.0%
100% better than Washington average

Washington average: 0.8%

Ability to care for self at discharge Info Percentage of residents at or above expected ability to care for themselves at discharge. 39.3%
27% worse than Washington average

Washington average: 53.7%

Successful return to home or community Info Rate of successful return to home or community from a skilled nursing facility. 55.0%
9% better than Washington average

Washington average: 50.6%

Breakdown by payment type

Medicare

21% of new residents, usually for short-term rehab.

Typical stay 1 - 2 months

Private pay

64% of new residents, often for short stays.

Typical stay 26 days

Medicaid

16% of new residents, often for long-term daily care.

Typical stay 1 years

Facility Characteristics

Source: CMS Long-Term Care Facility Characteristics (Data as of Jan 2026)

Total residents 71
Medicare
14
19.7% of residents
Medicaid
56
78.9% of residents
Private pay or other
1
1.4% of residents
Programs & Services
Residents Group

Residents meet regularly to discuss policies, care quality, and activities

Active Resident Council

Organized group of residents that meets regularly to discuss facility policies, quality of life, and activities.

Finances and operations

Based on CMS SNF Cost Report for fiscal year ending in 12/2023.

Voluntary non-profit community
Operated by a church.
Net patient revenue Info Net patient revenue — what the home actually collects for resident care, after contractual allowances, bad debt and discounts are subtracted from its gross charges (CMS cost report, Worksheet G-3). It covers resident care only; money the home earns from other sources is shown separately as "Other income."
$10.9M
Net patient income Info Net patient income: net patient revenue minus the home's total operating expenses. A positive figure means it earns more from resident care than it spends to deliver it; a negative figure means the opposite. It excludes non-operating "other income."
$227.8K
Voluntary non-profit community Operated by a church.
Net patient revenue Info Net patient revenue — what the home actually collects for resident care, after contractual allowances, bad debt and discounts are subtracted from its gross charges (CMS cost report, Worksheet G-3). It covers resident care only; money the home earns from other sources is shown separately as "Other income."
$10.9M Rank #63 / 94Revenue — State benchmarkedThis home is ranked 63rd out of 94 homes in Washington. Shows this facility's annual revenue compared to the Washington average. Higher revenue generally means more resources for staffing and capital — read alongside Payroll %.Ranking totals vary by category as each rank only includes facilities that report data for that metric. Homes missing that data point aren't included in the ranking.Click the rank badge to see the full State ranking.Click here to see the full State ranking.
Net patient income Info Net patient income: net patient revenue minus the home's total operating expenses. A positive figure means it earns more from resident care than it spends to deliver it; a negative figure means the opposite. It excludes non-operating "other income."
$227.8K
Other income Info Money the home earns outside of resident care — such as investments, grants, rentals and other non-operating sources (CMS cost report, Worksheet G-3). It is tracked separately from net patient revenue: it is not part of that figure, and it is not included in net patient income.
$685.1K
Payroll costs Info Staff salaries plus wage-related costs — benefits such as payroll taxes, health insurance and retirement — from the home's own accounting records (CMS cost report, Worksheet A). Contract or agency labor is counted separately, under other operating costs. Rank #63 / 94Payroll — State benchmarkedThis home is ranked 63rd out of 94 homes in Washington. Shows total annual staff payroll benchmarked to the Washington average. Higher payroll investment relative to peers often signals better staffing and less reliance on cheaper contract labor.Ranking totals vary by category as each rank only includes facilities that report data for that metric. Homes missing that data point aren't included in the ranking.Click the rank badge to see the full State ranking.Click here to see the full State ranking.
$5.7M 51.8% of net patient revenue Info Payroll as a share of revenue: staff salaries and wage-related benefits divided by net patient revenue. A higher figure means more of each revenue dollar goes to staff pay. Rank #56 / 94Payroll % — State benchmarkedThis home is ranked 56th out of 94 homes in Washington. Shows payroll as a percentage of revenue versus the Washington average. Well-run Washington facilities typically land around 53–61% — the top third Statewide. Below 25% may signal understaffing or heavy agency use — read with Staffing ratings.Ranking totals vary by category as each rank only includes facilities that report data for that metric. Homes missing that data point aren't included in the ranking.Click the rank badge to see the full State ranking.Click here to see the full State ranking.
Other operating costs Info Everything it costs to run the home apart from payroll — food, utilities, supplies, maintenance, contract labor and administration. Calculated as total operating expense minus payroll (staff salaries and wage-related benefits).
$5.0M
Total costs Info The home's total operating expense for the year — all the costs of running it, salaries included (CMS cost report, Worksheet G-3).
$10.7M

What does this home offer?

Housing options icon

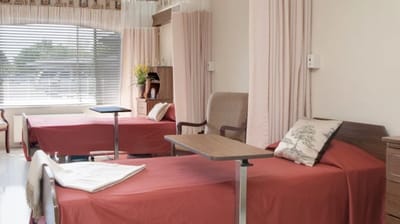
Housing Options: Private Rooms

Building type icon
Building type icon

Building Type: Single-story

Fitness and recreation icon

Fitness and Recreation

Who this home usually serves

TYPE OF STAY

Primarily short stays

Residents typically stay for brief periods, with frequent admissions and discharges throughout the year.

Most new residents arrive under private pay (64% of admissions), and a typical private pay stay runs around 26 days.

Admissions
276 total

Coverage residents most often arrive under.

Medicare 21%
Private pay 64%
Medicaid 16%
Discharges
268 total

Coverage residents most often leave under.

Medicare 18%
Private pay 43%
Medicaid 40%

Managed by Danni Orne

Executive Director

Places of interest near Spokane Falls Care

Address 4.7 miles from city center Info Estimated distance in miles from Spokane's city center to Spokane Falls Care's address, calculated via Google Maps. — 0.22 miles to nearest hospital (Fresenius Medical Care at Providence Holy Family Hospital-Icu)

Calculate Travel Distance to Spokane Falls Care

Add your location

Address

Compare Nursing Home around Spokane

The information below is reported by the Washington Department of Social and Health Services, Residential Care Services.

4 facilities compared · CMS & WA Dept. of Health data

Regency at Northpointe
NH
RC
Spokane (Shiloh Hills)
120
Facility 120
WA AVG 82
Rank #46 / 366
74.0%
Facility 74.0%
WA AVG 72.5%
Rank #162 / 310
+2%
3.83
Facility 3.83
WA AVG 4.22
Rank #61 / 90
-41%-9%
$8.3k
Facility $8.3k
WA AVG $87.7k
Rank #35 / 92
15
Facility 15
WA AVG 48.9
Rank #4 / 92
3.8
Facility 3.8
WA AVG 6.9
Rank #10 / 92
190-
37
Facility 37
WA AVG 51
Rank #427 / 628
Tod Dunfield
$16.2M
Facility $16.2M
WA AVG $13.2M
Rank #28 / 94
$8.8M
Facility $8.8M
WA AVG $5.7M
Rank #24 / 94
54.4%
Facility 54.4%
WA AVG 45.5%
Rank #38 / 94
505369
Rockwood South Hill
NH
AL
IL
MC
Spokane (Downtown Spokane)
90
Facility 90
WA AVG 82
Rank #134 / 366
77.8%
Facility 77.8%
WA AVG 72.5%
Rank #133 / 310
+7%
5.77
Facility 5.77
WA AVG 4.22
Rank #4 / 90
+104%+37%
$0
Facility $0
WA AVG $87.7k
Rank #1 / 92
48
Facility 48
WA AVG 48.9
Rank #45 / 92
12.0
Facility 12.0
WA AVG 6.9
Rank #83 / 92
-35-
96
Facility 96
WA AVG 51
Rank #15 / 628
Chris Bafus
$24.8M
Facility $24.8M
WA AVG $13.2M
Rank #6 / 94
$15.9M
Facility $15.9M
WA AVG $5.7M
Rank #6 / 94
64.3%
Facility 64.3%
WA AVG 45.5%
Rank #67 / 94
505033
Aurora Valley Care
NH
Spokane Valley
124
Facility 124
WA AVG 82
Rank #40 / 366
53.3%
Facility 53.3%
WA AVG 72.5%
Rank #274 / 310
-27%
3.54
Facility 3.54
WA AVG 4.22
Rank #77 / 90
-53%-16%
$93.5k
Facility $93.5k
WA AVG $87.7k
Rank #69 / 92
106
Facility 106
WA AVG 48.9
Rank #88 / 92
5.6
Facility 5.6
WA AVG 6.9
Rank #34 / 92
577-
72
Facility 72
WA AVG 51
Rank #132 / 628
-
$10.1M
Facility $10.1M
WA AVG $13.2M
Rank #70 / 94
$4.7M
Facility $4.7M
WA AVG $5.7M
Rank #73 / 94
46.8%
Facility 46.8%
WA AVG 45.5%
Rank #71 / 94
505114
Spokane Falls Care
NH
Spokane (Nevada Heights)
100
Facility 100
WA AVG 82
Rank #93 / 366
70.5%
Facility 70.5%
WA AVG 72.5%
Rank #196 / 310
-3%
4.42
Facility 4.42
WA AVG 4.22
Rank #24 / 90
-27%+5%
$125.7k
Facility $125.7k
WA AVG $87.7k
Rank #74 / 92
106
Facility 106
WA AVG 48.9
Rank #88 / 92
6.2
Facility 6.2
WA AVG 6.9
Rank #43 / 92
678-
76
Facility 76
WA AVG 51
Rank #107 / 628
Navdeep Dhaliwal
$10.9M
Facility $10.9M
WA AVG $13.2M
Rank #63 / 94
$5.7M
Facility $5.7M
WA AVG $5.7M
Rank #63 / 94
51.8%
Facility 51.8%
WA AVG 45.5%
Rank #56 / 94
505024

Financial Assistance for
Nursing Home in Washington

Spokane Falls Care is located in Spokane, Washington.
Here are the financial assistance programs available to residents in Washington.

Get Financial aid guidance

Community Options Program Entry System (COPES)

WA Medicaid COPES

Age 65+ or disabled
General Washington resident, Medicaid-eligible, nursing home-level care need.
Income Limits (2025) ~$2,829/month 300% FBR, individual
Asset Limits $2,000 (individual), $3,000 (couple).
WA

High demand in urban areas (e.g., Seattle).

Benefits
Personal care (5-7 hours/day) Respite (240 hours/year) Adult day care ($70/day) Home modifications ($1,500 avg.)

Washington Family Caregiver Support Program

WA NFCSP

Age Caregiver of someone 60+ (or with dementia)
General Washington resident.
Income Limits No strict limit; prioritizes low-income.
Asset Limits Not applicable.
WA

High urban demand; rural outreach.

Benefits
In-home respite (4-6 hours/day) Adult day care (~$70/day) Short-term facility care (up to 5 days)

Community First Choice (CFC)

Washington Community First Choice

Age 65+ (or disabled 18+)
General WA resident, Medicaid-eligible, need help with 2+ ADLs/IADLs.
Income Limits (2025) ~$2,829/month; QIT optional.
Asset Limits $2,000 (individual), $3,000 (couple).
WA

Broader than COPES; serves ~20,000; self-directed option.

Benefits
Personal care (4-6 hours/day) Respite (~240 hours/year) Assistive devices Training Transportation

Older Americans Act (OAA) Services

Washington OAA Services

Age 60+
General WA resident; no income/asset limits.
Income Limits (2025) None; donations encouraged.
Asset Limits Not assessed.
WA

13 AAAs; includes Meals on Wheels; rural focus.

Benefits
Meals (~$5-$7/meal) Transportation Homemaker services (~4 hours/week) Respite (~5 days/year) Legal aid

Medicare Savings Program (MSP)

Washington Medicare Savings Program

Age 65+ or disabled
General WA resident, Medicare Part A/B.
Income Limits (2025) ~$2,510/month (QMB), ~$3,380/month (SLMB), ~$3,598/month (QI)—individual.
Asset Limits $9,430 (individual), $14,130 (couple).
WA

Includes Extra Help for Part D; no waitlist.

Benefits
Covers Part B premiums ($174.70/month) Deductibles ($240/year) Copays (~20%)

VA Aid and Attendance (A&A) and Housebound Benefits

Washington VA Aid and Attendance/Housebound

Age 65+ or disabled veteran/spouse
General WA resident, wartime service, ADL help (A&A) or homebound.
Income Limits (2025) Net income < ~$1,984/month (veteran with dependent, A&A); pension offsets income.
Asset Limits ~$155,356 net worth
WA

High veteran use; supports rural/urban needs.

Benefits
Cash (~$1,433-$2,642/month veteran, ~$951-$1,318 spouse) for care costs

Senior Citizens Property Tax Exemption

Washington Senior Property Tax Exemption

Age 61+ or disabled retiree
General WA resident, homeowner, income-based.
Income Limits (2025) ~$45,000-$70,000/year varies by county, e.g., King: $70,000
Asset Limits Not assessed; home value cap varies ~$250,000-$400,000
WA

Saves ~$500-$1,500/year; offered statewide.

Benefits
Tax exemption (~$500-$1,500/year depending on county)

Senior Farmers’ Market Nutrition Program (SFMNP)

Washington SFMNP

Age 60+
General WA resident, low-income.
Income Limits (2025) ~$2,322/month 185% FPL
Asset Limits Not assessed.
WA

Vouchers (~$80/season); serves ~20,000 via AAAs.

Benefits
Vouchers (~$80/season) for produce at farmers’ markets

Frequently Asked Questions about Spokane Falls Care

What neighborhood is Spokane Falls Care in?

Spokane Falls Care is in the Nevada Heights neighborhood.

Is Spokane Falls Care in a walkable area?

Spokane Falls Care has a walk score of 76. Very walkable. Most errands can be accomplished on foot, and many essentials are within a short walk.

What is the occupancy rate at Spokane Falls Care?

Spokane Falls Care's occupancy is 70.5%.

Are there photos of Spokane Falls Care?

Yes — there are 5 photos of Spokane Falls Care in the photo gallery on this page.

What is the phone number of Spokane Falls Care?

(509) 489-3323 will put you in contact with the team at Spokane Falls Care.

Is Spokane Falls Care Medicare or Medicaid certified?

Yes — Spokane Falls Care is a CMS-certified provider of Medicare and Medicaid.

Guides for Better Senior Living

Care Cost Calculator: See Prices in Your Area

Nursing Home Data Explorer

Don’t Wait Too Long: 7 Red Flag Signs Your Parent Needs Assisted Living Now

The True Cost of Assisted Living in 2025 – And How Families Are Paying For It

Understanding Senior Living Costs: Pricing Models, Discounts & Financial Assistance