Autumn Care of Norfolk

Nursing Home
Overview of Autumn Care of Norfolk

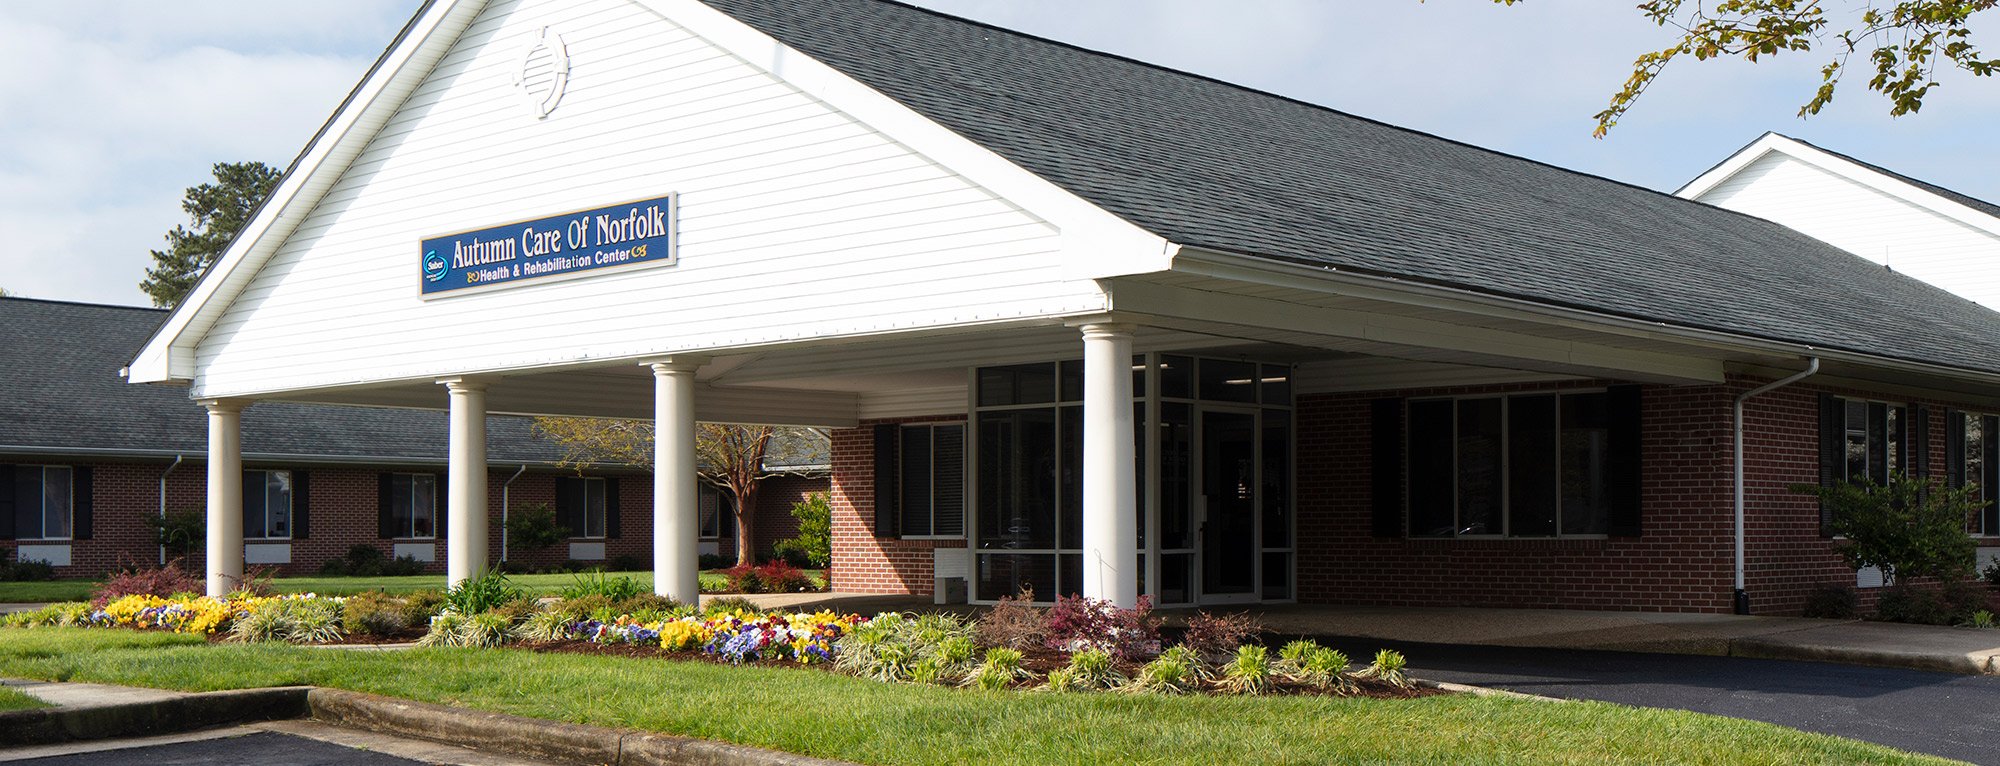
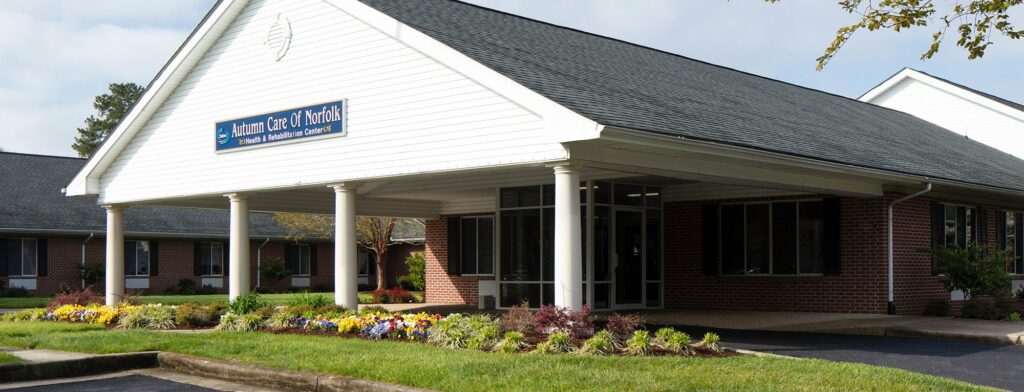
Established in 1995, Autumn Care of Norfolk has emerged as a distinguished long-term care facility, serving seniors with a steadfast commitment to high-quality care. This trusted provider offers a wide spectrum of services, including short and long-term care, set against a picturesque backdrop featuring waterfront attractions. Moreover, the home organizes exciting outings to various destinations, from botanical gardens to baseball games and historic warships, ensuring a dynamic and engaging experience for residents and their families.
This award-winning facility goes beyond traditional nursing homes near you, providing comprehensive rehabilitation services and long-term skilled nursing care. With offerings such as speech therapy and respite care, Autumn Care of Norfolk stands as a valuable resource for seniors and their loved ones. What’s more, its strategically convenient location near major highways further underscores its accessibility, making it a practical and reliable choice.

(757) 857-0481

Quality ratings

Measured by Centers for Medicare & Medicaid Services (CMS)

Overall rating Info Official CMS rating based on health inspections, staffing and quality measures.
4/5
Virginia average: 3.0/5
Health Inspection Info Official CMS rating based on deficiencies found during state health inspections.
3/5
Virginia average: 2.8/5
Staffing Info Official CMS rating based on nurse staffing hours per resident per day.
2/5
Virginia average: 2.5/5
Quality Measures Info Official CMS rating based on clinical outcomes for residents.
5/5
Virginia average: 3.8/5

Nursing care per resident

Info Average daily nursing hours per resident (adjusted for acuity). Higher values indicate more nursing time per resident.
3h 14m per day

This home provides 13% less nursing time per resident than the state average.

Virginia average: 3h 45m per day

Staffing hours breakdown

Info Hours of care per resident per day, broken down by staff type. Data from CMS Medicare.
Staff type Facility State avg National avg
Registered Nurse (RN) Info Registered nurse hours per resident per day. 23m per day 41m per day 41m per day
LPN / LVN Info Licensed Practical Nurse / Licensed Vocational Nurse hours per resident per day. 56m per day 1h 0m per day 52m per day
Nurse Aide Info Nurse aide hours per resident per day. 2h 5m per day 2h 8m per day 2h 21m per day
Total Nursing (Weekend) Info Total number of nurse staff hours per resident per day on weekends. 2h 57m per day 3h 19m per day 3h 26m per day
Physical Therapist Info Physical therapist staff hours per resident per day. 2m per day 5m per day 4m per day
RN (Weekend) Info Registered nurse hours per resident per day on weekends. 16m per day 28m per day 29m per day

Capacity and availability

Medium-capacity home

Offers a balance of services and community atmosphere.

Total beds 120

This home usually has limited availability

Occupancy is moderate, suggesting balanced demand.

Similar demand to the Virginia average
Occupancy rate 90.5%
Residents per day (avg) 112
Occupancy rate
90.5%
Residents per day (avg)
112

Who this home usually serves

TYPE OF STAY

Primarily short stays

Residents typically stay for brief periods, with frequent admissions and discharges throughout the year.

Might be optimal for
Post-acute recovery Temporary care Transitional stays

Breakdown by payment type

Medicare

12% of new residents, usually for short-term rehab.

Typical stay 23 days

Private pay

82% of new residents, often for short stays.

Typical stay 4 - 5 months

Medicaid

6% of new residents, often for long-term daily care.

Typical stay 3 - 4 months

Finances and operations

Proprietary home
Corporation
Home revenue
$11.0M
Profit
$529.2K
Proprietary home Corporation
Home revenue
$10,958,142.00
Profit
$529,218.00
Payroll costs Info The portion of the home's budget spent on staff, including nurses, caregivers, and other employees who support care and operations.
$5.8M
53.1% of revenue
Other operating costs Info All remaining costs needed to run the home, such as food, utilities, building maintenance, supplies and administrative expenses.
$4.6M
Total costs $10.4M
Walk Score
Walk Score: 56 / 100
Moderately walkable. Some errands can be accomplished on foot, with a mix of nearby amenities.

About this community

Additional licensing details

Awards: 2020 Quality Initiative Recognition Program from the American Health Care Association (AHCA)

Care Services

Nursing Services
Rehabilitation Services
Respite Care
Memory Care
Skilled Nursing
Licensed Nurses/CNAs
24-Hour Staffing
Short-Term Rehab

All Levels of Care

Skilled Nursing
Rehabilitation
Long Term Care
Assisted Living
Memory Care
Personal Care

Programs & Activities

Specific Programs
Physical Therapy, Occupational Therapy, Speech Therapy, Short-Term Care, Long-Term Care, Hospice Care, Respite Care, 24-hour Skilled Nursing Care

Types of Care at Autumn Care of Norfolk

Nursing Home Assisted Living Memory Care
Contact Autumn Care of Norfolk

Compare Nursing Homes around Norfolk

The information below is reported by the Virginia Department of Social Services and Department of Health.
Autumn Care of Norfolk
SNF

Nursing Home 24/7 care needed

AL

Assisted Living For seniors needing help with daily tasks but not full-time nursing.

Norfolk (Foxhall)
120
No
56
SOPER, CELIA
90.5%
$10,954,267.00
$5,818,316.00
53.1%
112.40
4/5
3.2393
3/5
2/5
5/5
-
43
-
-46%
-13%
+6%
Studio / 1 Bed / 2 Bed
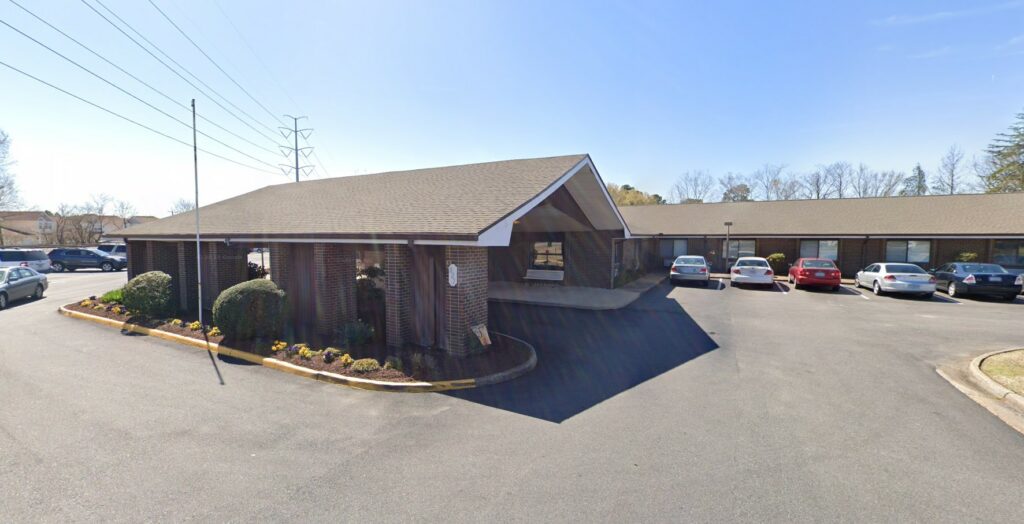
Ruxton Health of Norfolk
SNF

Nursing Home 24/7 care needed

AL

Assisted Living For seniors needing help with daily tasks but not full-time nursing.

Norfolk (Greenhill Farms)
60
No
39
MARSHALL-HODGES, KELLI
90.8%
$7,235,721.00
$3,696,631.00
51.1%
50.40
2/5
3.2679
3/5
1/5
3/5
-
46
1
-38%
-13%
+6%
Studio / 1 Bed
Signature Healthcare of Norfolk
SNF

Nursing Home 24/7 care needed

AL

Assisted Living For seniors needing help with daily tasks but not full-time nursing.

Norfolk (Ghent)
169
No
88
DRAKE, CIE
81.0%
$21,403,133.00
$5,217,290.00
24.4%
155.60
2/5
3.3945
2/5
2/5
4/5
-
47
3
-18%
-9%
-6%
Studio / 1 Bed
Consulate Health Care of Norfolk
SNF

Nursing Home 24/7 care needed

AL

Assisted Living For seniors needing help with daily tasks but not full-time nursing.

Norfolk (Colonial Place)
222
No
77
HAJIMOMENIAN, AMIR
87.3%
$24,065,882.00
$7,136,206.00
29.7%
192.60
1/5
3.3231
1/5
1/5
4/5
1
54
3
-52%
-11%
+2%
Studio / 1 Bed
Lafayette Villa Nursing Home
SNF

Nursing Home 24/7 care needed

AL

Assisted Living For seniors needing help with daily tasks but not full-time nursing.

Norfolk (Colonial Place)
-
No
75
-
-
-
-
-
-
-
-
-
-
-
-
-
-
-
-
-
Studio / 1 Bed

Places of interest near Autumn Care of Norfolk

Address 4.7 miles from city center — 1.14 miles to nearest hospital (Lake Taylor Transitional Care Hospital)

Address 1401 Halstead Ave, Norfolk, VA 23502

Calculate Travel Distance to Autumn Care of Norfolk

Add your location

Address

Staffing Data

Source: CMS Payroll-Based Journal (Q2 2025)

119
Total Staff
78
Employees
41
Contractors
35,826
Total Hours (Quarter)
47
Avg Staff/Day
8.4
Avg Shift (hrs)
Nursing Staff Breakdown
Role Count Avg Shift (hrs) Uses Contractors?
Registered Nurse69.8 No
Licensed Practical Nurse1910.3 Yes
Certified Nursing Assistant598.3 Yes
Staff by Category
Administration
2 staff
5.6hs shift avg
Nursing Staff
86 staff
8.9hs shift avg
Physicians & Practitioners
6 staff
8.2hs shift avg
Therapy Services
19 staff
6.1hs shift avg
Activities & Recreation
0 staff
0hs shift avg
Social Services
1 staff
2.1hs shift avg
Dietary Services
4 staff
7.8hs shift avg
Other Services
1 staff
7.6hs shift avg
Contractor Analysis
12.7%
of total hours from contractors
4,541 contractor hours this quarter
Licensed Practical Nurse: 3 Certified Nursing Assistant: 15 Physical Therapy Aide: 1 Physical Therapy Assistant: 3 Clinical Nurse Specialist: 2 Speech Language Pathologist: 1 Qualified Social Worker: 1 Occupational Therapy Aide: 2 Respiratory Therapy Technician: 3 Occupational Therapy Assistant: 8 Medical Director: 1 RN Director of Nursing: 1
Role Employees Contractors Total Staff Total Hours Days Worked % of Days Avg Shift (hrs)
Certified Nursing Assistant44155918,87591100%8.3
Licensed Practical Nurse163198,56791100%10.3
Registered Nurse6062,65391100%9.8
Clinical Nurse Specialist3251,2916875%8.2
Other Dietary Services Staff3035636470%7.7
Nurse Practitioner1015126470%8
Physical Therapy Aide0115126571%7.9
Dietitian1014926369%7.8
Administrator1014645864%8
Physical Therapy Assistant0334266268%6.7
Occupational Therapy Aide1233784549%8.1
Speech Language Pathologist0113286167%5.4
Respiratory Therapy Technician0332393842%6.3
Dental Services Staff1011672224%7.6
Nurse Aide in Training1011582224%7.2
Qualified Social Worker0111145560%2.1
Occupational Therapy Assistant088534044%1.3
Medical Director011242932%0.8
RN Director of Nursing0111322%6.3

Health Inspection History

Inspections
Total health inspections 3

Virginia average 4.2


Last Health inspection on Jan 2023

Total health citations 43
Citations per inspection
14.33

Health citations are formal notices following inspections when they fail to comply with safety and care standards.

38 of 43 citations resulted from standard inspections; and 5 of 43 came from combined inspections (standard and complaint).

Breakdown of citation severity (last 3 years)
Critical Health citations More info 0
100% better than Virginia average

Virginia average: 0.4


Serious Health citations More info 0
100% better than Virginia average

Virginia average: 1

0 critical citations More info Virginia average: 0.4

0 serious citations More info Virginia average: 1

43 moderate citations More info Virginia average: 36.3

0 minor citations More info Virginia average: 0.8
Citations history (last 3 years)
Infection Control moderate citation Jan 13, 2023
Corrected

Pharmacy moderate citation Jan 13, 2023
Corrected

Pharmacy moderate citation Jan 13, 2023
Corrected

Pharmacy moderate citation Jan 13, 2023
Corrected

Facility Characteristics

Source: CMS Long-Term Care Facility Characteristics (Data as of Jan 2026)

Ownership: For-Profit Individual
Part of: Saber Health Group
Resident Census by Payment Source
106 Total Residents
Medicare 8 (7.5%)
Medicaid 70 (66%)
Private Pay/Other 28 (26.4%)
Programs & Services
Residents' Group
Family Engagement

Active councils help families stay involved in care decisions and facility operations.

Quality of care over time

These measures show how residents usually do over time at this home, based on health outcomes and preventive care.

High-risk clinical events score Info A composite score based on pressure ulcers, falls with injury, weight loss, walking ability decline, and activities of daily living decline. 9.4
7% better than Virginia average

Virginia average: 10.1

Functional decline score Info A composite score based on activities of daily living decline, walking ability decline, and incontinence. 20.2
In line with Virginia average

Virginia average: 19.7

Long-stay resident measures
Need for Help with Daily Activities Increased Info Percent of long-stay residents whose need for help with daily activities has increased 20.8%
23% worse than Virginia average

Virginia average: 16.8%

Walking Ability Worsened Info Percent of long-stay residents whose ability to move independently worsened 15.6%
21% better than Virginia average

Virginia average: 19.7%

Low Risk Residents with Bowel/Bladder Incontinence Info Percent of low risk long-stay residents who lose control of their bowels or bladder 24.2%
7% worse than Virginia average

Virginia average: 22.6%

Falls with Major Injury Info Percent of long-stay residents experiencing one or more falls with major injury 2.3%
37% better than Virginia average

Virginia average: 3.6%

High Risk Residents with Pressure Ulcers Info Percent of long-stay high risk residents with pressure ulcers 4.7%
13% better than Virginia average

Virginia average: 5.4%

Urinary Tract Infection Info Percent of long-stay residents with a urinary tract infection 0.0%
100% better than Virginia average

Virginia average: 1.5%

Lost Too Much Weight Info Percent of long-stay residents who lose too much weight 3.7%
38% better than Virginia average

Virginia average: 5.9%

Depressive Symptoms Info Percent of long-stay residents who have depressive symptoms 10.6%
29% better than Virginia average

Virginia average: 14.9%

Antipsychotic Use Info Percent of long-stay residents who received an antipsychotic medication 7.1%
45% better than Virginia average

Virginia average: 12.9%

Pneumococcal Vaccine Info Percent of long-stay residents assessed and appropriately given the pneumococcal vaccine 17.1%
81% worse than Virginia average

Virginia average: 91.3%

Influenza Vaccine Info Percent of long-stay residents assessed and appropriately given the seasonal influenza vaccine 91.4%
In line with Virginia average

Virginia average: 94.0%

Short-stay resident measures
Pneumococcal Vaccine Info Percent of short-stay residents assessed and appropriately given the pneumococcal vaccine 10.8%
86% worse than Virginia average

Virginia average: 74.9%

Antipsychotic medication increase Info Percent of short-stay residents who newly received an antipsychotic medication 0.8%
38% better than Virginia average

Virginia average: 1.2%

Influenza Vaccine Info Percent of short-stay residents assessed and appropriately given the seasonal influenza vaccine 57.0%
23% worse than Virginia average

Virginia average: 73.6%

Re-hospitalized after SNF stay Info Percentage of short-stay residents who were re-hospitalized after their nursing home admission. 19.5%
11% better than Virginia average

Virginia average: 22.0%

Emergency department visits Info Percentage of short-stay residents who had an outpatient emergency department visit. 5.3%
55% better than Virginia average

Virginia average: 11.7%

Falls with major injury Info Percentage of SNF residents who experience falls with major injury during their stay. 0.0%
100% better than Virginia average

Virginia average: 0.8%

Ability to care for self at discharge Info Percentage of residents at or above expected ability to care for themselves at discharge. 66.7%
24% better than Virginia average

Virginia average: 53.7%

Successful return to home or community Info Rate of successful return to home or community from a skilled nursing facility. 54.0%
7% better than Virginia average

Virginia average: 50.6%

Guides for Better Senior Living

Care Cost Calculator: See Prices in Your Area

Nursing Home Data Explorer

Don’t Wait Too Long: 7 Red Flag Signs Your Parent Needs Assisted Living Now

The True Cost of Assisted Living in 2025 – And How Families Are Paying For It

Understanding Senior Living Costs: Pricing Models, Discounts & Financial Assistance

Financial Aid for Virginia Seniors

Get financial aid guidance

Commonwealth Coordinated Care Plus (CCC Plus)

VA Medicaid CCC Plus

Age 65+ or disabled, Virginia resident, Medicaid-eligible, nursing home-level care need.

~$2,829/month (300% FBR, individual).

$2,000 (individual), $3,000 (couple).

Managed care model; high demand in urban areas.

Virginia Respite Care Grant Program

VA Respite Grant

Caregiver of someone 60+, Virginia resident.

~$2,500/month (individual, varies).

$40,000 (individual).

Limited grants; rural/urban balance.

Adult Services Program

Virginia Adult Services (AS)

Age 60+ (or disabled 18+), VA resident, need significant care (2+ ADLs), not Medicaid-eligible.

Varies by locality; typically < ~$2,510/month (200% FPL).

Limited assets (excludes home, car); varies by DSS.

Serves ~5,000 annually; focuses on low-income independence.

Auxiliary Grant Program

Virginia Auxiliary Grant (AG)

Age 65+ (or disabled 18+), VA resident, living in approved ALF/foster care, SSI-eligible or low-income.

~$1,041/month (individual, SSI level + $20 disregard); higher with medical deductions.

$2,000 (individual).

Serves 4,000; personal needs allowance ($90/month).

Medicare Savings Program (MSP)

Virginia Medicare Savings Program

Age 65+ or disabled, VA resident, Medicare Part A/B.

~$2,510/month (QMB), ~$3,380/month (SLMB), ~$3,598/month (QI)—individual.

$9,430 (individual), $14,130 (couple).

Includes Extra Help for Part D; no waitlist.

Energy Assistance Program (EAP)

Virginia Energy Assistance Program

Age 60+ prioritized, VA resident, low-income household.

~$3,970/month (185% FPL).

Not assessed.

Fuel, Crisis, Cooling components; serves ~100,000 households.

Senior Community Service Employment Program (SCSEP)

Virginia SCSEP

Age 55+, unemployed, low-income, VA resident.

~$1,983/month (125% FPL).

Not specified.

Priority for veterans, rural residents; AARP/Goodwill partnership.

VA Aid and Attendance (A&A) and Housebound Benefits

Virginia VA Aid and Attendance/Housebound

Age 65+ or disabled veteran/spouse, VA resident, wartime service, ADL help (A&A) or homebound.

Net income < ~$1,984/month (veteran with dependent, A&A); pension offsets income.

~$155,356 (net worth).

High veteran population; supports rural/urban needs.

Property Tax Relief for the Elderly and Disabled

Virginia Property Tax Relief

Age 65+ or disabled, VA resident, homeowner, income/asset limits vary by locality.

~$50,000-$75,000/year (household, e.g., Fairfax: $72,000; Richmond: $50,000).

Varies (e.g., Fairfax: $400,000 net worth; Richmond: $100,000).

Offered in 90% of localities; saves ~$500-$2,000/year.

Senior Farmers’ Market Nutrition Program (SFMNP)

Virginia SFMNP

Age 60+, VA resident, low-income.

~$2,322/month (185% FPL).

Not assessed.

Vouchers (~$50-$75/season); serves ~15,000 via AAAs.

Who we are

Your Senior Care Partner, Every Step of the Way

We help families find affordable senior communities and unlock same day discounts, Medicaid, and Medicare options tailored to your needs.

Contact us Today
Tour Icon
Planning a tour? Check our touring checklist.
Chat Icon
Thinking of living here? We can help you speak to a current resident