Explore Open Rooms

1 Contact details
2 What type of senior care service are you looking for?
3 What budget do you have in mind for senior care?
4 How soon do you need to find care?
5 Additional details

Thank you for your interest!

Our team will be in touch shortly to help with next steps.

Nursing Home

Autumn Care of Norfolk

Nursing Home

Autumn Care of Norfolk

1401 Halstead Ave, Norfolk, VA 23502 View map
Overview of Autumn Care of Norfolk

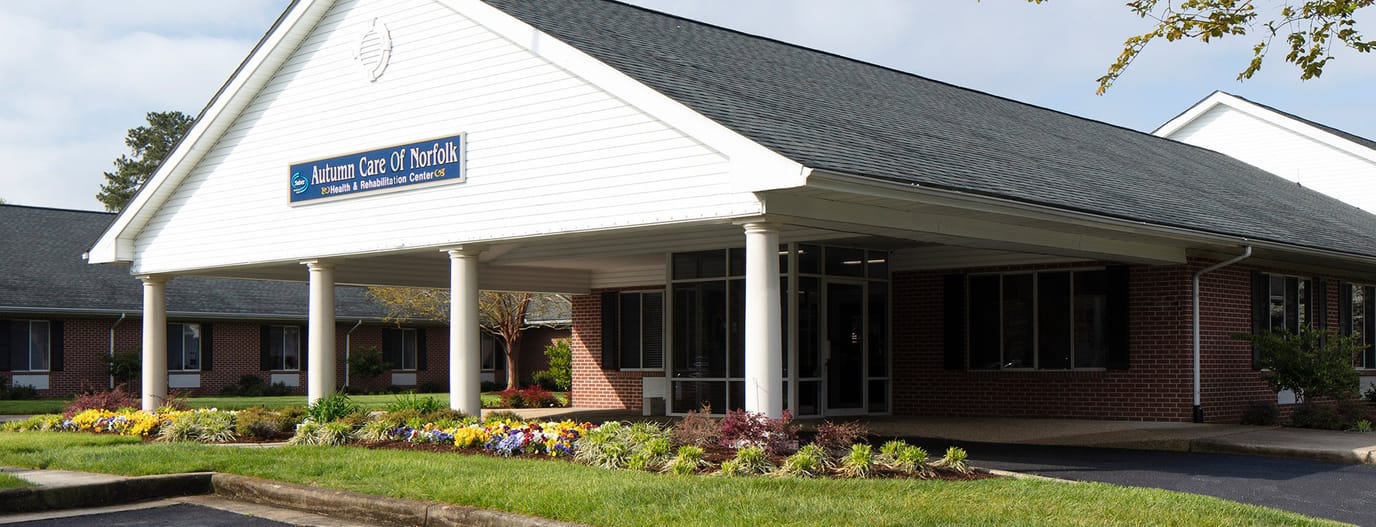
Established in 1995, Autumn Care of Norfolk has emerged as a distinguished long-term care facility, serving seniors with a steadfast commitment to high-quality care. This trusted provider offers a wide spectrum of services, including short and long-term care, set against a picturesque backdrop featuring waterfront attractions. Moreover, the home organizes exciting outings to various destinations, from botanical gardens to baseball games and historic warships, ensuring a dynamic and engaging experience for residents and their families.
This award-winning facility goes beyond traditional nursing homes near you, providing comprehensive rehabilitation services and long-term skilled nursing care. With offerings such as speech therapy and respite care, Autumn Care of Norfolk stands as a valuable resource for seniors and their loved ones. What’s more, its strategically convenient location near major highways further underscores its accessibility, making it a practical and reliable choice.

(757) 857-0481

Quality ratings

Measured by Centers for Medicare & Medicaid Services (CMS)

Overall rating Info The Overall CMS Rating combines results from health inspections, staffing levels and quality measures. Health inspections carry the most weight. Staffing and quality scores can increase or decrease the final rating based on performance compared to state and national standards.
4/5
Virginia average: 3.0/5
Health Inspection Info Based on the results of the facility's three most recent standard inspections and any complaint investigations. CMS reviews the number, scope, and severity of deficiencies, with more recent findings weighted more heavily.
3/5
Virginia average: 2.8/5
Staffing Info Measures average nursing staff hours per resident per day, including Registered Nurses (RNs) and total nursing staff. Ratings are adjusted based on the level of care residents require and are compared to state and national benchmarks.
2/5
Virginia average: 2.5/5
Quality Measures Info Based on clinical and physical health indicators reported to CMS, such as hospital readmissions, falls, pressure ulcers, and improvements in mobility. These measures reflect how well residents' health needs are being managed.
5/5
Virginia average: 3.8/5

Nursing care per resident

Info This shows how many total hours of nursing staff time are available per resident each day. Higher numbers usually mean more staff support.
3h 14m per day

This home provides 13% less nursing time per resident than the Virginia average.

Virginia average: 3h 45m per day

Staffing hours breakdown

Info Hours of care per resident per day, broken down by staff type. Data from CMS Medicare.
Staff type Facility State avg National avg
Registered Nurse (RN) Info Registered nurse hours per resident per day. 23m per day 41m per day 41m per day
Nurse Aide Info Nurse aide hours per resident per day. 2h 5m per day 2h 8m per day 2h 21m per day
Total Nursing (Weekend) Info Total number of nurse staff hours per resident per day on weekends. 2h 57m per day 3h 19m per day 3h 26m per day
Physical Therapist Info Physical therapist staff hours per resident per day. 2m per day 5m per day 4m per day
RN (Weekend) Info Registered nurse hours per resident per day on weekends. 16m per day 28m per day 29m per day

Capacity and availability

Medium-capacity home

Offers a balance of services and community atmosphere.

Total beds 120

This home usually has limited availability

Occupancy is moderate, suggesting balanced demand.

Similar demand to the Virginia average
Occupancy rate 90.5%
Residents per day (avg) 112
Occupancy rate
90.5%
Residents per day (avg)
112

Who this home usually serves

TYPE OF STAY

Primarily short stays

Residents typically stay for brief periods, with frequent admissions and discharges throughout the year.

Might be optimal for
Post-acute recovery Temporary care Transitional stays

Breakdown by payment type

Medicare

12% of new residents, usually for short-term rehab.

Typical stay 23 days

Private pay

82% of new residents, often for short stays.

Typical stay 4 - 5 months

Medicaid

6% of new residents, often for long-term daily care.

Typical stay 3 - 4 months

Finances and operations

Privately-owned community
Operated by a business corporation.
Home revenue
$11.0M
Profit
$529.2K
Privately-owned community Operated by a business corporation.
Home revenue
$10,958,142.00
Profit
$529,218.00
Payroll costs Info The portion of the home's budget spent on staff, including nurses, caregivers, and other employees who support care and operations.
$5.8M
53.1% of revenue
Other operating costs Info All remaining costs needed to run the home, such as food, utilities, building maintenance, supplies and administrative expenses.
$4.6M
Total costs $10.4M
Walk Score
Walk Score: 56 / 100
Moderately walkable. Some errands can be accomplished on foot, with a mix of nearby amenities.

About this community

Additional licensing details

Awards: 2020 Quality Initiative Recognition Program from the American Health Care Association (AHCA)

Care Services

Nursing Services
Rehabilitation Services
Respite Care
Memory Care
Skilled Nursing
Licensed Nurses/CNAs
24-Hour Staffing
Short-Term Rehab

All Levels of Care

Skilled Nursing
Rehabilitation
Long Term Care
Assisted Living
Memory Care
Personal Care

Programs & Activities

Specific Programs
Physical Therapy, Occupational Therapy, Speech Therapy, Short-Term Care, Long-Term Care, Hospice Care, Respite Care, 24-hour Skilled Nursing Care

Types of Care at Autumn Care of Norfolk

Nursing Home Assisted Living Memory Care
Contact Autumn Care of Norfolk

Health Inspection History

Inspections
Total health inspections 3

Virginia average 4.2


Last Health inspection on Jan 2023

Total health citations 43

Virginia average 38.4

Citations per inspection
14.33

Virginia average 8.93


Health citations are formal notices following inspections when they fail to comply with safety and care standards.

38 of 43 citations resulted from standard inspections; and 5 of 43 came from combined inspections (standard and complaint).

Breakdown of citation severity (last 3 years)
Critical Health citations More info 0
100% better than Virginia average

Virginia average: 0.4


Serious Health citations More info 0
100% better than Virginia average

Virginia average: 1

0 critical citations More info Virginia average: 0.4

0 serious citations More info Virginia average: 1

43 moderate citations More info Virginia average: 36.3

0 minor citations More info Virginia average: 0.8
Citations history (last 3 years)
Infection Control moderate citation Info Issues related to preventing and controlling infections, including hygiene practices and safety protocols. Jan 13, 2023
Corrected

Pharmacy moderate citation Info Issues related to medication management, including how drugs are stored, administered, and monitored. Jan 13, 2023
Corrected

Pharmacy moderate citation Info Issues related to medication management, including how drugs are stored, administered, and monitored. Jan 13, 2023
Corrected

Pharmacy moderate citation Info Issues related to medication management, including how drugs are stored, administered, and monitored. Jan 13, 2023
Corrected

Compare Nursing Homes around Norfolk The information below is reported by the Virginia Department of Social Services and Department of Health.

5 facilities compared · CMS & VA Dept. of Health data · Updated Apr 2026

Autumn Care of Norfolk
NH

Nursing Home Licensed facility providing 24/7 skilled nursing care for residents with complex, ongoing medical needs. Staffed by RNs, LPNs, and CNAs. Inspected and star-rated annually by CMS. Accepts Medicare (short-term rehab) and Medicaid (long-term care).

AL

Assisted Living A licensed, long-term care setting for seniors or individuals with disabilities who need help with daily activities — like bathing, dressing, and medication management — but not 24-hour skilled nursing. Offers housing, meals, and around-the-clock support while aiming to maximize resident independence.

Norfolk (Foxhall)
120
90.5%
+6%
3.24
-46%
-13%
0
43
0
112
56
Soper, Celia
$11,0M
$5,8M
53.1%
495253
Studio / 1 Bed / 2 Bed
Ruxton Health of Norfolk
NH

Nursing Home Licensed facility providing 24/7 skilled nursing care for residents with complex, ongoing medical needs. Staffed by RNs, LPNs, and CNAs. Inspected and star-rated annually by CMS. Accepts Medicare (short-term rehab) and Medicaid (long-term care).

AL

Assisted Living A licensed, long-term care setting for seniors or individuals with disabilities who need help with daily activities — like bathing, dressing, and medication management — but not 24-hour skilled nursing. Offers housing, meals, and around-the-clock support while aiming to maximize resident independence.

Norfolk (Greenhill Farms)
60
90.8%
+6%
3.27
-38%
-13%
0
46
1
50
39
Marshall-Hodges, Kelli
$7,2M
$3,7M
51.1%
495309
Studio / 1 Bed
Signature Healthcare of Norfolk
NH

Nursing Home Licensed facility providing 24/7 skilled nursing care for residents with complex, ongoing medical needs. Staffed by RNs, LPNs, and CNAs. Inspected and star-rated annually by CMS. Accepts Medicare (short-term rehab) and Medicaid (long-term care).

AL

Assisted Living A licensed, long-term care setting for seniors or individuals with disabilities who need help with daily activities — like bathing, dressing, and medication management — but not 24-hour skilled nursing. Offers housing, meals, and around-the-clock support while aiming to maximize resident independence.

Norfolk (Ghent)
169
81.0%
-6%
3.39
-18%
-9%
0
47
3
156
88
Drake, Cie
$21,4M
$5,2M
24.4%
495068
Studio / 1 Bed
Consulate Health Care of Norfolk
NH

Nursing Home Licensed facility providing 24/7 skilled nursing care for residents with complex, ongoing medical needs. Staffed by RNs, LPNs, and CNAs. Inspected and star-rated annually by CMS. Accepts Medicare (short-term rehab) and Medicaid (long-term care).

AL

Assisted Living A licensed, long-term care setting for seniors or individuals with disabilities who need help with daily activities — like bathing, dressing, and medication management — but not 24-hour skilled nursing. Offers housing, meals, and around-the-clock support while aiming to maximize resident independence.

Norfolk (Colonial Place)
222
87.3%
+2%
3.32
-52%
-11%
1
54
3
193
77
Hajimomenian, Amir
$24,1M
$7,1M
29.7%
495273
Studio / 1 Bed
Lafayette Villa Nursing Home
-
NH

Nursing Home Licensed facility providing 24/7 skilled nursing care for residents with complex, ongoing medical needs. Staffed by RNs, LPNs, and CNAs. Inspected and star-rated annually by CMS. Accepts Medicare (short-term rehab) and Medicaid (long-term care).

AL

Assisted Living A licensed, long-term care setting for seniors or individuals with disabilities who need help with daily activities — like bathing, dressing, and medication management — but not 24-hour skilled nursing. Offers housing, meals, and around-the-clock support while aiming to maximize resident independence.

Norfolk (Colonial Place)
-
-
-
-
-
-
-
-
-
0
0
0
-
75
-
-
-
-
-
Studio / 1 Bed

Places of interest near Autumn Care of Norfolk

Address 4.7 miles from city center — 1.14 miles to nearest hospital (Lake Taylor Transitional Care Hospital)

Address 1401 Halstead Ave, Norfolk, VA 23502

Calculate Travel Distance to Autumn Care of Norfolk

Add your location

Address

Staffing Data (Q2 2025)

This data corresponds to Q2 2025 and is based on CMS Payroll-Based Journal.

Total staff 119
Employees 78
Contractors 41
Staff to resident ratio 1.12:1
33% worse than Virginia average

Virginia average ratio: 1.67:1

Avg staff/day 47
Average shift 8.4 hours
5% better than Virginia average

Virginia average: 8 hours

Total staff hours (quarter) 35,826
Nursing staff breakdown
Registered Nurse

Manages medical care and health needs.

Total count 6
Average shift length Info Average shift length. Calculated as total hours divided by days worked and average staff per day. 9.8 hours

No contractors work on this role.

Licensed Practical Nurse

Assists with medical care and medications.

Total count 19
Average shift length Info Average shift length. Calculated as total hours divided by days worked and average staff per day. 10.3 hours

This role is partially covered by contractors.

Certified Nursing Assistant

Helps with daily care and mobility.

Total count 59
Average shift length Info Average shift length. Calculated as total hours divided by days worked and average staff per day. 8.3 hours

This role is partially covered by contractors.

Contractor staffing

Total hours from contractors

12.7%

4,541 contractor hours this quarter

Certified Nursing Assistant: 15 Occupational Therapy Assistant: 8 Licensed Practical Nurse: 3 Physical Therapy Assistant: 3 Respiratory Therapy Technician: 3 Clinical Nurse Specialist: 2 Occupational Therapy Aide: 2 Physical Therapy Aide: 1 Speech Language Pathologist: 1 Qualified Social Worker: 1 Medical Director: 1 RN Director of Nursing: 1
Staff by category
Certified Nursing Assistant44155918,87591100%8.3
Licensed Practical Nurse163198,56791100%10.3
Registered Nurse6062,65391100%9.8
Clinical Nurse Specialist3251,2916875%8.2
Other Dietary Services Staff3035636470%7.7
Nurse Practitioner1015126470%8
Physical Therapy Aide0115126571%7.9
Dietitian1014926369%7.8
Administrator1014645864%8
Physical Therapy Assistant0334266268%6.7
Occupational Therapy Aide1233784549%8.1
Speech Language Pathologist0113286167%5.4
Respiratory Therapy Technician0332393842%6.3
Dental Services Staff1011672224%7.6
Nurse Aide in Training1011582224%7.2
Qualified Social Worker0111145560%2.1
Occupational Therapy Assistant088534044%1.3
Medical Director011242932%0.8
RN Director of Nursing0111322%6.3
59 Certified Nursing Assistant
% of Days 100%
19 Licensed Practical Nurse
% of Days 100%
6 Registered Nurse
% of Days 100%
5 Clinical Nurse Specialist
% of Days 75%
3 Other Dietary Services Staff
% of Days 70%
1 Nurse Practitioner
% of Days 70%
1 Physical Therapy Aide
% of Days 71%
1 Dietitian
% of Days 69%
1 Administrator
% of Days 64%
3 Physical Therapy Assistant
% of Days 68%
3 Occupational Therapy Aide
% of Days 49%
1 Speech Language Pathologist
% of Days 67%
3 Respiratory Therapy Technician
% of Days 42%
1 Dental Services Staff
% of Days 24%
1 Nurse Aide in Training
% of Days 24%
1 Qualified Social Worker
% of Days 60%
8 Occupational Therapy Assistant
% of Days 44%
1 Medical Director
% of Days 32%
1 RN Director of Nursing
% of Days 2%

Facility Characteristics

Source: CMS Long-Term Care Facility Characteristics (Data as of Jan 2026)

Total census
106 residents
Residents by payment source
Medicare
8 residents (7.5%)
Medicaid
70 residents (66%)
Private pay or other
28 residents (26.4%)
Programs & Services
Residents' Group

Residents meet regularly to discuss policies, care quality, and activities

Active Resident Council

Organized group of residents that meets regularly to discuss facility policies, quality of life, and activities.

Quality of care over time

These measures show how residents usually do over time at this home, based on health outcomes and preventive care.

High-risk clinical events score Info A composite score based on pressure ulcers, falls with injury, weight loss, walking ability decline, and activities of daily living decline. 9.4
7% better than Virginia average

Virginia average: 10.1

Functional decline score Info A composite score based on activities of daily living decline, walking ability decline, and incontinence. 20.2
In line with Virginia average

Virginia average: 19.7

Long-stay resident measures
Significantly above average Virginia avg: 4.3 Info CMS star rating based on long-stay quality measure performance. 5 stars = significantly above average, 1 star = significantly below average.
Need for Help with Daily Activities Increased Info Percent of long-stay residents whose need for help with daily activities has increased 20.8%
23% worse than Virginia average

Virginia average: 16.8%

Walking Ability Worsened Info Percent of long-stay residents whose ability to move independently worsened 15.6%
21% better than Virginia average

Virginia average: 19.7%

Low Risk Residents with Bowel/Bladder Incontinence Info Percent of low risk long-stay residents who lose control of their bowels or bladder 24.2%
7% worse than Virginia average

Virginia average: 22.6%

Falls with Major Injury Info Percent of long-stay residents experiencing one or more falls with major injury 2.3%
37% better than Virginia average

Virginia average: 3.6%

High Risk Residents with Pressure Ulcers Info Percent of long-stay high risk residents with pressure ulcers 4.7%
13% better than Virginia average

Virginia average: 5.4%

Urinary Tract Infection Info Percent of long-stay residents with a urinary tract infection 0.0%
100% better than Virginia average

Virginia average: 1.5%

Lost Too Much Weight Info Percent of long-stay residents who lose too much weight 3.7%
38% better than Virginia average

Virginia average: 5.9%

Depressive Symptoms Info Percent of long-stay residents who have depressive symptoms 10.6%
29% better than Virginia average

Virginia average: 14.9%

Antipsychotic Use Info Percent of long-stay residents who received an antipsychotic medication 7.1%
45% better than Virginia average

Virginia average: 12.9%

Pneumococcal Vaccine Info Percent of long-stay residents assessed and appropriately given the pneumococcal vaccine 17.1%
81% worse than Virginia average

Virginia average: 91.3%

Influenza Vaccine Info Percent of long-stay residents assessed and appropriately given the seasonal influenza vaccine 91.4%
In line with Virginia average

Virginia average: 94.0%

Short-stay resident measures
Significantly above average Virginia avg: 4.0 Info CMS star rating based on short-stay quality measure performance. 5 stars = much above average, 1 star = much below average.
Pneumococcal Vaccine Info Percent of short-stay residents assessed and appropriately given the pneumococcal vaccine 10.8%
86% worse than Virginia average

Virginia average: 74.9%

Antipsychotic medication increase Info Percent of short-stay residents who newly received an antipsychotic medication 0.8%
38% better than Virginia average

Virginia average: 1.2%

Influenza Vaccine Info Percent of short-stay residents assessed and appropriately given the seasonal influenza vaccine 57.0%
23% worse than Virginia average

Virginia average: 73.6%

Re-hospitalized after SNF stay Info Percentage of short-stay residents who were re-hospitalized after their nursing home admission. 19.5%
11% better than Virginia average

Virginia average: 22.0%

Emergency department visits Info Percentage of short-stay residents who had an outpatient emergency department visit. 5.3%
55% better than Virginia average

Virginia average: 11.7%

Falls with major injury Info Percentage of SNF residents who experience falls with major injury during their stay. 0.0%
100% better than Virginia average

Virginia average: 0.8%

Ability to care for self at discharge Info Percentage of residents at or above expected ability to care for themselves at discharge. 66.7%
24% better than Virginia average

Virginia average: 53.7%

Successful return to home or community Info Rate of successful return to home or community from a skilled nursing facility. 54.0%
7% better than Virginia average

Virginia average: 50.6%

Guides for Better Senior Living

Care Cost Calculator: See Prices in Your Area

Nursing Home Data Explorer

Don’t Wait Too Long: 7 Red Flag Signs Your Parent Needs Assisted Living Now

The True Cost of Assisted Living in 2025 – And How Families Are Paying For It

Understanding Senior Living Costs: Pricing Models, Discounts & Financial Assistance

Financial Aid for Virginia Seniors

Get financial aid guidance

Commonwealth Coordinated Care Plus (CCC Plus)

VA Medicaid CCC Plus

Age 65+ or disabled, Virginia resident, Medicaid-eligible, nursing home-level care need.

~$2,829/month (300% FBR, individual).

$2,000 (individual), $3,000 (couple).

Managed care model; high demand in urban areas.

Virginia Respite Care Grant Program

VA Respite Grant

Caregiver of someone 60+, Virginia resident.

~$2,500/month (individual, varies).

$40,000 (individual).

Limited grants; rural/urban balance.

Adult Services Program

Virginia Adult Services (AS)

Age 60+ (or disabled 18+), VA resident, need significant care (2+ ADLs), not Medicaid-eligible.

Varies by locality; typically < ~$2,510/month (200% FPL).

Limited assets (excludes home, car); varies by DSS.

Serves ~5,000 annually; focuses on low-income independence.

Auxiliary Grant Program

Virginia Auxiliary Grant (AG)

Age 65+ (or disabled 18+), VA resident, living in approved ALF/foster care, SSI-eligible or low-income.

~$1,041/month (individual, SSI level + $20 disregard); higher with medical deductions.

$2,000 (individual).

Serves 4,000; personal needs allowance ($90/month).

Medicare Savings Program (MSP)

Virginia Medicare Savings Program

Age 65+ or disabled, VA resident, Medicare Part A/B.

~$2,510/month (QMB), ~$3,380/month (SLMB), ~$3,598/month (QI)—individual.

$9,430 (individual), $14,130 (couple).

Includes Extra Help for Part D; no waitlist.

Energy Assistance Program (EAP)

Virginia Energy Assistance Program

Age 60+ prioritized, VA resident, low-income household.

~$3,970/month (185% FPL).

Not assessed.

Fuel, Crisis, Cooling components; serves ~100,000 households.

Senior Community Service Employment Program (SCSEP)

Virginia SCSEP

Age 55+, unemployed, low-income, VA resident.

~$1,983/month (125% FPL).

Not specified.

Priority for veterans, rural residents; AARP/Goodwill partnership.

VA Aid and Attendance (A&A) and Housebound Benefits

Virginia VA Aid and Attendance/Housebound

Age 65+ or disabled veteran/spouse, VA resident, wartime service, ADL help (A&A) or homebound.

Net income < ~$1,984/month (veteran with dependent, A&A); pension offsets income.

~$155,356 (net worth).

High veteran population; supports rural/urban needs.

Property Tax Relief for the Elderly and Disabled

Virginia Property Tax Relief

Age 65+ or disabled, VA resident, homeowner, income/asset limits vary by locality.

~$50,000-$75,000/year (household, e.g., Fairfax: $72,000; Richmond: $50,000).

Varies (e.g., Fairfax: $400,000 net worth; Richmond: $100,000).

Offered in 90% of localities; saves ~$500-$2,000/year.

Senior Farmers’ Market Nutrition Program (SFMNP)

Virginia SFMNP

Age 60+, VA resident, low-income.

~$2,322/month (185% FPL).

Not assessed.

Vouchers (~$50-$75/season); serves ~15,000 via AAAs.

Tour Icon
Planning a tour? Check our touring checklist.
Chat Icon
Thinking of living here? We can help you speak to a current resident