Consulate Health Care of Norfolk
Nursing Home, Assisted Living, Independent Living & Memory Care · Norfolk, VA
CMS overall rating Info The Overall CMS Rating is scored from 1 to 5 stars and combines results from health inspections, staffing levels, and quality measures. Health inspections carry the most weight. Staffing and quality scores can increase or decrease the final rating based on performance compared to state and national standards.

Consulate Health Care of Norfolk

Nursing Home, Assisted Living, Independent Living & Memory Care · Norfolk, VA
CMS overall rating Info The Overall CMS Rating is scored from 1 to 5 stars and combines results from health inspections, staffing levels, and quality measures. Health inspections carry the most weight. Staffing and quality scores can increase or decrease the final rating based on performance compared to state and national standards.
Calculator: See prices in your area
Consulate Health Care of Norfolk accepts Medicare, Medicaid, and private pay.

Overview of Consulate Health Care of Norfolk

Consulate Health Care of Norfolk is a distinguished facility, boasting a substantial capacity of 222 beds for skilled nursing that aligns perfectly with nursing home requirements. Within this establishment, a strong sense of community is evident, fostering a supportive and caring environment. Their expertise extends to a wide spectrum of services, including short-term rehabilitation and long-term care. These services encompass physical, occupational, and speech therapies, ensuring a holistic approach to care.

Furthermore, Consulate Health Care of Norfolk excels as a memory care center. Their specialization also extends to the care of medically complex patients, supported by a comprehensive discharge planning program and post-acute care services. The patient care experience at this facility is exceptional, marked by a profound commitment to compassion and an unwavering dedication to exceeding expectations.

(757) 625-5363

Quality ratings

Measured by Centers for Medicare & Medicaid Services (CMS)

Overall rating Info The Overall CMS Rating combines results from health inspections, staffing levels and quality measures. Health inspections carry the most weight. Staffing and quality scores can increase or decrease the final rating based on performance compared to state and national standards.
▼ 73.8% Below VA avg. ▼ 73.8% Below VA avg.Click the badge to see the full State ranking.Click here to see the full State ranking.
Health Inspection Info Based on the results of the facility's three most recent standard inspections and any complaint investigations. CMS reviews the number, scope, and severity of deficiencies, with more recent findings weighted more heavily.
▼ 70.1% Below VA avg. ▼ 70.1% Below VA avg.Click the badge to see the full State ranking.Click here to see the full State ranking.
Staffing Info Measures average nursing staff hours per resident per day, including Registered Nurses (RNs) and total nursing staff. Ratings are adjusted based on the level of care residents require and are compared to state and national benchmarks.
▼ 72.3% Below VA avg. ▼ 72.3% Below VA avg.Click the badge to see the full State ranking.Click here to see the full State ranking.
Quality Measures Info Based on clinical and physical health indicators reported to CMS, such as hospital readmissions, falls, pressure ulcers, and improvements in mobility. These measures reflect how well residents' health needs are being managed.
At VA avg. At VA avg.Click the badge to see the full State ranking.Click here to see the full State ranking.

Staffing hours breakdown

Info Daily nursing hours per resident by staff type, reported to CMS. Higher is generally better — compare this facility to state and national averages to see where staffing stands.

Hours per resident per day — compared to Virginia state averages

Total nursing care / resident Info This home is ranked 47th out of 63 homes in Virginia. Total adjusted nursing hours per resident per day, combining RN, LPN, and aide time. CMS adjusts this for case-mix so facilities can be fairly compared.
3h 19m per day
Rank #47 / 63Nurse hours — State benchmarkedThis home is ranked 47th out of 63 homes in Virginia. Shows adjusted nurse hours per resident per day benchmarked to the Virginia average, with a ranking across 63 Virginia SNFs. More hours mean more direct care. The national average is about 3.5 hrs; below 3.0 is a red flag.Click the rank badge to see the full State ranking.Click here to see the full State ranking.
This facility Virginia avg (4h 47m per day)
vs Virginia avg
-31%

6 of 6 metrics below state avg

Staff typeHours / Day / Residentvs state avg
Registered Nurse (RN) Info RNs hold the highest nursing license and can assess residents, interpret test results, and direct care plans. More RN hours per day often signals stronger clinical oversight and faster response to health changes. 17m per day ▼ 59% State avg: 41m per day · National avg: 41m per day
LPN / LVN Info Licensed Practical Nurses (LPNs) or Licensed Vocational Nurses (LVNs) deliver routine hands-on care — medication administration, wound dressing, and monitoring vital signs. They work under RN supervision and make up a large share of daily bedside care. 46m per day ▼ 23% State avg: 1h 0m per day · National avg: 52m per day
Nurse Aide Info Certified Nurse Aides (CNAs) provide the most direct day-to-day assistance: bathing, dressing, feeding, and mobility. Nurse aide hours are typically the largest staffing category and directly affect residents' quality of life. 1h 39m per day ▼ 23% State avg: 2h 8m per day · National avg: 2h 21m per day
Total Nursing (Weekend) Info Combined nursing hours (RN + LPN + Nurse Aide) per resident per day on weekends. Staffing often drops on weekends — this figure reveals whether the facility maintains adequate coverage outside of weekday hours. 2h 5m per day ▼ 37% State avg: 3h 19m per day · National avg: 3h 26m per day
Physical Therapist Info Hours per resident per day provided by licensed Physical Therapists (PTs) or PT Assistants. PT services help residents recover mobility after injury or illness and are especially important for post-acute (short-stay) rehabilitation. 1m per day ▼ 80% State avg: 5m per day · National avg: 4m per day
RN (Weekend) Info Registered nurse hours specifically on weekends. Facilities sometimes reduce RN presence on Saturdays and Sundays — a low weekend RN figure compared to weekday hours can indicate reduced clinical oversight when most administrative staff are absent. 9m per day ▼ 68% State avg: 28m per day · National avg: 29m per day

Types of Care at Consulate Health Care of Norfolk

Assisted Living Independent Living Memory Care Nursing Home

Capacity and availability

This home usually has limited availability

Occupancy between 85% and 95% suggests balanced demand.

Higher occupancy than the Virginia average: 85.7%
Occupancy rate 87.3% Rank #25 / 66Occupancy rate — State benchmarkedThis home is ranked 25th out of 66 homes in Virginia. Shows this facility's occupancy rate versus the Virginia average, with its Statewide rank out of 66. Higher occupancy signals strong local demand and financial stability.Click the rank badge to see the full State ranking.Click here to see the full State ranking.
Avg. Length of Stay 216 days
Occupancy rate
87.3% Rank #25 / 66Occupancy rate — State benchmarkedThis home is ranked 25th out of 66 homes in Virginia. Shows this facility's occupancy rate versus the Virginia average, with its Statewide rank out of 66. Higher occupancy signals strong local demand and financial stability.Click the rank badge to see the full State ranking.Click here to see the full State ranking.
Avg. Length of Stay
216 days
Walk Score
Walk Score: 77 / 100 Rank #9 / 66Walk Score — State benchmarkedThis home is ranked 9th out of 66 homes in Virginia. Shows how walkable this facility's neighborhood is compared to the average Walk Score across Virginia SNFs. Higher scores benefit residents, families, and staff.Click the rank badge to see the full State ranking.Click here to see the full State ranking.
Very walkable. Most errands can be accomplished on foot, and many essentials are within a short walk.

License Details

CMS Certification Number495273

Contact Consulate Health Care of Norfolk

Inspection History

In Virginia, the Department of Social Services (for assisted living facilities) and the Department of Health (for nursing homes) perform the inspections required to maintain state and federal licensing.

Since 2017 · 9 years of data 49 deficiencies 5 inspections

Inspection Scorecard Info This scorecard compares key inspection, citation, and complaint metrics at this facility against the Virginia state average. Metrics rated ≥15% worse than average are highlighted in red; those ≥15% better are highlighted in green.

Since 2017 vs. Virginia state average
Overall vs. VA average 3 Worse Metrics worse than Virginia average:
• Total deficiencies (53% above)
• Deficiencies per year (50% above)
• Deficiencies per inspection (326% above)
1 Better Metrics better than Virginia average:
• Total inspections (64% below)
Latest Inspection July 16, 2024 Routine

Deficiencies Info Deficiencies are formal regulatory issues recorded during state inspections.

This FacilityVA Averagevs. VA Avg
Total deficiencies Info Formal regulatory issues recorded by inspectors across all inspection types. 4932 This facility has 53% more total deficiencies than a typical Virginia nursing home (49 vs. VA avg 32).↑ 53% worse
Deficiencies per year Info Average deficiencies per year since 2017. 5.43.6 This facility has 50% more deficiencies per year than a typical Virginia nursing home (5.4 vs. VA avg 3.6).↑ 50% worse
Deficiencies per inspection Info Average deficiencies per inspection. 9.82.3 This facility has 326% more deficiencies per inspection than a typical Virginia nursing home (9.8 vs. VA avg 2.3).↑ 326% worse

Inspections Info State inspections evaluate whether the facility meets health and safety standards.

This FacilityVA Averagevs. VA Avg
Total inspections Info Combined count of all routine and focused inspections. Excludes complaint investigations. 514 This facility has 64% fewer total inspections than a typical Virginia nursing home (5 vs. VA avg 14).↓ 64% better

Inspection Reports Summary Info An editor-reviewed summary of the themes and findings across this facility's recent inspection reports.

The most recent inspection on July 16, 2024, found deficiencies related to malfunctioning air conditioning and failure to follow a Do Not Resuscitate order for one resident. Earlier inspections showed a pattern of issues including unsafe smoking practices that led to immediate jeopardy in 2023, as well as multiple deficiencies in resident care, medication management, infection control, and facility maintenance dating back several years. Complaint investigations revealed substantiated problems with unsafe smoking supervision and residents’ rights, while enforcement actions included abatement of immediate jeopardy but no fines or license suspensions were listed in the available reports. The main themes across inspections involved environmental safety, resident care planning, and medication management. The facility’s record shows ongoing challenges with compliance, with some corrective actions taken but recurring issues noted over time.

Read the full inspection reports for this facility, including detailed findings and corrective actions.

Show Inspection Reports

Health Inspection History

Inspections Since 2017
Total health inspections 5

Virginia average 4.2


Last Health inspection on Jul 2024
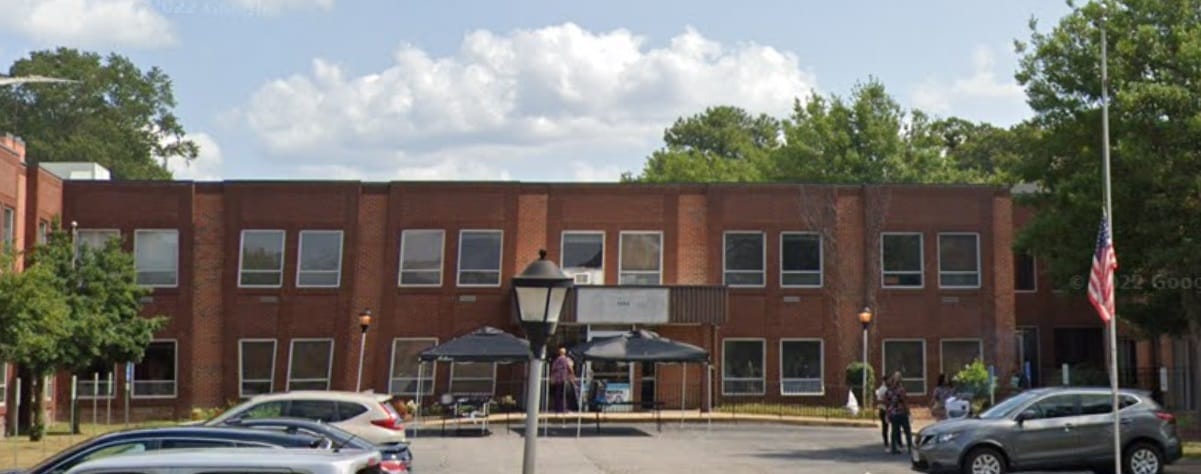
Total health citations
54 Rank #54 / 64Health citations — State benchmarkedThis home is ranked 54th out of 64 homes in Virginia. Shows this facility's total health deficiency citations benchmarked to the Virginia State average, with a ranking across all 64 VA SNFs. Lower citation counts earn a better rank.Click the rank badge to see the full State ranking.Click here to see the full State ranking.

Virginia average 38.4

Citations per inspection
10.8 Rank #43 / 64Citations per inspection — State benchmarkedThis home is ranked 43rd out of 64 homes in Virginia. Shows average deficiency citations per CMS inspection for this facility versus the Virginia mean across 64 SNFs with citation data. Lower is better.Click the rank badge to see the full State ranking.Click here to see the full State ranking.

Virginia average 8.93


Health citations are formal notices following inspections when they fail to comply with safety and care standards.

45 of 54 citations resulted from standard inspections; and 9 of 54 resulted from complaint investigations.

Breakdown of citation severity (last 9 years)
Critical Health citations
1
150% worse than Virginia average

Virginia average: 0.4


Serious Health citations
2 Rank #10 / 27Serious citations (G–I) — State benchmarkedThis home is ranked 10th out of 27 homes in Virginia. Shows G–I scope serious health citations for this facility versus other Virginia SNFs. Lower counts rank better.Click the rank badge to see the full State ranking.Click here to see the full State ranking.
100% worse than Virginia average

Virginia average: 1

1 critical citation Virginia average: 0.4

2 serious citations Virginia average: 1

49 moderate citations Virginia average: 36.3

2 minor citations Virginia average: 0.8
Citations history (last 9 years)
Environmental moderate citation Jul 19, 2024
Corrected

Quality of Care moderate citation Jul 19, 2024
Corrected

Resident Rights moderate citation Jul 19, 2024
Corrected

Administration moderate citation Mar 07, 2023
Corrected

Staffing Data

Reporting period: April 1 – June 30, 2025 (Q2 2025). Source: CMS Payroll-Based Journal report.

Total staff 252
Employees 234
Contractors 18
Staff to resident ratio 1.29:1
22% worse than Virginia average
Virginia average ratio: 1.67:1 Virginia average ratio: 1.67:1See full Virginia ranking
Avg staff/day 67
Average shift 8.3 hours
0% compared with Virginia average
Virginia average: 8 hours Virginia average shift: 8 hoursSee full Virginia ranking
Total staff hours (quarter) 50,652

Nursing staff breakdown

Q2 2025 · Apr 1 – Jun 30 More info This data comes from the CMS Payroll-Based Journal report covering April 1 – June 30, 2025.
Registered Nurse

Manages medical care and health needs.

Total count 11
Average shift length Info Average shift length. Calculated as total hours divided by days worked and average staff per day. 9.6 hours

No contractors work on this role.

Licensed Practical Nurse

Assists with medical care and medications.

Total count 50
Average shift length Info Average shift length. Calculated as total hours divided by days worked and average staff per day. 8.8 hours

No contractors work on this role.

Certified Nursing Assistant

Helps with daily care and mobility.

Total count 142
Average shift length Info Average shift length. Calculated as total hours divided by days worked and average staff per day. 8.5 hours

No contractors work on this role.

Contractor staffing

Q2 2025 · Apr 1 – Jun 30 More info This data comes from the CMS Payroll-Based Journal report covering April 1 – June 30, 2025.

Total hours from contractors

3.4%

1,737 contractor hours this quarter

Respiratory Therapy Technician: 3 Qualified Social Worker: 3 Occupational Therapy Aide: 3 Speech Language Pathologist: 2 Physical Therapy Assistant: 2 Medical Director: 2 Physical Therapy Aide: 2 Occupational Therapy Assistant: 1

Staff by category

Q2 2025 · Apr 1 – Jun 30 More info This data comes from the CMS Payroll-Based Journal report covering April 1 – June 30, 2025.
Certified Nursing Assistant142014228,43291100%8.5
Licensed Practical Nurse5005010,73591100%8.8
Registered Nurse110112,75891100%9.6
Clinical Nurse Specialist7071,5258088%7.8
Other Dietary Services Staff6061,29491100%6.8
Dental Services Staff4041,2387178%9.4
RN Director of Nursing4048988391%7.8
Mental Health Service Worker3035685965%8
Respiratory Therapy Technician0335224651%7
Nurse Practitioner3035126369%8.1
Dietitian2025006369%7.9
Administrator2024565763%8
Speech Language Pathologist0223384448%7.5
Physical Therapy Assistant0223354448%6.9
Qualified Social Worker0333294752%6.9
Occupational Therapy Aide033811415%4.5
Physical Therapy Aide022761618%4.7
Medical Director022376571%0.6
Occupational Therapy Assistant011191314%1.4
142 Certified Nursing Assistant
% of Days 100%
50 Licensed Practical Nurse
% of Days 100%
11 Registered Nurse
% of Days 100%
7 Clinical Nurse Specialist
% of Days 88%
6 Other Dietary Services Staff
% of Days 100%
4 Dental Services Staff
% of Days 78%
4 RN Director of Nursing
% of Days 91%
3 Mental Health Service Worker
% of Days 65%
3 Respiratory Therapy Technician
% of Days 51%
3 Nurse Practitioner
% of Days 69%
2 Dietitian
% of Days 69%
2 Administrator
% of Days 63%
2 Speech Language Pathologist
% of Days 48%
2 Physical Therapy Assistant
% of Days 48%
3 Qualified Social Worker
% of Days 52%
3 Occupational Therapy Aide
% of Days 15%
2 Physical Therapy Aide
% of Days 18%
2 Medical Director
% of Days 71%
1 Occupational Therapy Assistant
% of Days 14%

Penalties and fines

Federal penalties imposed by CMS for regulatory violations, including civil money penalties (fines) and denials of payment for new Medicare/Medicaid admissions.

Source: CMS Penalties Database (Data as of Jan 2026)

Total fines amount $13K Rank #60 / 67Federal fines — State benchmarkedThis home is ranked 60th out of 67 homes in Virginia. Shows this facility's cumulative CMS federal fine dollars versus the Virginia average among facilities with fines, and where it ranks among 67 skilled nursing facilities in the pool. Lower total dollars mean a better rank.Click the rank badge to see the full State ranking.Click here to see the full State ranking.
74% lower than Virginia average

Virginia average: $52K

Number of fines 1
43% fewer fines than Virginia average

Virginia average: 1.8

Payment Denials Info Serious action where Medicare and/or Medicaid temporarily stops payments for new residents until issues are fixed. 0
100% fewer payment denials than Virginia average

Virginia average: 0.1

Fines amount comparison
This facility $13K
Virginia average $52K

No penalties in the past 3 years

No civil money penalties or payment denials were reported in the last 3 years.

Quality of care over time

These measures show how residents usually do over time at this home, based on health outcomes and preventive care.

High-risk clinical events score Info A composite score based on pressure ulcers, falls with injury, weight loss, walking ability decline, and activities of daily living decline. 8.8
14% better than Virginia average

Virginia average: 10.1

Functional decline score Info A composite score based on activities of daily living decline, walking ability decline, and incontinence. 17.7
10% better than Virginia average

Virginia average: 19.7

Long-stay resident measures
Significantly above average Virginia avg: 3.9 Info CMS star rating based on long-stay quality measure performance. 5 stars = significantly above average, 1 star = significantly below average.
Need for Help with Daily Activities Increased Info Percent of long-stay residents whose need for help with daily activities has increased 14.0%
17% better than Virginia average

Virginia average: 16.8%

Walking Ability Worsened Info Percent of long-stay residents whose ability to move independently worsened 13.8%
30% better than Virginia average

Virginia average: 19.7%

Low Risk Residents with Bowel/Bladder Incontinence Info Percent of low risk long-stay residents who lose control of their bowels or bladder 25.3%
12% worse than Virginia average

Virginia average: 22.6%

Falls with Major Injury Info Percent of long-stay residents experiencing one or more falls with major injury 0.8%
77% better than Virginia average

Virginia average: 3.6%

High Risk Residents with Pressure Ulcers Info Percent of long-stay high risk residents with pressure ulcers 6.7%
24% worse than Virginia average

Virginia average: 5.4%

Urinary Tract Infection Info Percent of long-stay residents with a urinary tract infection 0.3%
82% better than Virginia average

Virginia average: 1.5%

Lost Too Much Weight Info Percent of long-stay residents who lose too much weight 8.5%
45% worse than Virginia average

Virginia average: 5.9%

Depressive Symptoms Info Percent of long-stay residents who have depressive symptoms 2.5%
83% better than Virginia average

Virginia average: 14.9%

Pneumococcal Vaccine Info Percent of long-stay residents assessed and appropriately given the pneumococcal vaccine 70.9%
22% worse than Virginia average

Virginia average: 91.3%

Influenza Vaccine Info Percent of long-stay residents assessed and appropriately given the seasonal influenza vaccine 86.4%
8% worse than Virginia average

Virginia average: 94.0%

Short-stay resident measures
Below average Virginia avg: 3.9 Info CMS star rating based on short-stay quality measure performance. 5 stars = much above average, 1 star = much below average.
Pneumococcal Vaccine Info Percent of short-stay residents assessed and appropriately given the pneumococcal vaccine 32.4%
57% worse than Virginia average

Virginia average: 74.9%

Antipsychotic medication increase Info Percent of short-stay residents who newly received an antipsychotic medication 2.2%
81% worse than Virginia average

Virginia average: 1.2%

Influenza Vaccine Info Percent of short-stay residents assessed and appropriately given the seasonal influenza vaccine 26.8%
64% worse than Virginia average

Virginia average: 73.6%

Re-hospitalized after SNF stay Info Percentage of short-stay residents who were re-hospitalized after their nursing home admission. 11.3%
49% better than Virginia average

Virginia average: 22.0%

Emergency department visits Info Percentage of short-stay residents who had an outpatient emergency department visit. 14.8%
26% worse than Virginia average

Virginia average: 11.7%

Falls with major injury Info Percentage of SNF residents who experience falls with major injury during their stay. 2.9%
282% worse than Virginia average

Virginia average: 0.8%

Ability to care for self at discharge Info Percentage of residents at or above expected ability to care for themselves at discharge. 35.0%
35% worse than Virginia average

Virginia average: 53.7%

Successful return to home or community Info Rate of successful return to home or community from a skilled nursing facility. 29.1%
42% worse than Virginia average

Virginia average: 50.6%

Breakdown by payment type

Medicare

3% of new residents, usually for short-term rehab.

Typical stay 3 - 4 months

Private pay

29% of new residents, often for short stays.

Typical stay 30 days

Medicaid

68% of new residents, often for long-term daily care.

Typical stay 9 - 10 months

Facility Characteristics

Source: CMS Long-Term Care Facility Characteristics (Data as of Jan 2026)

Total residents 195
Medicare
5
2.6% of residents
Medicaid
182
93.3% of residents
Private pay or other
8
4.1% of residents
Programs & Services
Residents Group

Residents meet regularly to discuss policies, care quality, and activities

Active Resident Council

Organized group of residents that meets regularly to discuss facility policies, quality of life, and activities.

Finances and operations

Privately-owned community
Operated by a business corporation.
Home revenue
$24.7M
Operating loss
-$415.4K
Privately-owned community Operated by a business corporation.
Home revenue
$24.7M Rank #35 / 63Revenue — State benchmarkedThis home is ranked 35th out of 63 homes in Virginia. Shows this facility's annual revenue compared to the Virginia SNF average. Higher revenue generally means more resources for staffing and capital — read alongside Payroll %.Click the rank badge to see the full State ranking.Click here to see the full State ranking.
Operating loss
-$415.4K
Payroll costs Info The portion of the home's budget spent on staff, including nurses, caregivers, and other employees who support care and operations. Rank #41 / 63Payroll — State benchmarkedThis home is ranked 41st out of 63 homes in Virginia. Shows total annual staff payroll benchmarked to the Virginia average. Higher payroll investment relative to peers often signals better staffing and less reliance on cheaper contract labor.Click the rank badge to see the full State ranking.Click here to see the full State ranking.
$8.0M
32.2% of revenue Rank #56 / 63Payroll % — State benchmarkedThis home is ranked 56th out of 63 homes in Virginia. Shows payroll as a percentage of revenue versus the Virginia average. Well-run Virginia SNFs typically land around 51–60% — the top third Statewide. Below 25% may signal understaffing or heavy agency use — read with Staffing ratings.Click the rank badge to see the full State ranking.Click here to see the full State ranking.
Other operating costs Info All remaining costs needed to run the home, such as food, utilities, building maintenance, supplies and administrative expenses.
$17.2M
Total costs $25.1M

Who this home usually serves

TYPE OF STAY

Mostly long-term care residents

Most residents stay for extended periods and receive ongoing daily care.

Places of interest near Consulate Health Care of Norfolk

Address 2.6 miles from city center Info Estimated distance in miles from Norfolk's city center to Consulate Health Care of Norfolk's address, calculated via Google Maps. — 1.72 miles to nearest hospital (Sentara Norfolk General Hospital -Advanced Heart Failure)

Calculate Travel Distance to Consulate Health Care of Norfolk

Add your location

Address

Financial Assistance for
Nursing Home in Virginia

Consulate Health Care of Norfolk is located in Norfolk, Virginia.
Here are the financial assistance programs available to residents in Virginia.

Get Financial aid guidance

Commonwealth Coordinated Care Plus (CCC Plus)

VA Medicaid CCC Plus

Age 65+ or disabled
General Virginia resident, Medicaid-eligible, nursing home-level care need.
Income Limits (2025) ~$2,829/month 300% FBR, individual
Asset Limits $2,000 (individual), $3,000 (couple).
VA

Managed care model; high demand in urban areas.

Benefits
Personal care (5-7 hours/day) Respite (240 hours/year) Adult day care ($65/day) Home modifications ($1,500 avg.)

Virginia Respite Care Grant Program

VA Respite Grant

Age Caregiver of someone 60+
General Virginia resident.
Income Limits ~$2,500/month individual, varies
Asset Limits $40,000 individual
VA

Limited grants; rural/urban balance.

Benefits
In-home respite (up to 30 days/year) Adult day care (~$65/day) Facility respite (up to 5 days)

Adult Services Program

Virginia Adult Services (AS)

Age 60+ (or disabled 18+)
General VA resident, need significant care (2+ ADLs), not Medicaid-eligible.
Income Limits (2025) Varies by locality; typically < ~$2,510/month 200% FPL
Asset Limits Limited assets (excludes home, car); varies by DSS.
VA

Serves ~5,000 annually; focuses on low-income independence.

Benefits
Personal care (4-6 hours/week) Adult day care (~$60/day) Chore services Assessments Respite (~5 days/year)

Auxiliary Grant Program

Virginia Auxiliary Grant (AG)

Age 65+ (or disabled 18+)
General VA resident, living in approved ALF/foster care, SSI-eligible or low-income.
Income Limits (2025) ~$1,041/month (individual, SSI level + $20 disregard); higher with medical deductions.
Asset Limits $2,000 individual
VA

Serves 4,000; personal needs allowance ($90/month).

Benefits
Cash (~$1,400-$1,700/month in 2025, varies by region) for ALF/foster care costs; basic care included

Medicare Savings Program (MSP)

Virginia Medicare Savings Program

Age 65+ or disabled
General VA resident, Medicare Part A/B.
Income Limits (2025) ~$2,510/month (QMB), ~$3,380/month (SLMB), ~$3,598/month (QI)—individual.
Asset Limits $9,430 (individual), $14,130 (couple).
VA

Includes Extra Help for Part D; no waitlist.

Benefits
Covers Part B premiums ($174.70/month) Deductibles ($240/year) Copays (~20%)

Energy Assistance Program (EAP)

Virginia Energy Assistance Program

Age 60+ prioritized
General VA resident, low-income household.
Income Limits (2025) ~$3,970/month 185% FPL
Asset Limits Not assessed.
VA

Fuel, Crisis, Cooling components; serves ~100,000 households.

Benefits
Heating/cooling aid ($300-$1,000/season) Crisis aid ($500 max) Equipment repair (~$250)

VA Aid and Attendance (A&A) and Housebound Benefits

Virginia VA Aid and Attendance/Housebound

Age 65+ or disabled veteran/spouse
General VA resident, wartime service, ADL help (A&A) or homebound.
Income Limits (2025) Net income < ~$1,984/month (veteran with dependent, A&A); pension offsets income.
Asset Limits ~$155,356 net worth
VA

High veteran population; supports rural/urban needs.

Benefits
Cash (~$1,433-$2,642/month veteran, ~$951-$1,318 spouse) for care costs

Property Tax Relief for the Elderly and Disabled

Virginia Property Tax Relief

Age 65+ or disabled
General VA resident, homeowner, income/asset limits vary by locality.
Income Limits (2025) ~$50,000-$75,000/year household, e.g., Fairfax: $72,000; Richmond: $50,000
Asset Limits Varies e.g., Fairfax: $400,000 net worth; Richmond: $100,000
VA

Offered in 90% of localities; saves ~$500-$2,000/year.

Benefits
Tax exemption/deferral (~$500-$2,000/year depending on locality)

Senior Farmers’ Market Nutrition Program (SFMNP)

Virginia SFMNP

Age 60+
General VA resident, low-income.
Income Limits (2025) ~$2,322/month 185% FPL
Asset Limits Not assessed.
VA

Vouchers (~$50-$75/season); serves ~15,000 via AAAs.

Benefits
Vouchers (~$50-$75/season) for produce at farmers’ markets

Compare Nursing Home around Norfolk

The information below is reported by the Virginia Department of Social Services and Department of Health.

4 facilities compared · CMS & VA Dept. of Health data

Filter by care type
Harbor‘s Edge
NH

Nursing Home Licensed facility providing 24/7 skilled nursing care for residents with complex, ongoing medical needs. Staffed by RNs, LPNs, and CNAs. Inspected and star-rated annually by CMS. Accepts Medicare (short-term rehab) and Medicaid (long-term care).

AL

Assisted Living A licensed, long-term care setting for seniors or individuals with disabilities who need help with daily activities — like bathing, dressing, and medication management — but not 24-hour skilled nursing. Offers housing, meals, and around-the-clock support while aiming to maximize resident independence.

IL

Independent Living Lifestyle-focused communities for older adults offering dining, activities, and transportation with minimal personal care. Best for active, independent seniors who want community without medical support.

MC

Memory Care Secured, specialized care for people living with Alzheimer's or dementia. Staff trained in cognitive impairment, with higher staff-to-resident ratios and an environment designed to reduce confusion and wandering risk.

Norfolk (Fort Norfolk)240 175.0% +104%6.62 -2%+77%$0205.0-31 46 Cathy L'heureux$39.5M$13.2M33.6%495395
Autumn Care of Norfolk
NH

Nursing Home Licensed facility providing 24/7 skilled nursing care for residents with complex, ongoing medical needs. Staffed by RNs, LPNs, and CNAs. Inspected and star-rated annually by CMS. Accepts Medicare (short-term rehab) and Medicaid (long-term care).

AL

Assisted Living A licensed, long-term care setting for seniors or individuals with disabilities who need help with daily activities — like bathing, dressing, and medication management — but not 24-hour skilled nursing. Offers housing, meals, and around-the-clock support while aiming to maximize resident independence.

Norfolk (Foxhall)120 90.5% +6%3.24 -46%-13%$04314.3-112 56 Celia Soper$11.0M$7.0M63.8%495253
Norview Heights Rehabilitation and Nursing
NH

Nursing Home Licensed facility providing 24/7 skilled nursing care for residents with complex, ongoing medical needs. Staffed by RNs, LPNs, and CNAs. Inspected and star-rated annually by CMS. Accepts Medicare (short-term rehab) and Medicaid (long-term care).

AL

Assisted Living A licensed, long-term care setting for seniors or individuals with disabilities who need help with daily activities — like bathing, dressing, and medication management — but not 24-hour skilled nursing. Offers housing, meals, and around-the-clock support while aiming to maximize resident independence.

IL

Independent Living Lifestyle-focused communities for older adults offering dining, activities, and transportation with minimal personal care. Best for active, independent seniors who want community without medical support.

RC

Respite Care Short-term temporary care — days to weeks — to give family caregivers a break. Full care provided during the stay. Often used after hospitalization or to trial a facility before a permanent placement decision.

Norfolk (Fairmont Park)60 90.8% +6%3.27 -38%-13%$0469.2150 30 Kelli Marshall-Hodges$7.2M$4.2M57.8%495309
Consulate Health Care of Norfolk
NH

Nursing Home Licensed facility providing 24/7 skilled nursing care for residents with complex, ongoing medical needs. Staffed by RNs, LPNs, and CNAs. Inspected and star-rated annually by CMS. Accepts Medicare (short-term rehab) and Medicaid (long-term care).

AL

Assisted Living A licensed, long-term care setting for seniors or individuals with disabilities who need help with daily activities — like bathing, dressing, and medication management — but not 24-hour skilled nursing. Offers housing, meals, and around-the-clock support while aiming to maximize resident independence.

Norfolk (Colonial Place)222 87.3% +2%3.32 -52%-11%$13.4k5410.83193 77 Amir Hajimomenian$24.7M$8.0M32.2%495273

Frequently Asked Questions about Consulate Health Care of Norfolk

What neighborhood is Consulate Health Care of Norfolk in?

Consulate Health Care of Norfolk is in the Colonial Place neighborhood of Norfolk.

Is Consulate Health Care of Norfolk in a walkable area?

Consulate Health Care of Norfolk has a walk score of 77. Very walkable. Most errands can be accomplished on foot, and many essentials are within a short walk.

What is the phone number of Consulate Health Care of Norfolk?

(757) 625-5363 will put you in contact with the team at Consulate Health Care of Norfolk.

Is Consulate Health Care of Norfolk Medicare or Medicaid certified?

Yes — Consulate Health Care of Norfolk is a CMS-certified provider of Medicare and Medicaid.

Guides for Better Senior Living

Care Cost Calculator: See Prices in Your Area

Nursing Home Data Explorer

Don’t Wait Too Long: 7 Red Flag Signs Your Parent Needs Assisted Living Now

The True Cost of Assisted Living in 2025 – And How Families Are Paying For It

Understanding Senior Living Costs: Pricing Models, Discounts & Financial Assistance

Explore Open Rooms
1 Contact details
2 What type of senior care service are you looking for?
3 What budget do you have in mind for senior care?
4 How soon do you need to find care?
5 Additional details

Thank you for your interest!

Our team will be in touch shortly to help with next steps.