Nursing Home

Autumn Lake Healthcare at Arlington West

Nursing Home

Autumn Lake Healthcare at Arlington West

3939 Penhurst Ave, Baltimore, MD 21215 View map
Overview of Autumn Lake Healthcare at Arlington West

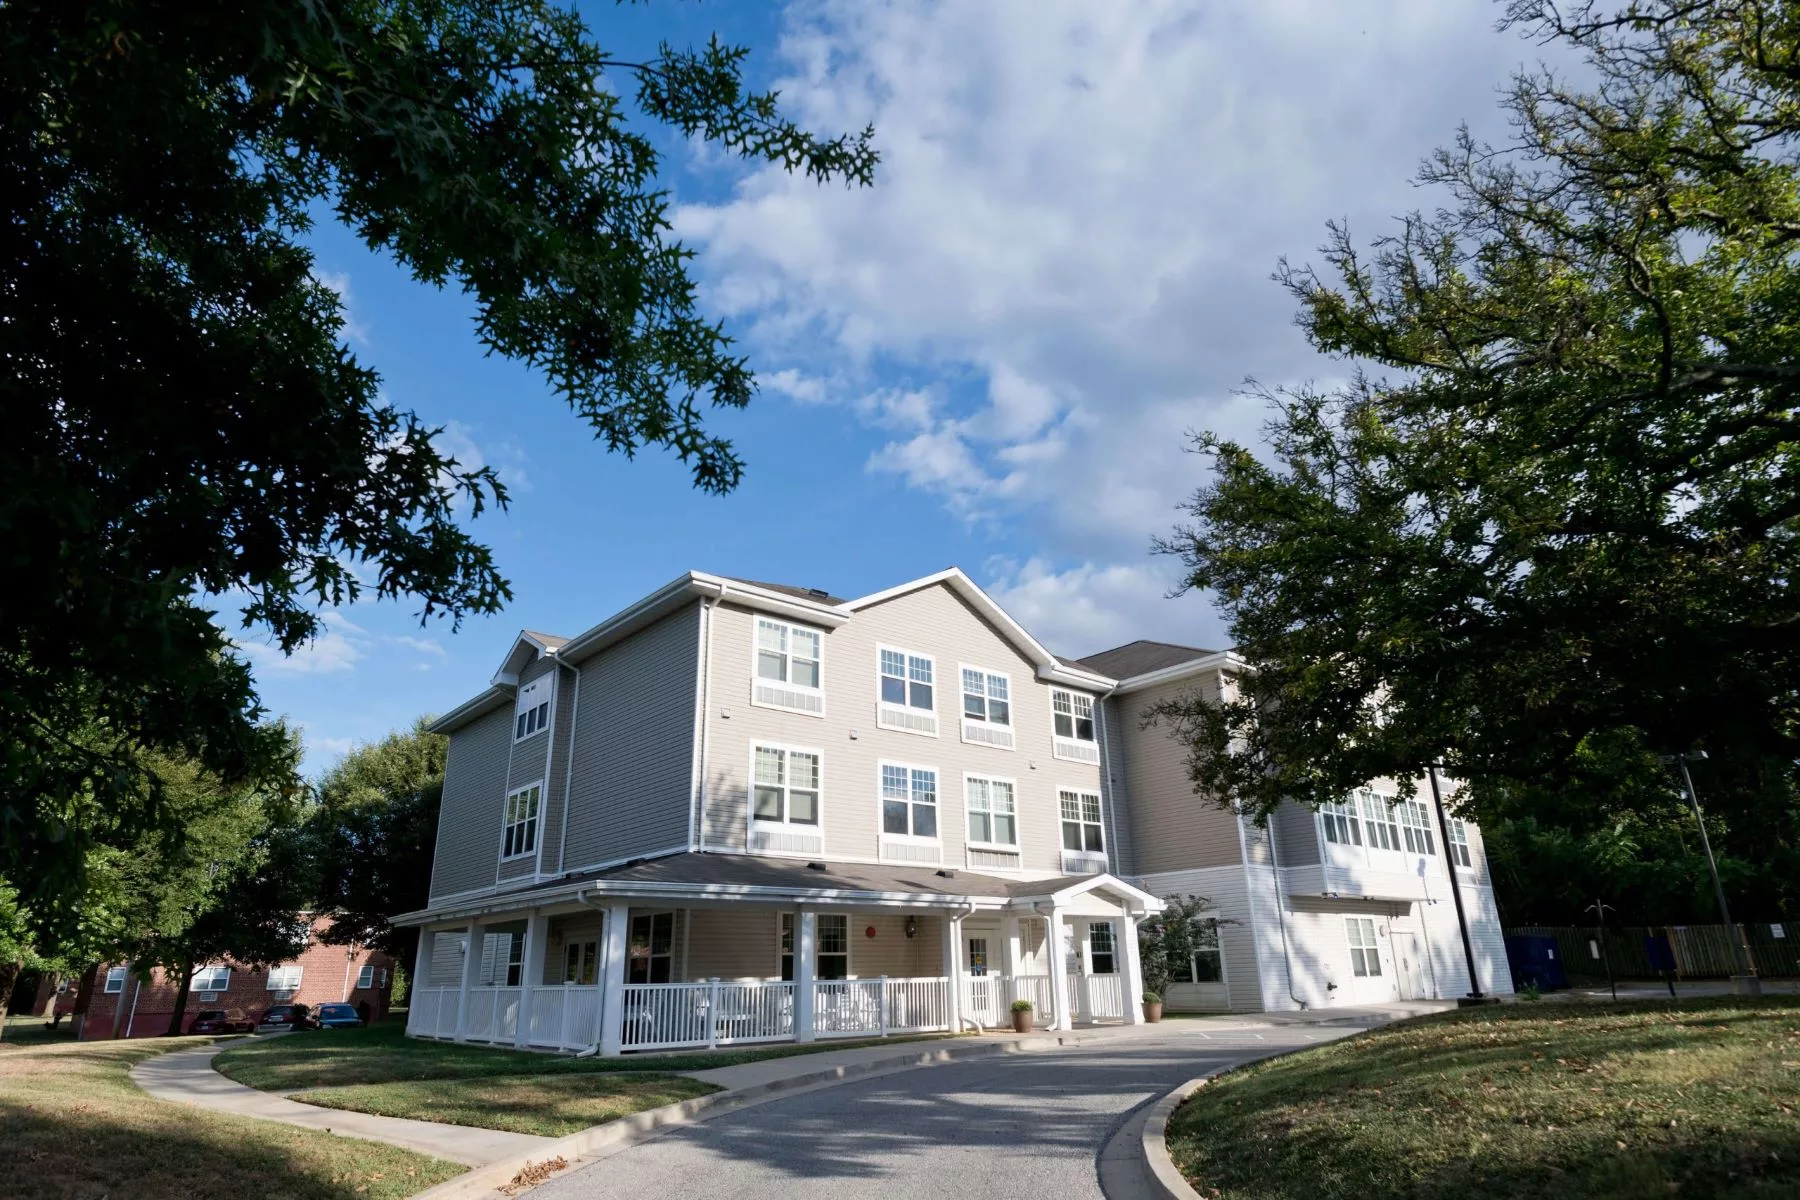
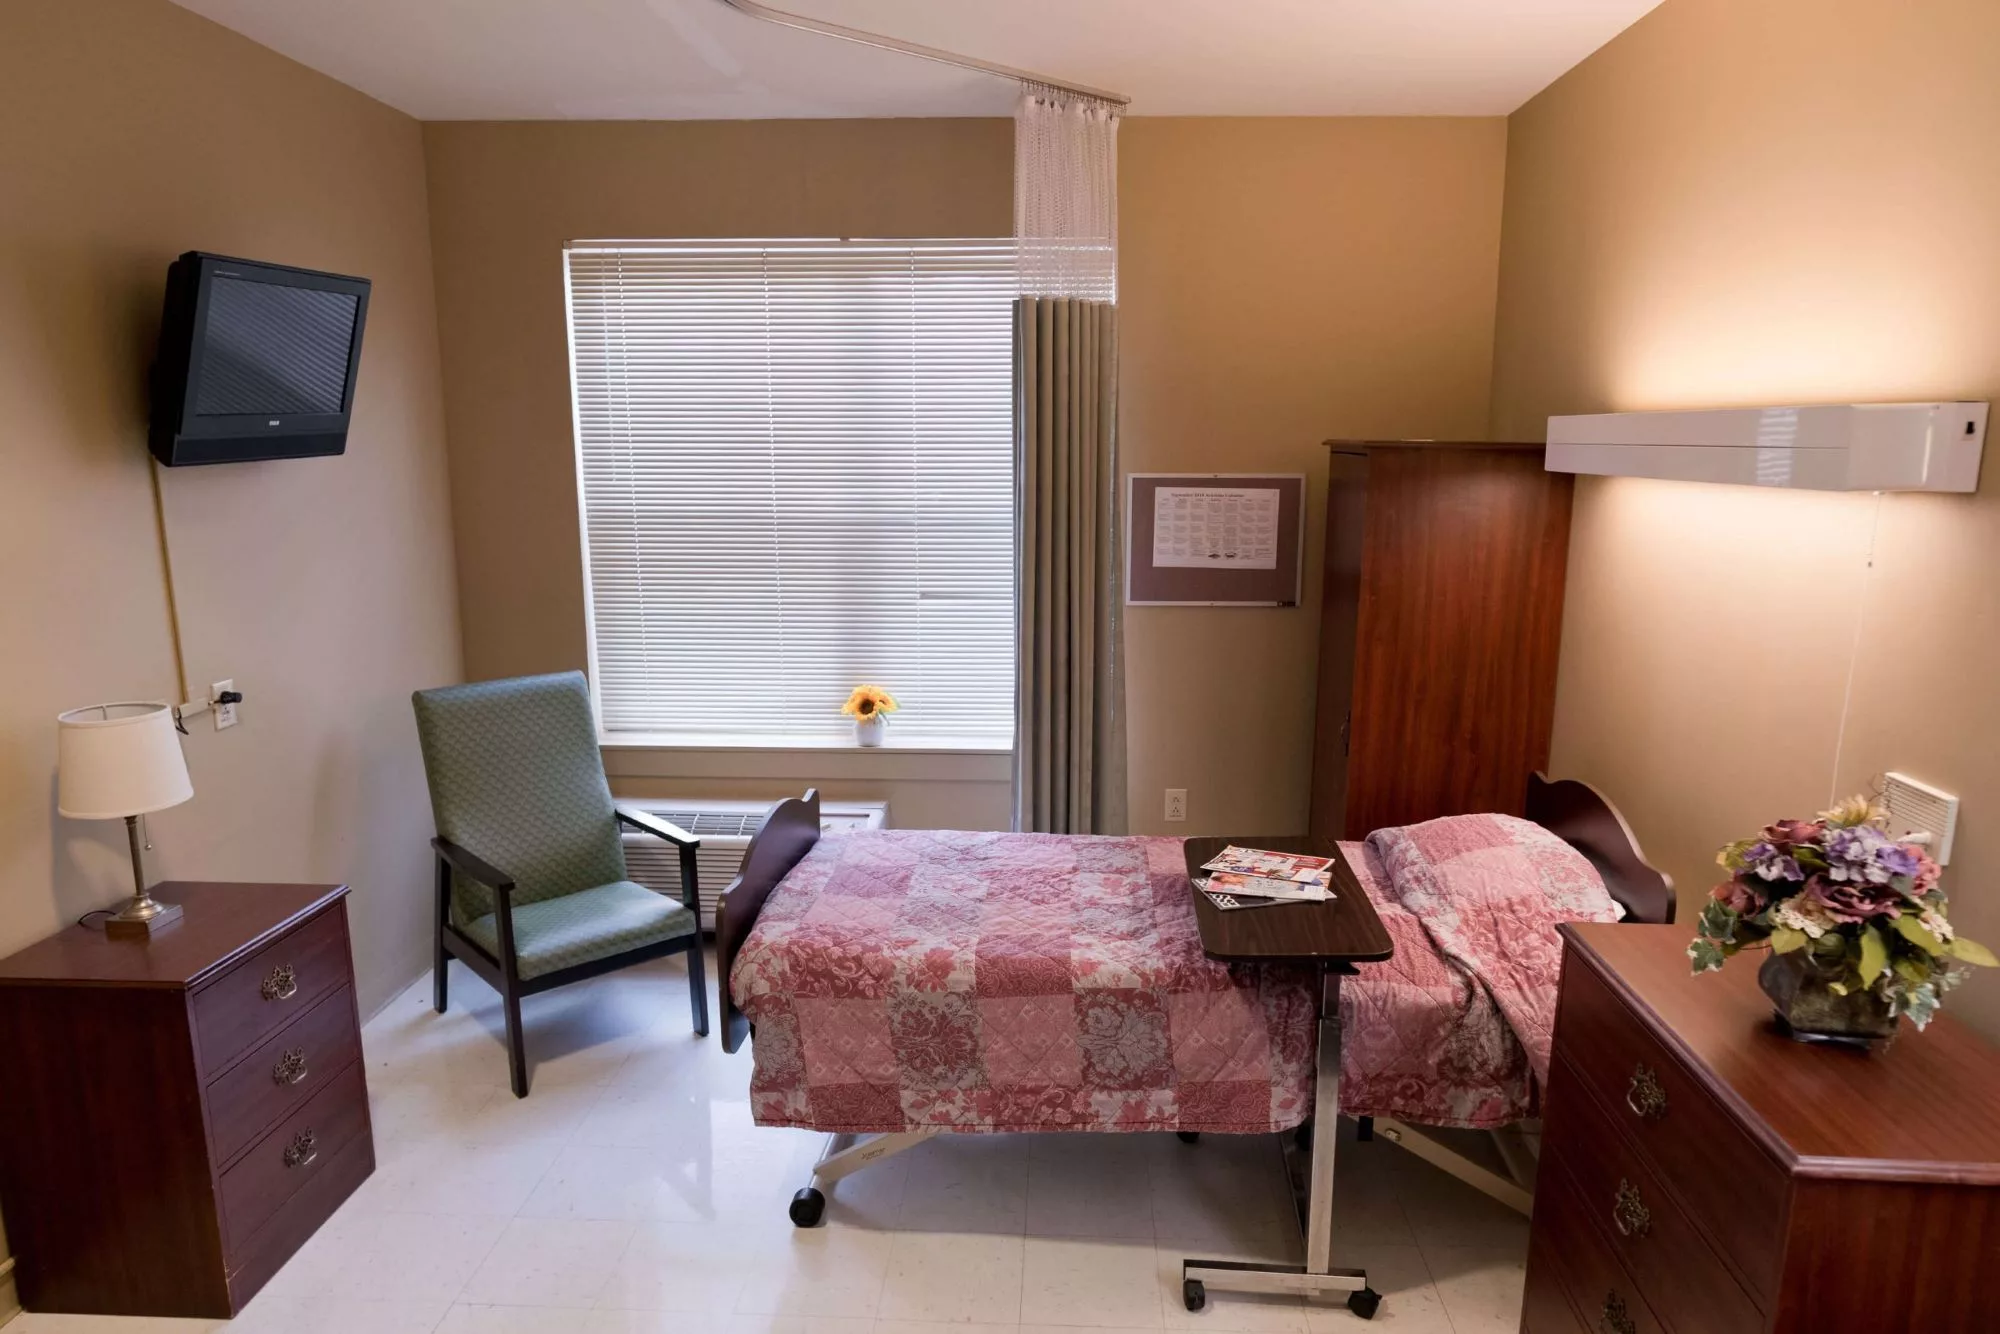
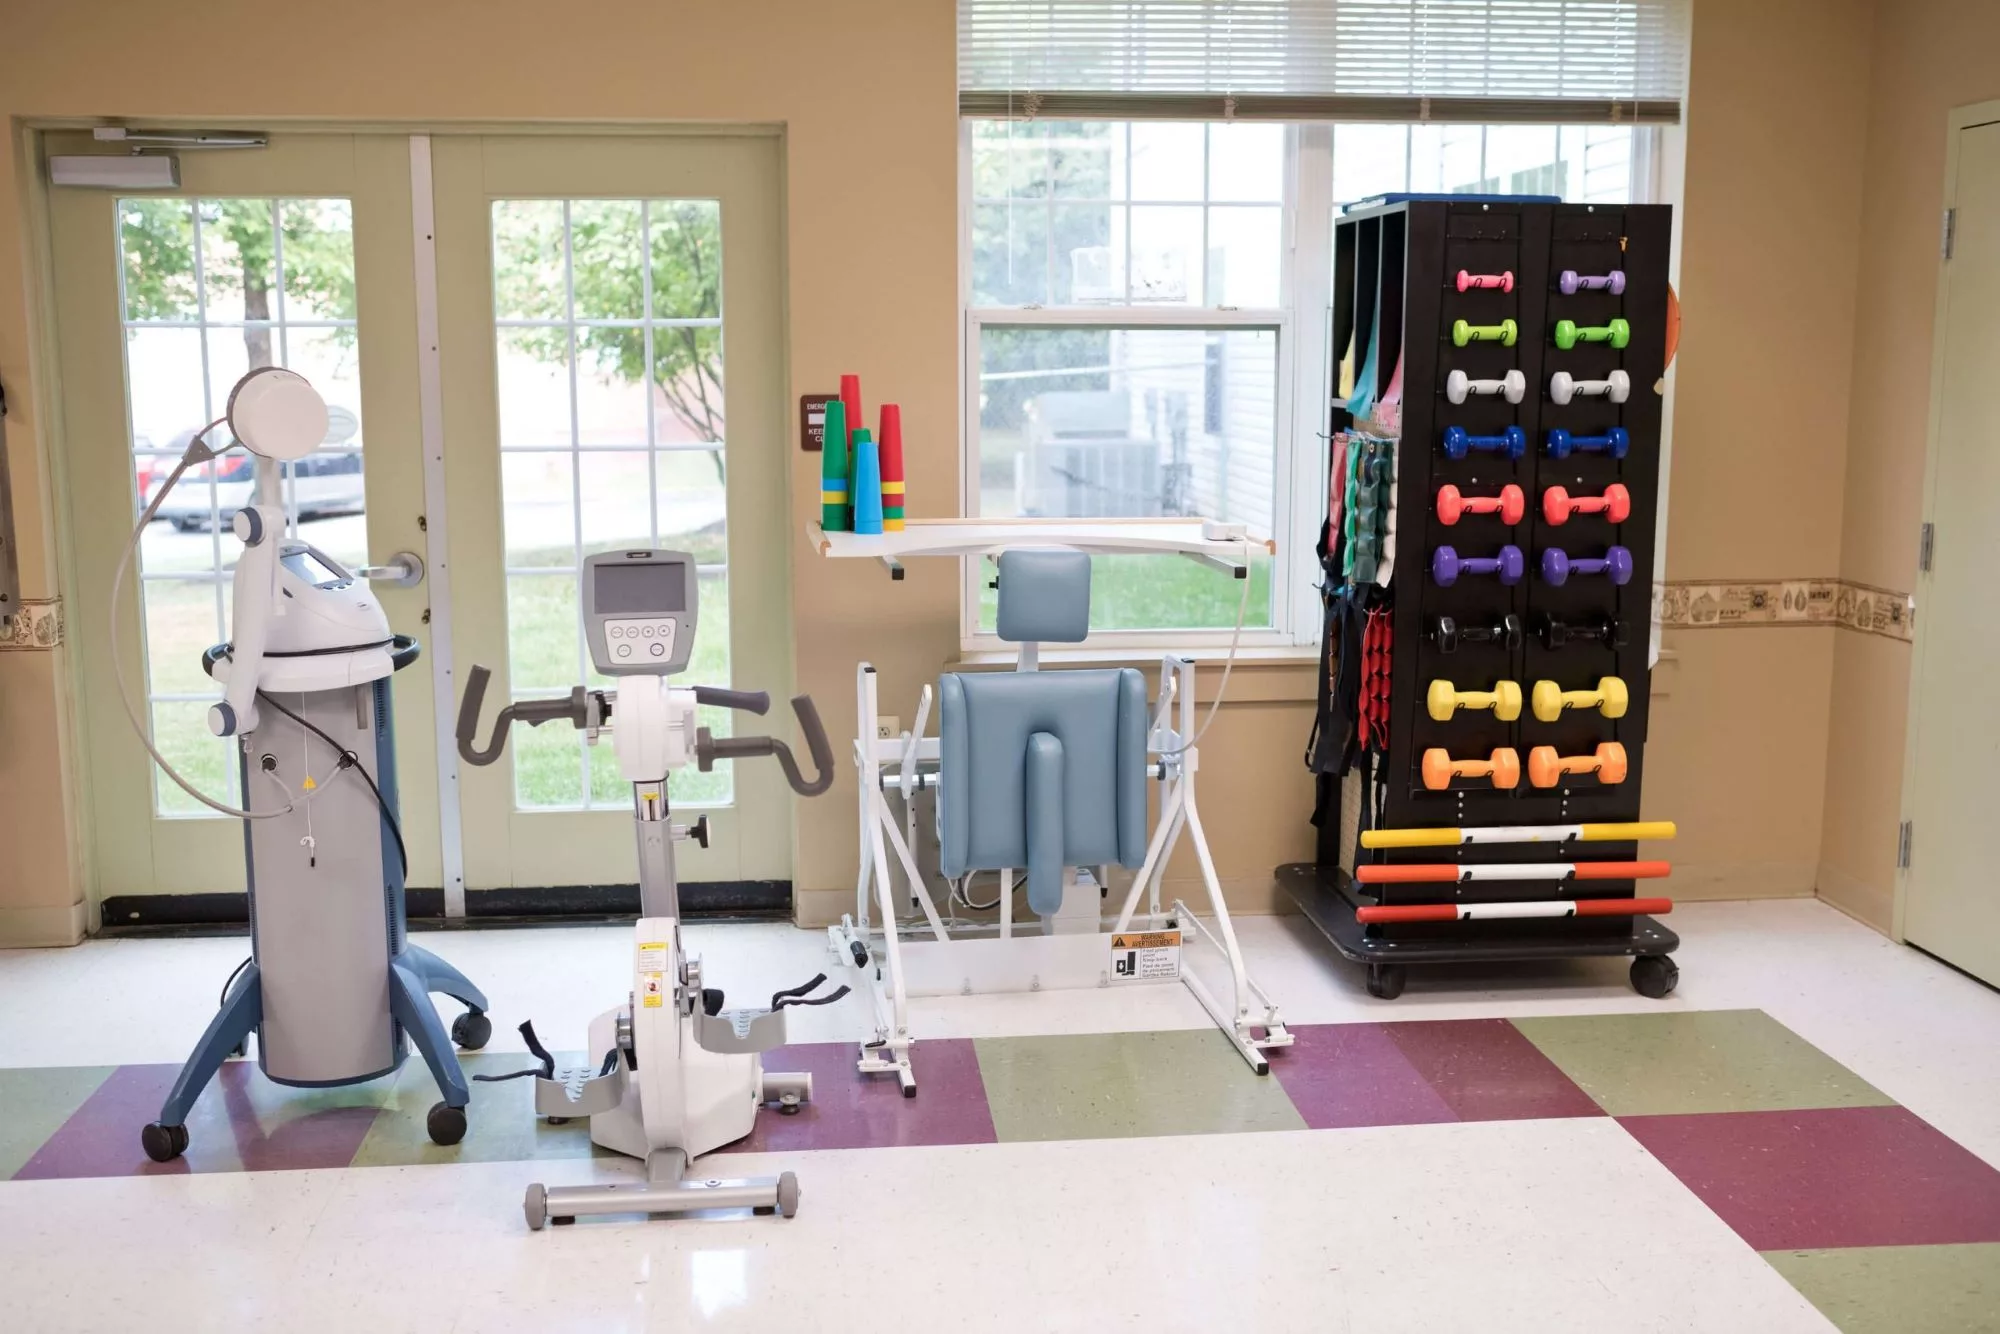
Situated in Baltimore, Maryland, Arlington West Care Center is a cutting-edge nursing and rehabilitation facility. They offer continuous, skilled nursing support for a diverse range of complex medical conditions, ensuring residents receive top-tier care around the clock.
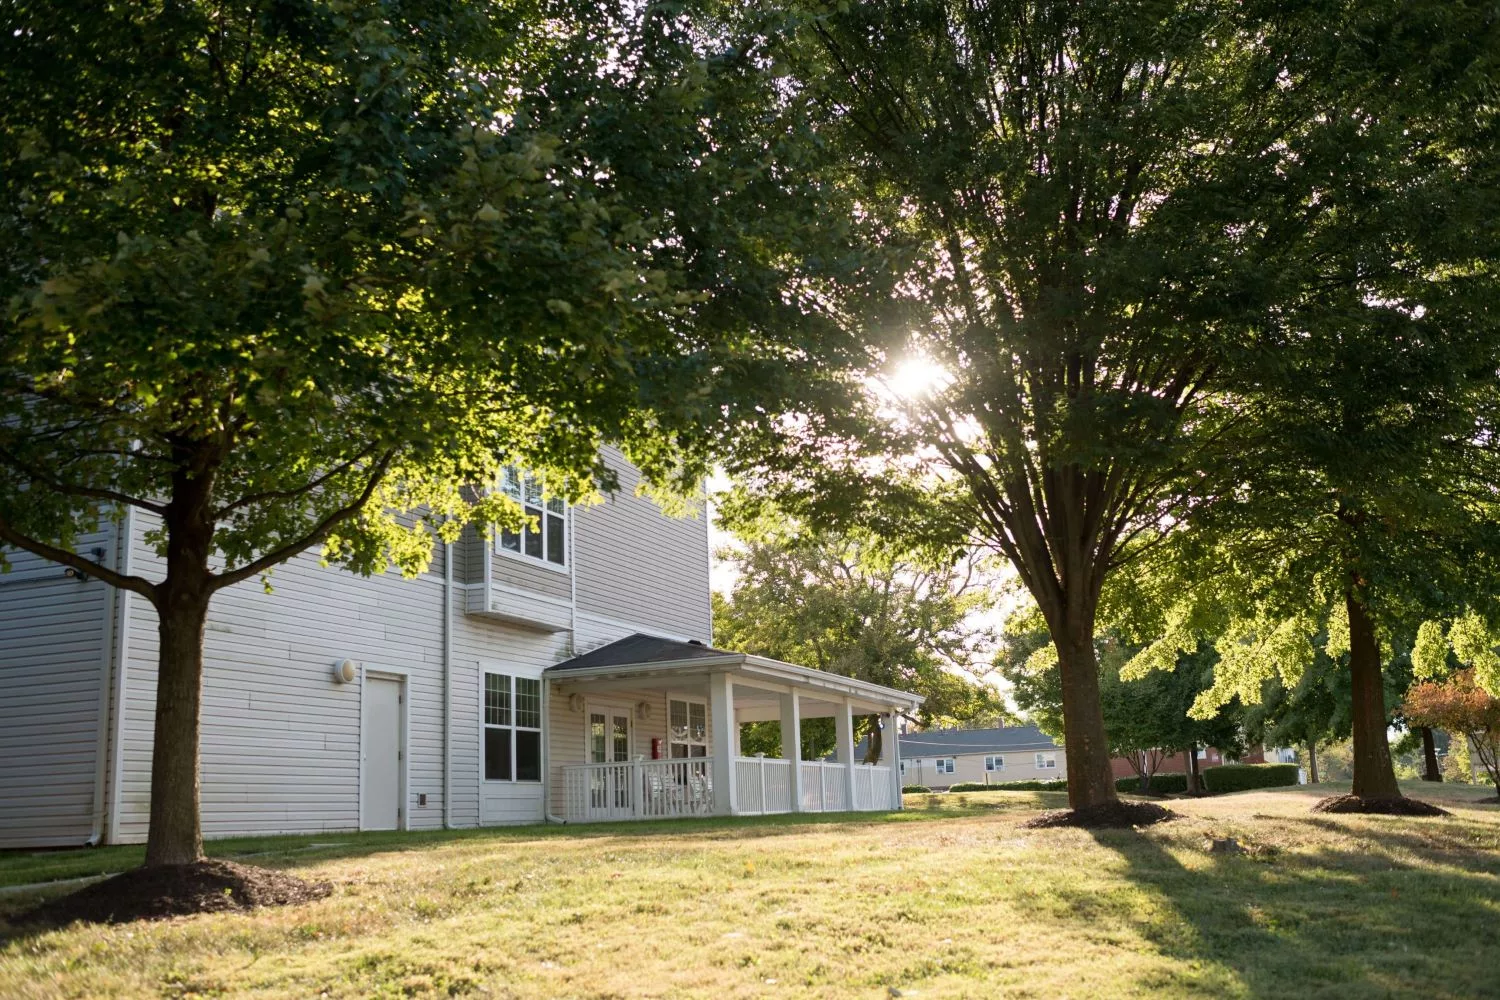
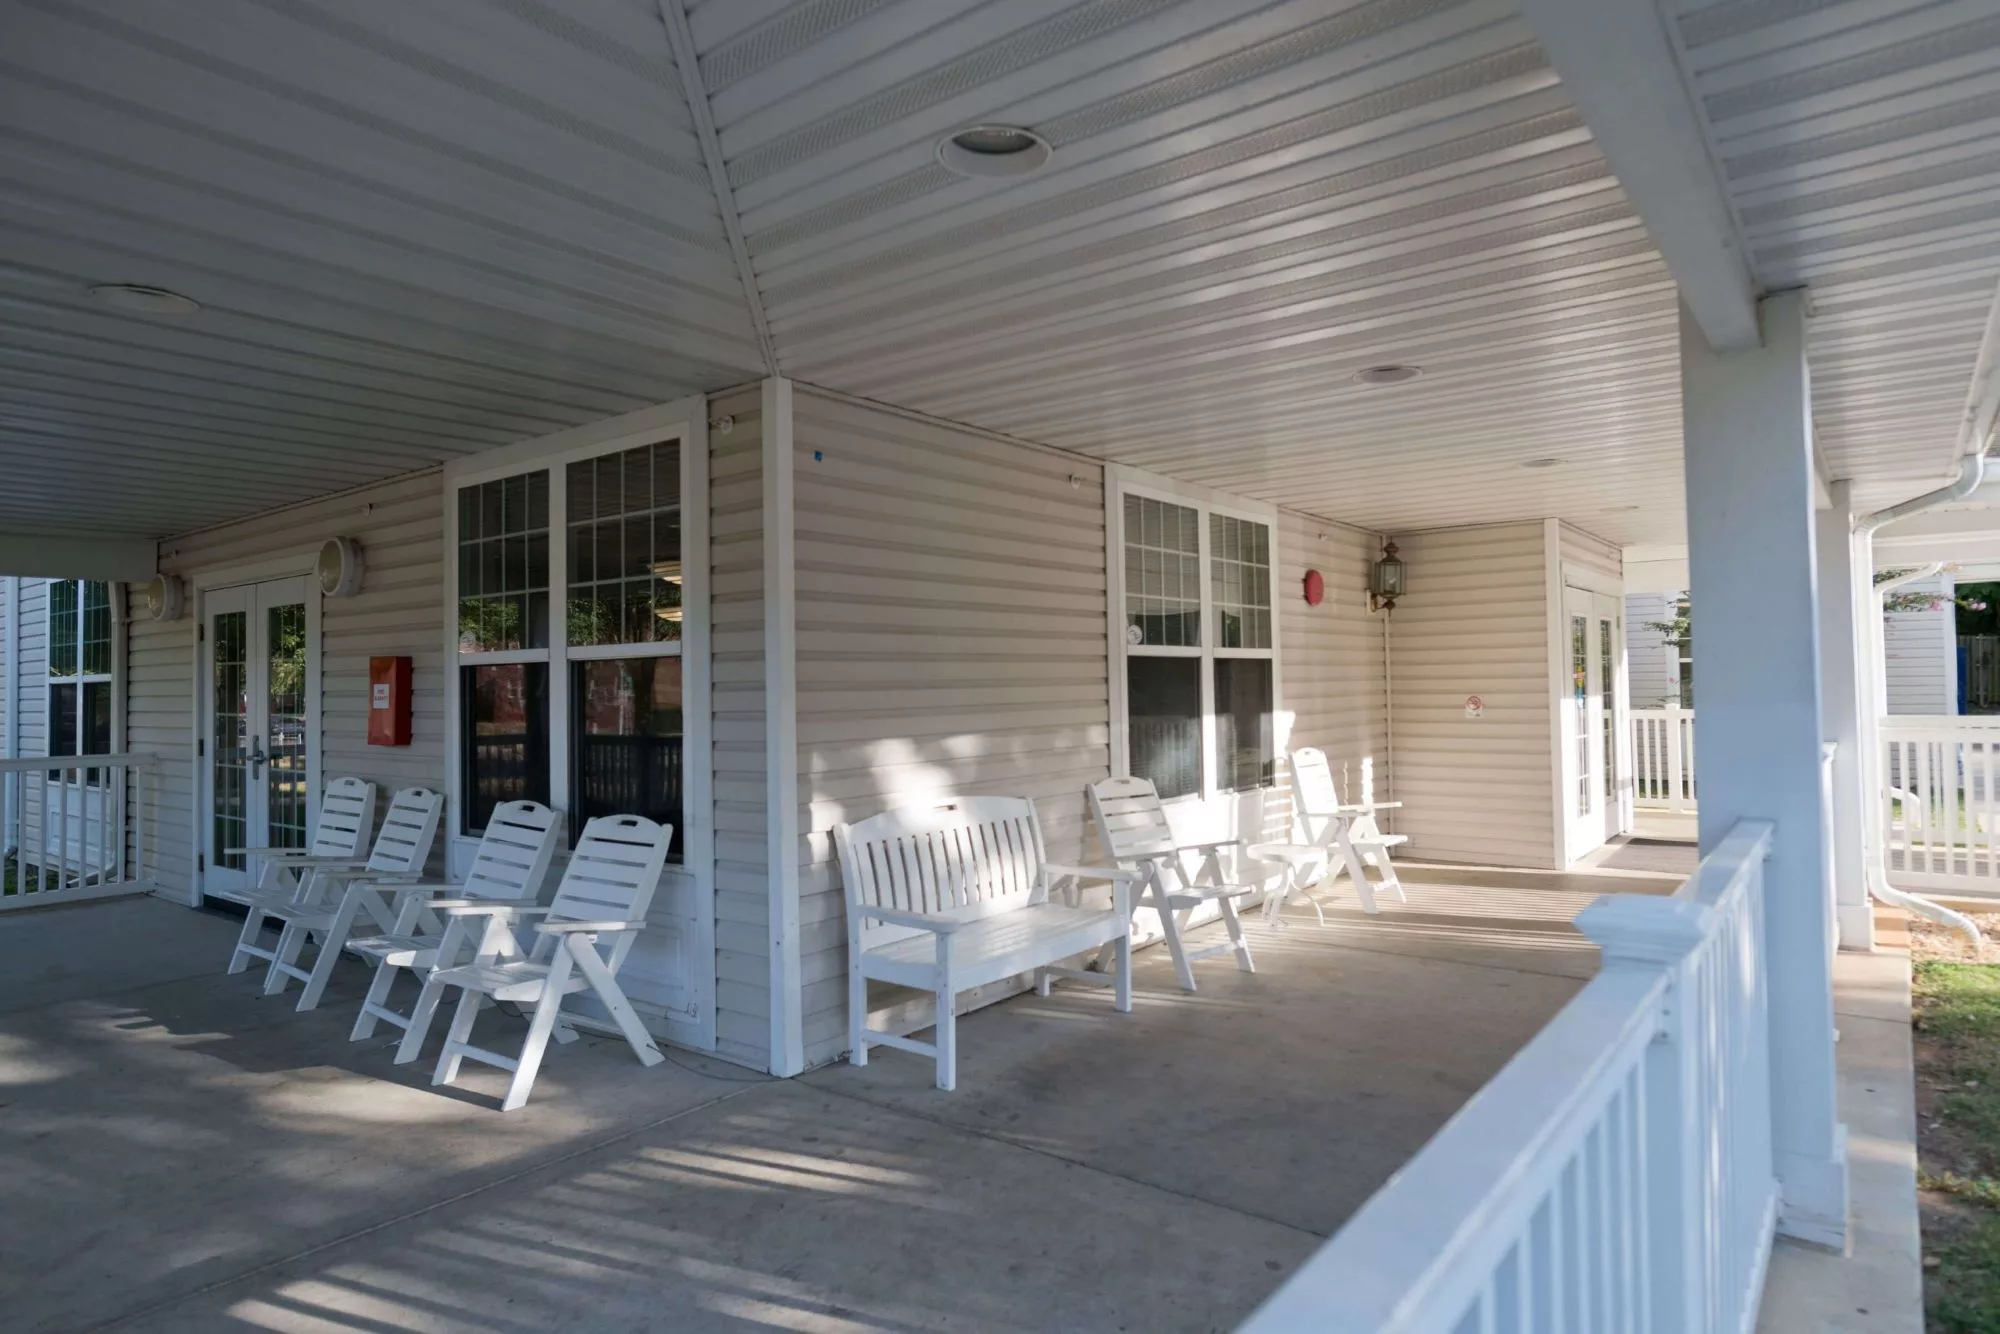
Nestled within a serene, residential neighborhood embraced by verdant trees and green landscapes, individuals seek refuge here for rest, relaxation, and revitalization under the attentive and compassionate care of a dedicated staff. Beyond its renowned sub-acute rehabilitation services, the center has earned acclaim for its unwavering commitment to long-term care. Autumn Lake offers advanced care programs for complex medical conditions, with a dedicated staff ready to assist senior residents every step of the way.

Arlington West Care Center is an independently owned and operated healthcare center that is licensed to use the Arlington West Care Center name and receive non-healthcare related services. All healthcare-related services are provided solely by Arlington West Care Center.

(410) 664-9535

Quality ratings

Measured by Centers for Medicare & Medicaid Services (CMS)

Overall rating Info Official CMS rating based on health inspections, staffing and quality measures.
1/5
Maryland average: 3.0/5
Health Inspection Info Official CMS rating based on deficiencies found during state health inspections.
2/5
Maryland average: 2.8/5
Staffing Info Official CMS rating based on nurse staffing hours per resident per day.
1/5
Maryland average: 3.0/5
Quality Measures Info Official CMS rating based on clinical outcomes for residents.
2/5
Maryland average: 3.7/5

Nursing care per resident

Info Average daily nursing hours per resident (adjusted for acuity). Higher values indicate more nursing time per resident.
3h 16m per day

This home provides 14% less nursing time per resident than the Maryland average.

Maryland average: 3h 46m per day

Staffing hours breakdown

Info Hours of care per resident per day, broken down by staff type. Data from CMS Medicare.
Staff type Facility State avg National avg
Registered Nurse (RN) Info Registered nurse hours per resident per day. 22m per day 37m per day 29m per day

Capacity and availability

Smaller home

May offer a more intimate, personalized care environment.

Total beds 82

This home usually has limited availability

Occupancy is moderate, suggesting balanced demand.

Similar demand to the Maryland average
Occupancy rate 93.8%
Residents per day (avg) 75
Occupancy rate
93.8%
Residents per day (avg)
75

Who this home usually serves

TYPE OF STAY

Mostly long-term care residents

Most residents stay for extended periods and receive ongoing daily care.

Might be optimal for
Long-term daily care Ongoing support needs

Breakdown by payment type

Medicare

32% of new residents, usually for short-term rehab.

Typical stay 1 - 2 months

Private pay

31% of new residents, often for short stays.

Typical stay 26 days

Medicaid

37% of new residents, often for long-term daily care.

Typical stay 1 years

Finances and operations

Privately-owned community
Operated by a business corporation.
Home revenue
$11.9M
Operating loss
-$376.7K
Privately-owned community Operated by a business corporation.
Home revenue
$11,853,266.00
Operating loss
$-376,735.00
Payroll costs Info The portion of the home's budget spent on staff, including nurses, caregivers, and other employees who support care and operations.
$1.5M
12.8% of revenue
Other operating costs Info All remaining costs needed to run the home, such as food, utilities, building maintenance, supplies and administrative expenses.
$10.7M
Total costs $12.2M
Walk Score
Walk Score: 70 / 100
Very walkable. Most errands can be accomplished on foot, and many essentials are within a short walk.

About this community

Care Services

Accepts Medicaid
Accepts Medicare
Nursing Services
Rehabilitation Services
Skilled Nursing
Licensed Nurses/CNAs
Short-Term Rehab

Programs & Activities

Specific Programs
Short-term rehab, Long-term living, World class therapy, Renowned specialty care

Pricing & Financial Information

Health Inspection History

Inspections
Total health inspections 3

Maryland average 3.9


Last Health inspection on Jun 2025

Total health citations 45
Citations per inspection
15

Health citations are formal notices following inspections when they fail to comply with safety and care standards.

44 of 45 citations resulted from standard inspections; and 1 of 45 came from combined inspections (standard and complaint).

Breakdown of citation severity (last 3 years)
Critical Health citations More info 0
100% better than Maryland average

Maryland average: 0.5


Serious Health citations More info 0
100% better than Maryland average

Maryland average: 0.6

0 critical citations More info Maryland average: 0.5

0 serious citations More info Maryland average: 0.6

42 moderate citations More info Maryland average: 47.2

3 minor citations More info Maryland average: 1.7
Citations history (last 3 years)
Abuse/Neglect moderate citation Jun 17, 2025
Corrected

Abuse/Neglect moderate citation Jun 17, 2025
Corrected

Pharmacy moderate citation Jun 17, 2025
Corrected

Resident Rights moderate citation Jun 17, 2025
Corrected

Compare Nursing Homes around Baltimore

The information below is reported by the Maryland Department of Health, Office of Health Care Quality.
Advanced Rehab at Autumn Lake Healthcare
SNF

Nursing Home 24/7 care needed

AL

Assisted Living For seniors needing help with daily tasks but not full-time nursing.

MD 21093
110
-
10
515 BRIGHTFIELD ROAD HOLDCO LLC
68.8%
$11,242,712.00
$1,091,465.00
9.7%
74.00
4/5
4.2437
4/5
3/5
4/5
1
40
1
-34%
+12%
-16%
Autumn Lake Healthcare at Calvert Manor
SNF

Nursing Home 24/7 care needed

AL

Assisted Living For seniors needing help with daily tasks but not full-time nursing.

MD 21911
144
-
10
1881 TELEGRAPH ROAD HOLDCO LLC
95.8%
$24,413,807.00
$2,198,082.00
9%
131.00
3/5
3.3123
3/5
3/5
2/5
-
30
-
-15%
-12%
+16%
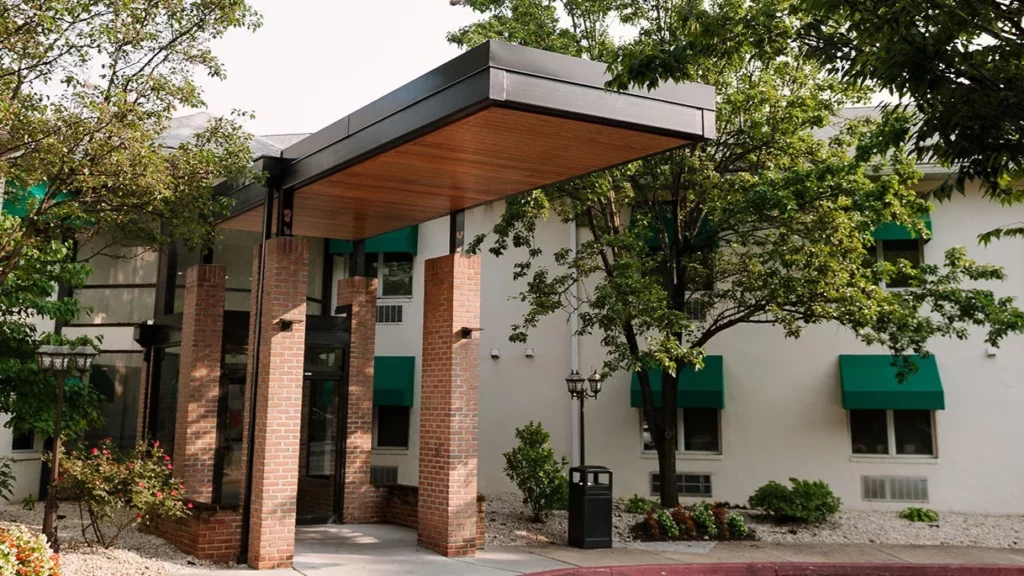
Autumn Lake Healthcare at Alice Manor
SNF

Nursing Home 24/7 care needed

AL

Assisted Living For seniors needing help with daily tasks but not full-time nursing.

Baltimore (Woodberry)
105
-
59
ALICE OPERATOR LLC
81.7%
$12,740,049.00
$1,537,730.00
12.1%
92.40
1/5
3.4746
2/5
1/5
4/5
-
54
1
-37%
-8%
-1%
Autumn Lake Healthcare at Arlington West
SNF

Nursing Home 24/7 care needed

AL

Assisted Living For seniors needing help with daily tasks but not full-time nursing.

Baltimore (Dolfield)
82
-
70
AWCC HOLDCO LLC
93.8%
$11,607,714.00
$1,511,598.00
13%
75.10
1/5
3.2587
2/5
1/5
2/5
-
45
-
-61%
-14%
+14%
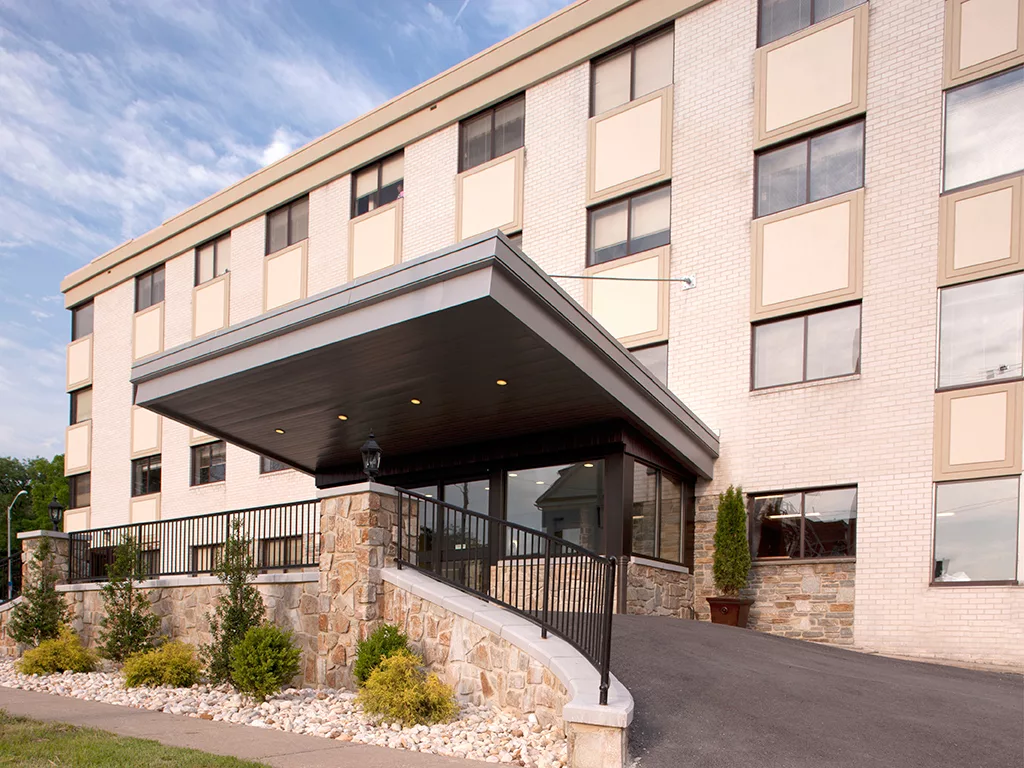
Autumn Lake Healthcare at BridgePark
SNF

Nursing Home 24/7 care needed

AL

Assisted Living For seniors needing help with daily tasks but not full-time nursing.

Baltimore (Central Forest Park)
99
C+
69
BP CAPITAL
88.9%
$16,491,687.00
$1,097,077.00
6.7%
85
1/5
3.7677
1/5
3/5
3/5
-
71
1
+4%
0%
+8%

Places of interest near Autumn Lake Healthcare at Arlington West

Address 5.1 miles from city center — 1.49 miles to nearest hospital (Sinai Pediatric Hematology/onc)
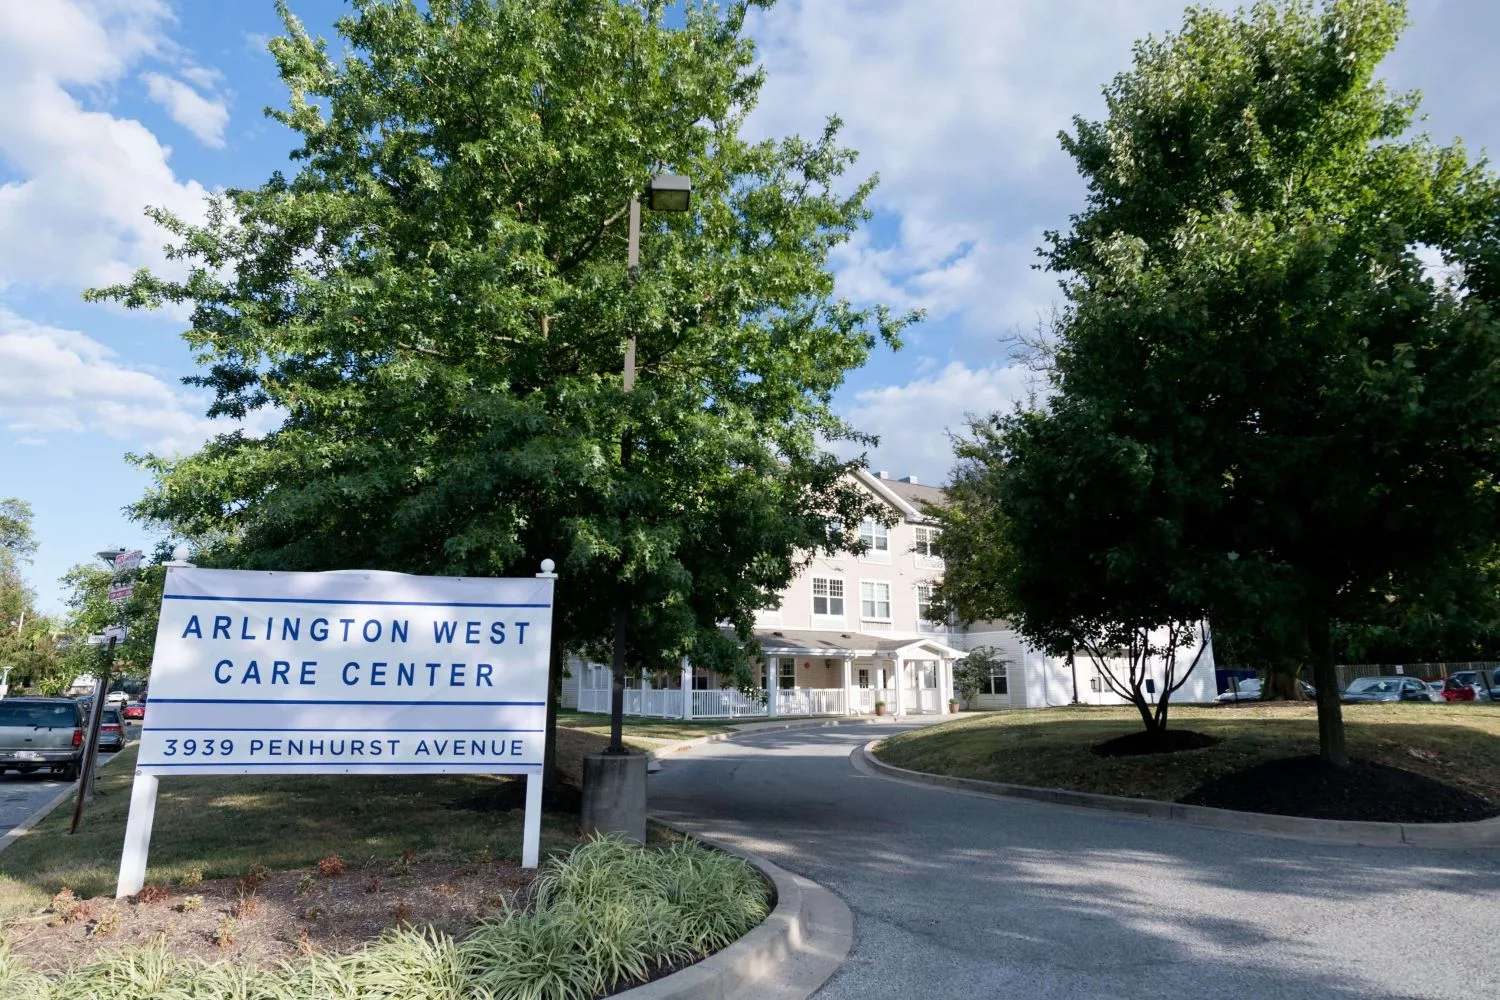
Address 3939 Penhurst Ave, Baltimore, MD 21215

Calculate Travel Distance to Autumn Lake Healthcare at Arlington West

Add your location

Address

Staffing Data

Source: CMS Payroll-Based Journal (Q2 2025)

253
Total Staff
66
Employees
187
Contractors
29,736
Total Hours (Quarter)
40
Avg Staff/Day
8.2
Avg Shift (hrs)
Nursing Staff Breakdown
Role Count Avg Shift (hrs) Uses Contractors?
Registered Nurse137.8 Yes
Licensed Practical Nurse899 Yes
Certified Nursing Assistant1158.2 Yes
Staff by Category
Administration
1 staff
8hs shift avg
Nursing Staff
219 staff
8.4hs shift avg
Physicians & Practitioners
2 staff
8hs shift avg
Therapy Services
21 staff
6.7hs shift avg
Activities & Recreation
0 staff
0hs shift avg
Social Services
4 staff
7.8hs shift avg
Dietary Services
5 staff
7.7hs shift avg
Other Services
1 staff
7.8hs shift avg
Contractor Analysis
21.3%
of total hours from contractors
6,346 contractor hours this quarter
Speech Language Pathologist: 3 Certified Nursing Assistant: 80 Registered Nurse: 7 Qualified Social Worker: 4 Licensed Practical Nurse: 75 Physical Therapy Aide: 6 Physical Therapy Assistant: 5 Respiratory Therapy Technician: 7
Role Employees Contractors Total Staff Total Hours Days Worked % of Days Avg Shift (hrs)
Certified Nursing Assistant358011513,69091100%8.2
Licensed Practical Nurse1475897,74991100%9
Registered Nurse67132,00491100%7.8
Other Dietary Services Staff4049498998%7.5
RN Director of Nursing2028826369%8
Physical Therapy Assistant0556866673%6.8
Administrator1015046369%8
Nurse Practitioner1015046369%8
Clinical Nurse Specialist1015046369%8
Speech Language Pathologist0334746066%7.7
Dietitian1014645864%8
Qualified Social Worker0444615560%7.8
Mental Health Service Worker1014465763%7.8
Physical Therapy Aide0662153741%5.5
Respiratory Therapy Technician0772053437%6

Facility Characteristics

Source: CMS Long-Term Care Facility Characteristics (Data as of Jan 2026)

Total census
74 residents
Residents by payment source
Medicare
9 residents (12.2%)
Medicaid
64 residents (86.5%)
Private pay or other
1 resident (1.4%)
Programs & Services
Residents' Group

Residents meet regularly to discuss policies, care quality, and activities

Active Resident Council

Organized group of residents that meets regularly to discuss facility policies, quality of life, and activities.

Quality of care over time

These measures show how residents usually do over time at this home, based on health outcomes and preventive care.

High-risk clinical events score Info A composite score based on pressure ulcers, falls with injury, weight loss, walking ability decline, and activities of daily living decline. 10.3
20% better than Maryland average

Maryland average: 12.9

Functional decline score Info A composite score based on activities of daily living decline, walking ability decline, and incontinence. 28.7
12% worse than Maryland average

Maryland average: 25.7

Long-stay resident measures
Below average Maryland avg: 3.8 Info CMS star rating based on long-stay quality measure performance. 5 stars = significantly above average, 1 star = significantly below average.
Need for Help with Daily Activities Increased Info Percent of long-stay residents whose need for help with daily activities has increased 30.1%
27% worse than Maryland average

Maryland average: 23.7%

Low Risk Residents with Bowel/Bladder Incontinence Info Percent of low risk long-stay residents who lose control of their bowels or bladder 27.3%
5% worse than Maryland average

Maryland average: 25.9%

Falls with Major Injury Info Percent of long-stay residents experiencing one or more falls with major injury 0.7%
68% better than Maryland average

Maryland average: 2.3%

High Risk Residents with Pressure Ulcers Info Percent of long-stay high risk residents with pressure ulcers 4.8%
26% better than Maryland average

Maryland average: 6.5%

Urinary Tract Infection Info Percent of long-stay residents with a urinary tract infection 4.0%
149% worse than Maryland average

Maryland average: 1.6%

Lost Too Much Weight Info Percent of long-stay residents who lose too much weight 5.6%
In line with Maryland average

Maryland average: 5.8%

Depressive Symptoms Info Percent of long-stay residents who have depressive symptoms 9.4%
54% better than Maryland average

Maryland average: 20.2%

Antipsychotic Use Info Percent of long-stay residents who received an antipsychotic medication 6.5%
50% better than Maryland average

Maryland average: 12.9%

Pneumococcal Vaccine Info Percent of long-stay residents assessed and appropriately given the pneumococcal vaccine 100.0%
9% better than Maryland average

Maryland average: 92.0%

Influenza Vaccine Info Percent of long-stay residents assessed and appropriately given the seasonal influenza vaccine 100.0%
In line with Maryland average

Maryland average: 96.6%

Hospitalizations per 1,000 days Info Number of hospitalizations per 1,000 long-stay resident days. 2.31
75% worse than Maryland average

Maryland average: 1.32

ED visits per 1,000 days Info Number of outpatient emergency department visits per 1,000 long-stay resident days. 1.23
In line with Maryland average

Maryland average: 1.21

Short-stay resident measures
Below average Maryland avg: 3.7 Info CMS star rating based on short-stay quality measure performance. 5 stars = much above average, 1 star = much below average.
Pneumococcal Vaccine Info Percent of short-stay residents assessed and appropriately given the pneumococcal vaccine 91.4%
17% better than Maryland average

Maryland average: 78.4%

Antipsychotic medication increase Info Percent of short-stay residents who newly received an antipsychotic medication 1.0%
27% better than Maryland average

Maryland average: 1.4%

Influenza Vaccine Info Percent of short-stay residents assessed and appropriately given the seasonal influenza vaccine 98.1%
22% better than Maryland average

Maryland average: 80.6%

Re-hospitalized after SNF stay Info Percentage of short-stay residents who were re-hospitalized after their nursing home admission. 25.7%
21% worse than Maryland average

Maryland average: 21.2%

Emergency department visits Info Percentage of short-stay residents who had an outpatient emergency department visit. 10.9%
10% worse than Maryland average

Maryland average: 9.9%

Falls with major injury Info Percentage of SNF residents who experience falls with major injury during their stay. 0.0%
100% better than Maryland average

Maryland average: 0.8%

Ability to care for self at discharge Info Percentage of residents at or above expected ability to care for themselves at discharge. 46.0%
14% worse than Maryland average

Maryland average: 53.7%

Successful return to home or community Info Rate of successful return to home or community from a skilled nursing facility. 34.7%
31% worse than Maryland average

Maryland average: 50.6%

Guides for Better Senior Living

Care Cost Calculator: See Prices in Your Area

Nursing Home Data Explorer

Don’t Wait Too Long: 7 Red Flag Signs Your Parent Needs Assisted Living Now

The True Cost of Assisted Living in 2025 – And How Families Are Paying For It

Understanding Senior Living Costs: Pricing Models, Discounts & Financial Assistance

Financial Aid for Maryland Seniors

Get financial aid guidance

Community Options Waiver

Maryland Medicaid Community Options Waiver

Age 65+ or disabled, Maryland resident, Medicaid- eligible, nursing home-level care need.

~$2,829/month (300% FBR, individual).

$2,000 (individual), $3,000 (couple) (excludes home, car).

High urban demand; rural outreach efforts.

Senior Care Program

Maryland Senior Care

Age 65+, Maryland resident, at risk of nursing home placement.

~$2,000/month (individual, varies by county).

$11,000 (individual).

Limited funding; waitlists common in high-demand areas.

Maryland Nursing Home Medicaid

Maryland Medical Assistance (Medicaid) Nursing Home Program

Age 65+, Maryland resident, Medicaid-eligible, requires nursing home-level care.

$943/month (individual); most income applied to care costs.

$2,500 (individual), $3,000 (couple); spousal protections up to $155,356.

Home equity limit $636,000; estate recovery applies post-55.

Senior Assisted Living Subsidy Program

Maryland Senior Assisted Living Group Home Subsidy

Age 62+, Maryland resident, in or moving to approved assisted living, low/moderate income.

~$34,000/year (individual, varies by county).

Not strict; prioritizes low-income.

Not available statewide; facility must be licensed by MDH.

Veterans Aid and Attendance (A&A) Benefit

Maryland VA Aid and Attendance

Wartime veteran/spouse, age 65+ or disabled, needs ADL help, Maryland resident.

Net income minus medical expenses < $1,984/month (individual with A&A).

$155,356 (net worth limit).

High veteran population in suburban/rural areas.

Senior Prescription Drug Assistance Program (SPDAP)

Maryland Senior Prescription Drug Assistance Program

Age 65+, Maryland resident (6+ months), Medicare Part D enrolled.

$48,560/year (individual, 300% FPL).

None specified.

Supplements Medicare Part D; annual enrollment required.

Medicare Savings Programs (MSP)

Maryland Medicare Savings Programs

Age 65+, Maryland resident, Medicare Part A/B enrollee.

$2,014/month (QMB), $2,706/month (SLMB/QI, individual).

$9,090 (individual), $13,630 (couple).

Includes QMB, SLMB, QI categories.

Community Personal Assistance Services (CPAS)

Maryland Medicaid Community Personal Assistance Services

Age 65+, Maryland resident, Medicaid-eligible, needs ADL assistance.

$943/month (individual); spend-down available.

$2,500 (individual), $3,000 (couple).

Consumer-directed option allows hiring family caregivers.