Autumn Lake Healthcare at Alice Manor
Nursing Home, Hospice Care, Palliative Care & Respite Care · Baltimore, MD
CMS overall rating Info CMS (the Centers for Medicare & Medicaid Services) is the federal agency that rates nursing home quality. Its Overall Rating runs from 1 to 5 stars, combining health inspections, staffing, and quality measures, with inspections weighted most heavily.

Autumn Lake Healthcare at Alice Manor

Nursing Home, Hospice Care, Palliative Care & Respite Care · Baltimore, MD
CMS overall rating Info CMS (the Centers for Medicare & Medicaid Services) is the federal agency that rates nursing home quality. Its Overall Rating runs from 1 to 5 stars, combining health inspections, staffing, and quality measures, with inspections weighted most heavily.
Calculator: See prices in your area
Autumn Lake Healthcare at Alice Manor accepts Medicare, Medicaid, and private pay.

Overview of Autumn Lake Healthcare at Alice Manor

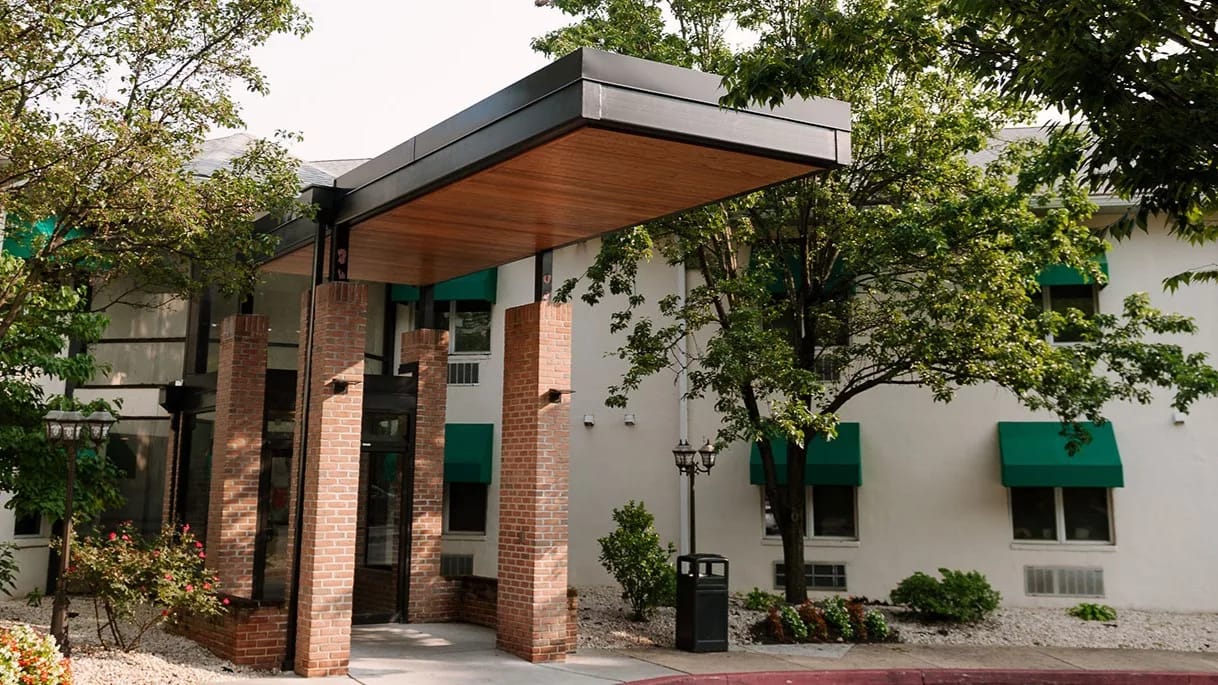
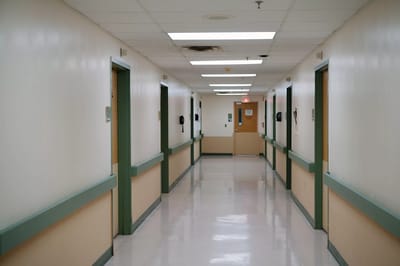
At 2095 Rockrose Ave in Baltimore’s Woodberry neighborhood, Autumn Lake Healthcare at Alice Manor operates as a 105-bed skilled nursing community under independent ownership by Alice Operator LLC. The facility has served residents for 33 years. Administrator John Rajakumar leads operations.

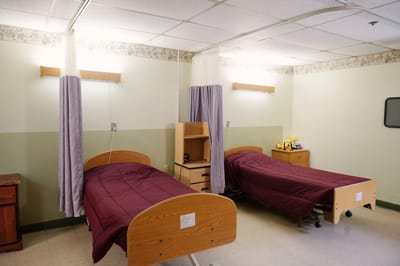
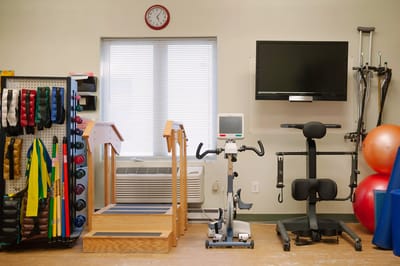
Care includes 24/7 skilled nursing, physical and occupational therapy, speech pathology, restorative care, bereavement counseling, diabetes management, and tracheostomy services, with psychiatry, wound care, and physiatry consultation.

Current residents are predominantly Medicaid-funded (81.1%), with admission patterns weighted toward Medicaid (40%), private pay (35%), and Medicare (24%). Average stay runs 137 days. Occupancy at 81.7% aligns with state average.

The facility recorded 55 citations since 2018; 6.9 annually, a rate 1280% above Maryland’s typical 0.5 per year.

Two complaint investigations in 2024–2025 documented critical deficiencies. The May 2025 survey found an unsecured biohazard storage room, understaffing substantiated by multiple resident and staff interviews, and nursing personnel unaware of AED locations. The November 2024 complaint investigation uncovered an unclean environment, verbal abuse by one staff member affecting three residents, four instances of delayed abuse reporting, 15 incidents inadequately investigated, and one medication error of grave severity: an agency-supplied nurse administered methadone to a patient not prescribed it, resulting in hospital admission.

Recurring deficiency patterns across 2018–2025 inspections implicate Resident Rights (22% of total citations), Quality of Life and Care (22%), and Pharmacy Services (13%).

The facility carries a 1-star CMS overall rating.

Daily nursing care totals 3 hours 28 minutes per resident, 19% below Maryland standard. Registered nurse presence is critically low at 15 minutes daily, 70% beneath state expectation.

The facility maintains 386 staff members, but contractor labor dominates the nursing workforce: 107 of 117 LPNs and 152 of 205 CNAs work under contract, representing 36% of total hours and raising continuity and quality concerns.

Depression affects 71.7% of long-stay residents, a 255% elevation above state prevalence. Functional decline scores run 13% worse than state. Conversely, urinary tract infection rates stand at zero, and 55.1% of residents successfully return to community settings post-discharge.

The facility maintains 4.0% operating margin but experienced occupancy erosion and income decline from 2022 to 2023.

No federal penalties appear in recent records, though complaint investigation severity may signal enforcement pending.

The facility is positioned for long-term Medicaid residents in an established urban location; recent substantive compliance findings, high depressive symptom prevalence, critical staffing shortfalls, and documented serious medication errors constitute material operational risks.

(410) 889-9700

Quality ratings

Measured by Centers for Medicare & Medicaid Services (CMS)

Overall rating Info The Overall CMS Rating combines results from health inspections, staffing levels and quality measures. Health inspections carry the most weight. Staffing and quality scores can increase or decrease the final rating based on performance compared to state and national standards.
▼ 12.0% Below MD avg. ▼ 12.0% Below MD avg.MD average: 3.4Click the badge to see the full State ranking.Click here to see the full State ranking.
Health Inspection Info Based on the results of the facility's three most recent standard inspections and any complaint investigations. CMS reviews the number, scope, and severity of deficiencies, with more recent findings weighted more heavily.
▼ 6.3% Below MD avg. ▼ 6.3% Below MD avg.MD average: 3.2Click the badge to see the full State ranking.Click here to see the full State ranking.
Staffing Info Measures average nursing staff hours per resident per day, including Registered Nurses (RNs) and total nursing staff. Ratings are adjusted based on the level of care residents require and are compared to state and national benchmarks.
▼ 71.8% Below MD avg. ▼ 71.8% Below MD avg.MD average: 3.5Click the badge to see the full State ranking.Click here to see the full State ranking.
Quality Measures Info Based on clinical and physical health indicators reported to CMS, such as hospital readmissions, falls, pressure ulcers, and improvements in mobility. These measures reflect how well residents' health needs are being managed.
▲ 34.0% Above MD avg. ▲ 34.0% Above MD avg.MD average: 3.7Click the badge to see the full State ranking.Click here to see the full State ranking.

Staffing hours breakdown

Info Daily nursing hours per resident by staff type, reported to CMS. Higher is generally better — compare this facility to state and national averages to see where staffing stands.

Hours per resident per day — compared to Maryland state averages

Total nursing care / resident Info This home is ranked 68th out of 144 homes in Maryland for nurse hours. Total adjusted nursing hours per resident per day, combining RN, LPN, and aide time. CMS adjusts this for case-mix so facilities can be fairly compared.
3h 28m per day
Rank #68 / 144Nurse hours — State benchmarkedThis home is ranked 68th out of 144 homes in Maryland. Shows adjusted nurse hours per resident per day benchmarked to the Maryland average, with a ranking across 144 Maryland facilities. More hours mean more direct care. The national average is about 3.5 hrs; below 3.0 is a red flag.Click the rank badge to see the full State ranking.Click here to see the full State ranking.
This facility Maryland avg (4h 17m per day)
vs Maryland avg
-19%

5 of 6 metrics below state avg

Standout metric LPN / LVN is +30% above state avg
Staff type Hours / Day / Resident vs state avg
Registered Nurse (RN) Info RNs hold the highest nursing license and can assess residents, interpret test results, and direct care plans. More RN hours per day often signals stronger clinical oversight and faster response to health changes. 12m per day ▼ 76% State avg: 50m per day · National avg: 41m per day
LPN / LVN Info Licensed Practical Nurses (LPNs) or Licensed Vocational Nurses (LVNs) deliver routine hands-on care — medication administration, wound dressing, and monitoring vital signs. They work under RN supervision and make up a large share of daily bedside care. 1h 10m per day ▲ 30% State avg: 54m per day · National avg: 52m per day
Nurse Aide Info Certified Nurse Aides (CNAs) provide the most direct day-to-day assistance: bathing, dressing, feeding, and mobility. Nurse aide hours are typically the largest staffing category and directly affect residents' quality of life. 1h 54m per day ▼ 13% State avg: 2h 10m per day · National avg: 2h 21m per day
Weekend Total Nursing Info Combined nursing hours (RN + LPN + Nurse Aide) per resident per day on weekends. Staffing often drops on weekends — this figure reveals whether the facility maintains adequate coverage outside of weekday hours. 3h 3m per day ▼ 12% State avg: 3h 29m per day · National avg: 3h 26m per day
Physical Therapist Info Hours per resident per day provided by licensed Physical Therapists (PTs) or PT Assistants. PT services help residents recover mobility after injury or illness and are especially important for post-acute (short-stay) rehabilitation. 4m per day ▼ 30% State avg: 5m per day · National avg: 4m per day
Weekend RN Info Registered nurse hours specifically on weekends. Facilities sometimes reduce RN presence on Saturdays and Sundays — a low weekend RN figure compared to weekday hours can indicate reduced clinical oversight when most administrative staff are absent. 18m per day ▼ 51% State avg: 37m per day · National avg: 29m per day

Capacity and availability

This home usually has availability

Similar occupancy to the Maryland average: 82.4%
Occupancy rate
81.7% Rank #84 / 146Occupancy rate — State benchmarkedThis home is ranked 84th out of 146 homes in Maryland. Shows this facility's occupancy rate versus the Maryland average, with its Statewide rank out of 146. Higher occupancy signals strong local demand and financial stability.Click the rank badge to see the full State ranking.Click here to see the full State ranking.
Avg. Length of Stay
137 days
Years in operation
33 years in operation Rank #24 / 208Years in operation — State benchmarkedThis home is ranked 24th out of 208 homes in Maryland. Shows how long this facility has been in operation compared to other Maryland facilities. Longer operating histories may benefit residents, families, and staff.Click the rank badge to see the full State ranking.Click here to see the full State ranking.
A longer operating history, which may indicate experience navigating regulations and delivering ongoing care.
Walk Score
Walk Score: 59 / 100 Rank #327 / 985Walk Score — State benchmarkedThis home is ranked 327th out of 985 homes in Maryland. Shows how walkable this facility's neighborhood is compared to the average Walk Score across Maryland facilities. Higher scores benefit residents, families, and staff.Click the rank badge to see the full State ranking.Click here to see the full State ranking.
Moderately walkable. Some errands can be accomplished on foot, with a mix of nearby amenities.

About this community

License Details

CMS Certification Number215215

Staffing

Key information about the people who lead and staff this community.

Leadership

ContactMr. John Rajakumar, Administrator

Contact Autumn Lake Healthcare at Alice Manor

Inspection History

In Maryland, the Department of Health, Office of Health Care Quality is the state agency that conducts unannounced inspections and issues reports for all assisted living and nursing facilities.

Since 2018 · 8 years of data 55 citations

Inspection Scorecard Info This scorecard compares key inspection, citation, and complaint metrics at this facility against the Maryland state average. Metrics rated ≥15% worse than average are highlighted in red; those ≥15% better are highlighted in green.

Since 2018 vs. Maryland state average
Overall vs. MD average 2 Worse Metrics worse than Maryland average:
• Total citations (1275% above)
• Citations per year (1280% above)
0 Better No metrics in this bucket.
Latest Inspection May 1, 2025 Complaint Investigation

Citations Info Citations are formal regulatory issues recorded during state inspections.

This Facility MD Average vs. MD Avg
Total citations Info Formal regulatory issues recorded by inspectors across all inspection types. 55 4 This facility has 1275% more total citations than a typical Maryland nursing home (55 vs. MD avg 4).↑ 1275% worse
Citations per year Info Average citations per year since 2018. 6.9 0.5 This facility has 1280% more citations per year than a typical Maryland nursing home (6.9 vs. MD avg 0.5).↑ 1280% worse

Inspection Reports Summary Info An editor-reviewed summary of the themes and findings across this facility's recent inspection reports.

  • May 1, 2025 inspection found 14 deficiencies including unsafe environment, insufficient nursing staff, medication errors, infection control lapses, and delayed dental care, all substantiated by multiple complaints.
  • November 20, 2024 survey documented 12 deficiencies with harm-level medication errors, unreported and uninvestigated abuse, poor wound care, and failure to protect residents from verbal and sexual abuse.
  • June 14, 2021 annual inspection cited 23 deficiencies involving poor housekeeping, inaccurate assessments, incomplete care plans, inadequate infection control, and failure to provide timely pharmacy and dental services.

Health Inspection History

Inspections since 2018
Total health inspections 4

Maryland average 3.9


Last Health inspection on May 2025

Total health citations
54 Rank #97 / 146Health citations — State benchmarkedThis home is ranked 97th out of 146 homes in Maryland. Shows this facility's total health deficiency citations benchmarked to the Maryland State average, with a ranking across all 146 MD facilities. Lower citation counts earn a better rank.Click the rank badge to see the full State ranking.Click here to see the full State ranking.

Maryland average 49.9

Citations per inspection
13.5 Rank #93 / 146Citations per inspection — State benchmarkedThis home is ranked 93rd out of 146 homes in Maryland. Shows average deficiency citations per CMS inspection for this facility versus the Maryland mean across 146 facilities with citation data. Lower is better.Click the rank badge to see the full State ranking.Click here to see the full State ranking.

Maryland average 12.81


Health citations are formal notices following inspections when they fail to comply with safety and care standards.

28 of 54 citations resulted from standard inspections; 14 of 54 resulted from complaint investigations; and 12 of 54 came from combined inspections (standard and complaint).

Breakdown of citation severity (last 8 years)
Critical health citations
0
100% better than Maryland average

Maryland average: 0.5


Serious health citations
1
67% worse than Maryland average

Maryland average: 0.6

0 critical citations Maryland average: 0.5

1 serious citation Maryland average: 0.6

49 moderate citations Maryland average: 47.2

4 minor citations Maryland average: 1.7
Citations history (last 8 years)
Infection Control moderate citation May 01, 2025
Corrected

Nursing Services moderate citation May 01, 2025
Corrected

Nursing Services moderate citation May 01, 2025
Corrected

Nursing Services moderate citation May 01, 2025
Corrected

Staffing Data

Reporting period: October 1 – December 31, 2025 (Q4 2025). Source: CMS Payroll-Based Journal report.

Total staff 386
Employees 88
Contractors 298
Staff to resident ratio 4.29 : 1
136% more staff per resident than Maryland average
Maryland average ratio: 1.81 : 1 Maryland average ratio: 1.81 : 1See full Maryland ranking
Avg staff/day 45
Average shift 8.5 hours
6% better than Maryland average
Maryland average: 8 hours Maryland average shift: 8 hoursSee full Maryland ranking
Total staff hours (quarter) 35,026

Nursing staff breakdown

Q4 2025 · Oct 1 – Dec 31 More info This data comes from the CMS Payroll-Based Journal report covering October 1 – December 31, 2025.
Registered Nurse

Manages medical care and health needs.

RN Staff Info 26 total: 3 full-time employees and 23 contractors. 26
Average shift length Info Average shift length. Calculated as total hours divided by days worked and average staff per day. 9.4 hours
Licensed Practical Nurse

Assists with medical care and medications.

LPN Staff Info 117 total: 10 full-time employees and 107 contractors. 117
Average shift length Info Average shift length. Calculated as total hours divided by days worked and average staff per day. 10.5 hours
Certified Nursing Assistant

Helps with daily care and mobility.

CNA Staff Info 205 total: 53 full-time employees and 152 contractors. 205
Average shift length Info Average shift length. Calculated as total hours divided by days worked and average staff per day. 7.9 hours

Contractor staffing

Q4 2025 · Oct 1 – Dec 31 More info This data comes from the CMS Payroll-Based Journal report covering October 1 – December 31, 2025.

Total hours from contractors

36%

12,618 contractor hours this quarter

Certified Nursing Assistant: 152 Licensed Practical Nurse: 107 Registered Nurse: 23 Qualified Social Worker: 4 Physical Therapy Aide: 4 Physical Therapy Assistant: 3 Respiratory Therapy Technician: 3 Speech Language Pathologist: 2

Staff by category

Q4 2025 · Oct 1 – Dec 31 More info This data comes from the CMS Payroll-Based Journal report covering October 1 – December 31, 2025.
Certified Nursing Assistant 53 152 205 15,636 92 100% 7.9
Licensed Practical Nurse 10 107 117 8,992 92 100% 10.5
Physical Therapist 7 0 7 2,166 92 100% 7.6
RN Director of Nursing 4 0 4 1,192 68 74% 7.8
Registered Nurse 3 23 26 1,186 66 72% 9.4
Medication Aide/Technician 3 0 3 879 70 76% 11.7
Dietitian 2 0 2 869 80 87% 7.7
Respiratory Therapy Technician 0 3 3 512 69 75% 7.1
Nurse Practitioner 1 0 1 488 61 66% 8
Administrator 1 0 1 472 59 64% 8
Physical Therapy Aide 0 4 4 457 63 68% 7.3
Qualified Social Worker 0 4 4 457 59 64% 6.2
Dental Services Staff 1 0 1 456 57 62% 8
Speech Language Pathologist 0 2 2 445 59 64% 7.3
Other Dietary Services Staff 1 0 1 408 51 55% 8
Physical Therapy Assistant 0 3 3 362 55 60% 6.3
Clinical Nurse Specialist 2 0 2 52 10 11% 5.2
205 Certified Nursing Assistant
% of Days 100%
117 Licensed Practical Nurse
% of Days 100%
7 Physical Therapist
% of Days 100%
4 RN Director of Nursing
% of Days 74%
26 Registered Nurse
% of Days 72%
3 Medication Aide/Technician
% of Days 76%
2 Dietitian
% of Days 87%
3 Respiratory Therapy Technician
% of Days 75%
1 Nurse Practitioner
% of Days 66%
1 Administrator
% of Days 64%
4 Physical Therapy Aide
% of Days 68%
4 Qualified Social Worker
% of Days 64%
1 Dental Services Staff
% of Days 62%
2 Speech Language Pathologist
% of Days 64%
1 Other Dietary Services Staff
% of Days 55%
3 Physical Therapy Assistant
% of Days 60%
2 Clinical Nurse Specialist
% of Days 11%

Penalties and fines

Federal penalties imposed by CMS for regulatory violations, including civil money penalties (fines) and denials of payment for new Medicare/Medicaid admissions.

Source: CMS Penalties Database

No penalties in the past 3 years

No civil money penalties or payment denials were reported in the last 3 years.

Quality of care over time

These measures show how residents usually do over time at this home, based on health outcomes and preventive care.

High-risk clinical events score Info A composite score based on pressure ulcers, falls with injury, weight loss, walking ability decline, and activities of daily living decline. 13.8
7% worse than Maryland average

Maryland average: 12.9

Functional decline score Info A composite score based on activities of daily living decline, walking ability decline, and incontinence. 29.0
13% worse than Maryland average

Maryland average: 25.7

Long-stay resident measures
Significantly above average Maryland avg: 3.7 Info CMS star rating based on long-stay quality measure performance. 5 stars = significantly above average, 1 star = significantly below average.
Need for Help with Daily Activities Increased Info Percent of long-stay residents whose need for help with daily activities has increased 28.7%
21% worse than Maryland average

Maryland average: 23.7%

Walking Ability Worsened Info Percent of long-stay residents whose ability to move independently worsened 28.9%
In line with Maryland average

Maryland average: 27.7%

Low Risk Residents with Bowel/Bladder Incontinence Info Percent of low risk long-stay residents who lose control of their bowels or bladder 29.5%
14% worse than Maryland average

Maryland average: 25.9%

Falls with Major Injury Info Percent of long-stay residents experiencing one or more falls with major injury 0.3%
88% better than Maryland average

Maryland average: 2.3%

High Risk Residents with Pressure Ulcers Info Percent of long-stay high risk residents with pressure ulcers 6.6%
In line with Maryland average

Maryland average: 6.5%

Urinary Tract Infection Info Percent of long-stay residents with a urinary tract infection 0.0%
100% better than Maryland average

Maryland average: 1.6%

Lost Too Much Weight Info Percent of long-stay residents who lose too much weight 4.7%
19% better than Maryland average

Maryland average: 5.8%

Depressive Symptoms Info Percent of long-stay residents who have depressive symptoms 71.7%
255% worse than Maryland average

Maryland average: 20.2%

Antipsychotic Use Info Percent of long-stay residents who received an antipsychotic medication 5.3%
59% better than Maryland average

Maryland average: 12.9%

Pneumococcal Vaccine Info Percent of long-stay residents assessed and appropriately given the pneumococcal vaccine 93.0%
In line with Maryland average

Maryland average: 92.0%

Influenza Vaccine Info Percent of long-stay residents assessed and appropriately given the seasonal influenza vaccine 99.0%
In line with Maryland average

Maryland average: 96.6%

Hospitalizations per 1,000 days Info Number of hospitalizations per 1,000 long-stay resident days. 1.00
24% better than Maryland average

Maryland average: 1.32

ED visits per 1,000 days Info Number of outpatient emergency department visits per 1,000 long-stay resident days. 1.11
8% better than Maryland average

Maryland average: 1.21

Short-stay resident measures
Significantly above average Maryland avg: 3.7 Info CMS star rating based on short-stay quality measure performance. 5 stars = much above average, 1 star = much below average.
Pneumococcal Vaccine Info Percent of short-stay residents assessed and appropriately given the pneumococcal vaccine 81.6%
In line with Maryland average

Maryland average: 78.4%

Antipsychotic medication increase Info Percent of short-stay residents who newly received an antipsychotic medication 0.0%
100% better than Maryland average

Maryland average: 1.4%

Influenza Vaccine Info Percent of short-stay residents assessed and appropriately given the seasonal influenza vaccine 77.0%
In line with Maryland average

Maryland average: 80.6%

Re-hospitalized after SNF stay Info Percentage of short-stay residents who were re-hospitalized after their nursing home admission. 20.6%
In line with Maryland average

Maryland average: 21.2%

Emergency department visits Info Percentage of short-stay residents who had an outpatient emergency department visit. 8.6%
13% better than Maryland average

Maryland average: 9.9%

Falls with major injury Info Percentage of SNF residents who experience falls with major injury during their stay. 0.0%
100% better than Maryland average

Maryland average: 0.8%

Ability to care for self at discharge Info Percentage of residents at or above expected ability to care for themselves at discharge. 43.2%
19% worse than Maryland average

Maryland average: 53.7%

Successful return to home or community Info Rate of successful return to home or community from a skilled nursing facility. 55.1%
9% better than Maryland average

Maryland average: 50.6%

Breakdown by payment type

Medicare

24% of new residents, usually for short-term rehab.

Typical stay 1 - 2 months

Private pay

35% of new residents, often for short stays.

Typical stay 27 days

Medicaid

40% of new residents, often for long-term daily care.

Typical stay 10 - 11 months

Facility Characteristics

Source: CMS Long-Term Care Facility Characteristics (Data as of Jan 2026)

Total residents 90
Medicare
3
3.3% of residents
Medicaid
73
81.1% of residents
Private pay or other
14
15.6% of residents
Programs & Services
Residents Group

Residents meet regularly to discuss policies, care quality, and activities

Active Resident Council

Organized group of residents that meets regularly to discuss facility policies, quality of life, and activities.

Finances and operations

Based on the 2023 CMS SNF Cost Report.

Privately-owned community
Operated by a single business entity.
Home revenue
$12.9M
Profit
$505.9K
Privately-owned community Operated by a single business entity.
Home revenue
$12.9M Rank #115 / 145Revenue — State benchmarkedThis home is ranked 115th out of 145 homes in Maryland. Shows this facility's annual revenue compared to the Maryland average. Higher revenue generally means more resources for staffing and capital — read alongside Payroll %.Click the rank badge to see the full State ranking.Click here to see the full State ranking.
Profit
$505.9K
Payroll costs Info The portion of the home's budget spent on staff, including nurses, caregivers, and other employees who support care and operations. Rank #109 / 145Payroll — State benchmarkedThis home is ranked 109th out of 145 homes in Maryland. Shows total annual staff payroll benchmarked to the Maryland average. Higher payroll investment relative to peers often signals better staffing and less reliance on cheaper contract labor.Click the rank badge to see the full State ranking.Click here to see the full State ranking.
$6.4M
49.6% of revenue Rank #43 / 145Payroll % — State benchmarkedThis home is ranked 43rd out of 145 homes in Maryland. Shows payroll as a percentage of revenue versus the Maryland average. Well-run Maryland facilities typically land around 49–57% — the top third Statewide. Below 25% may signal understaffing or heavy agency use — read with Staffing ratings.Click the rank badge to see the full State ranking.Click here to see the full State ranking.
Other operating costs Info All remaining costs needed to run the home, such as food, utilities, building maintenance, supplies and administrative expenses.
$6.0M
Total costs $12.4M

Who this home usually serves

TYPE OF STAY

Mostly long-term care residents

Most residents stay for extended periods and receive ongoing daily care.

New residents most often arrive under Medicaid (40% of admissions), and a typical Medicaid stay runs around 10 - 11 months.

Admissions
215 total

Coverage residents most often arrive under.

Medicare 24%
Private pay 35%
Medicaid 40%
Discharges
228 total

Coverage residents most often leave under.

Medicare 17%
Private pay 31%
Medicaid 52%

Places of interest near Autumn Lake Healthcare at Alice Manor

Address 3.6 miles from city center Info Estimated distance in miles from Baltimore's city center to Autumn Lake Healthcare at Alice Manor's address, calculated via Google Maps. — 1.48 miles to nearest hospital (Sinai Hospital)

Calculate Travel Distance to Autumn Lake Healthcare at Alice Manor

Add your location

Address

Financial Assistance for
Nursing Home in Maryland

Autumn Lake Healthcare at Alice Manor is located in Baltimore, Maryland.
Here are the financial assistance programs available to residents in Maryland.

Get Financial aid guidance

Community Options Waiver

Maryland Medicaid Community Options Waiver

Age 65+ or disabled
General Maryland resident, Medicaid- eligible, nursing home-level care need.
Income Limits (2025) ~$2,829/month 300% FBR, individual
Asset Limits $2,000 (individual), $3,000 (couple) (excludes home, car).
MD

High urban demand; rural outreach efforts.

Benefits
Personal care (5-7 hours/day, e.g., bathing, dressing) Respite care (up to 240 hours/year) Adult day care ($70/day) Home modifications ($1,500 avg.)

Senior Care Program

Maryland Senior Care

Age 65+
General Maryland resident, at risk of nursing home placement.
Income Limits ~$2,000/month individual, varies by county
Asset Limits $11,000 individual
MD

Limited funding; waitlists common in high-demand areas.

Benefits
In-home care (3-5 hours/week) Respite care (up to 10 days/year) Meals (~$6/meal) Transportation (~5 trips/month) Case management

Maryland Nursing Home Medicaid

Maryland Medical Assistance (Medicaid) Nursing Home Program

Age 65+
General Maryland resident, Medicaid-eligible, requires nursing home-level care.
Income Limits (2025) $943/month (individual); most income applied to care costs.
Asset Limits $2,500 (individual), $3,000 (couple); spousal protections up to $155,356.
MD

Home equity limit $636,000; estate recovery applies post-55.

Benefits
24/7 nursing care Meals Therapy Medications (unlimited per medical need)

Senior Assisted Living Subsidy Program

Maryland Senior Assisted Living Group Home Subsidy

Age 62+
General Maryland resident, in or moving to approved assisted living, low/moderate income.
Income Limits (2025) ~$34,000/year individual, varies by county
Asset Limits Not strict; prioritizes low-income.
MD

Not available statewide; facility must be licensed by MDH.

Benefits
Personal care Meals 24-hour supervision (up to $1,500/month subsidy typical)

Veterans Aid and Attendance (A&A) Benefit

Maryland VA Aid and Attendance

Age
General Wartime veteran/spouse, age 65+ or disabled, needs ADL help, Maryland resident.
Income Limits (2025) Net income minus medical expenses < $1,984/month individual with A&A
Asset Limits $155,356 net worth limit
MD

High veteran population in suburban/rural areas.

Benefits
Cash benefit ($1,478-$2,471/month, varies by status) for care costs

Senior Prescription Drug Assistance Program (SPDAP)

Maryland Senior Prescription Drug Assistance Program

Age 65+
General Maryland resident (6+ months), Medicare Part D enrolled.
Income Limits (2025) $48,560/year individual, 300% FPL
Asset Limits None specified.
MD

Supplements Medicare Part D; annual enrollment required.

Benefits
Up to $40/month premium subsidy Reducing drug costs

Medicare Savings Programs (MSP)

Maryland Medicare Savings Programs

Age 65+
General Maryland resident, Medicare Part A/B enrollee.
Income Limits (2025) $2,014/month (QMB), $2,706/month (SLMB/QI, individual).
Asset Limits $9,090 (individual), $13,630 (couple).
MD

Includes QMB, SLMB, QI categories.

Benefits
Covers premiums (up to $174.70/month Part B) Co-pays Deductibles

Community Personal Assistance Services (CPAS)

Maryland Medicaid Community Personal Assistance Services

Age 65+
General Maryland resident, Medicaid-eligible, needs ADL assistance.
Income Limits (2025) $943/month (individual); spend-down available.
Asset Limits $2,500 (individual), $3,000 (couple).
MD

Consumer-directed option allows hiring family caregivers.

Benefits
Personal care (hours vary, typically 20-30/week) Chores Nurse supervision

Compare Nursing Home around Baltimore

The information below is reported by the Maryland Department of Health, Office of Health Care Quality.

5 facilities compared · CMS & MD Dept. of Health data

Autumn Lake Healthcare at Alice Manor
NH

Nursing Home Licensed facility providing 24/7 skilled nursing care for residents with complex, ongoing medical needs. Staffed by RNs, LPNs, and CNAs. Inspected and star-rated annually by CMS. Accepts Medicare (short-term rehab) and Medicaid (long-term care).

HC

Home Care Professional care delivered in the person's own home — from companionship and errands to skilled nursing and therapy. Allows seniors to age in place. Medicare covers skilled home health when medically necessary.

PC

Palliative Care

RC

Respite Care Short-term temporary care — days to weeks — to give family caregivers a break. Full care provided during the stay. Often used after hospitalization or to trial a facility before a permanent placement decision.

Baltimore (Woodberry)
105
Facility 105
MD AVG 43
Rank #107 / 697
81.7%
Facility 81.7%
MD AVG 82.4%
Rank #84 / 146
-1%
3.47
Facility 3.47
MD AVG 3.77
Rank #68 / 144
-51% -8%
$0
Facility $0
MD AVG $65.0k
Rank #1 / 146
54
Facility 54
MD AVG 49.9
Rank #97 / 146
13.5
Facility 13.5
MD AVG 12.8
Rank #93 / 146
1 95 -
59
Facility 59
MD AVG 43
Rank #327 / 985
Alice Operator LLC
$12.9M
Facility $12.9M
MD AVG $18.7M
Rank #115 / 145
$6.4M
Facility $6.4M
MD AVG $6.5M
Rank #109 / 145
49.6%
Facility 49.6%
MD AVG 38.5%
Rank #43 / 145
215215
Resorts of Augsburg
NH

Nursing Home Licensed facility providing 24/7 skilled nursing care for residents with complex, ongoing medical needs. Staffed by RNs, LPNs, and CNAs. Inspected and star-rated annually by CMS. Accepts Medicare (short-term rehab) and Medicaid (long-term care).

AL

Assisted Living A licensed, long-term care setting for seniors or individuals with disabilities who need help with daily activities — like bathing, dressing, and medication management — but not 24-hour skilled nursing. Offers housing, meals, and around-the-clock support while aiming to maximize resident independence.

IL

Independent Living Lifestyle-focused communities for older adults offering dining, activities, and transportation with minimal personal care. Best for active, independent seniors who want community without medical support.

Baltimore (Gwynn Oak)
131
Facility 131
MD AVG 43
Rank #64 / 697
89.4%
Facility 89.4%
MD AVG 82.4%
Rank #41 / 146
+9%
4.17
Facility 4.17
MD AVG 3.77
Rank #28 / 144
-11% +11%
$23.9k
Facility $23.9k
MD AVG $65.0k
Rank #114 / 146
37
Facility 37
MD AVG 49.9
Rank #60 / 146
12.3
Facility 12.3
MD AVG 12.8
Rank #80 / 146
- 120 -
18
Facility 18
MD AVG 43
Rank #756 / 985
-
$22.6M
Facility $22.6M
MD AVG $18.7M
Rank #48 / 145
$13.6M
Facility $13.6M
MD AVG $6.5M
Rank #25 / 145
60.2%
Facility 60.2%
MD AVG 38.5%
Rank #10 / 145
215193
Autumn Lake Healthcare at BridgePark
NH

Nursing Home Licensed facility providing 24/7 skilled nursing care for residents with complex, ongoing medical needs. Staffed by RNs, LPNs, and CNAs. Inspected and star-rated annually by CMS. Accepts Medicare (short-term rehab) and Medicaid (long-term care).

HC

Home Care Professional care delivered in the person's own home — from companionship and errands to skilled nursing and therapy. Allows seniors to age in place. Medicare covers skilled home health when medically necessary.

PC

Palliative Care

RC

Respite Care Short-term temporary care — days to weeks — to give family caregivers a break. Full care provided during the stay. Often used after hospitalization or to trial a facility before a permanent placement decision.

Baltimore (Central Forest Park)
106
Facility 106
MD AVG 43
Rank #105 / 697
88.9%
Facility 88.9%
MD AVG 82.4%
Rank #47 / 146
+8%
3.77
Facility 3.77
MD AVG 3.77
Rank #46 / 144
-4% 0%
$0
Facility $0
MD AVG $65.0k
Rank #1 / 146
71
Facility 71
MD AVG 49.9
Rank #121 / 146
17.8
Facility 17.8
MD AVG 12.8
Rank #121 / 146
1 84 B-
69
Facility 69
MD AVG 43
Rank #199 / 985
Bp Capital
$16.8M
Facility $16.8M
MD AVG $18.7M
Rank #89 / 145
$7.7M
Facility $7.7M
MD AVG $6.5M
Rank #85 / 145
45.9%
Facility 45.9%
MD AVG 38.5%
Rank #60 / 145
215195
Stadium Place Nursing and Rehab Center
NH

Nursing Home Licensed facility providing 24/7 skilled nursing care for residents with complex, ongoing medical needs. Staffed by RNs, LPNs, and CNAs. Inspected and star-rated annually by CMS. Accepts Medicare (short-term rehab) and Medicaid (long-term care).

Baltimore (Ednor Gardens-Lakeside)
100
Facility 100
MD AVG 43
Rank #117 / 697
41.7%
Facility 41.7%
MD AVG 82.4%
Rank #140 / 146
-49%
3.23
Facility 3.23
MD AVG 3.77
Rank #102 / 144
-51% -14%
$16.6k
Facility $16.6k
MD AVG $65.0k
Rank #1 / 146
55
Facility 55
MD AVG 49.9
Rank #99 / 146
13.8
Facility 13.8
MD AVG 12.8
Rank #96 / 146
2 53 -
72
Facility 72
MD AVG 43
Rank #160 / 985
-
$6.0M
Facility $6.0M
MD AVG $18.7M
Rank #141 / 145
$3.4M
Facility $3.4M
MD AVG $6.5M
Rank #138 / 145
57.1%
Facility 57.1%
MD AVG 38.5%
Rank #16 / 145
215232
Autumn Lake Healthcare at Homewood Center
NH

Nursing Home Licensed facility providing 24/7 skilled nursing care for residents with complex, ongoing medical needs. Staffed by RNs, LPNs, and CNAs. Inspected and star-rated annually by CMS. Accepts Medicare (short-term rehab) and Medicaid (long-term care).

PC

Palliative Care

RC

Respite Care Short-term temporary care — days to weeks — to give family caregivers a break. Full care provided during the stay. Often used after hospitalization or to trial a facility before a permanent placement decision.

Baltimore (Homeland)
112
Facility 112
MD AVG 43
Rank #95 / 697
84.3%
Facility 84.3%
MD AVG 82.4%
Rank #74 / 146
+2%
3.37
Facility 3.37
MD AVG 3.77
Rank #79 / 144
-44% -11%
$0
Facility $0
MD AVG $65.0k
Rank #1 / 146
72
Facility 72
MD AVG 49.9
Rank #122 / 146
24.0
Facility 24.0
MD AVG 12.8
Rank #139 / 146
- 104 -
81
Facility 81
MD AVG 43
Rank #86 / 985
56 West Frederick Holdco LLC
$15.3M
Facility $15.3M
MD AVG $18.7M
Rank #104 / 145
$6.2M
Facility $6.2M
MD AVG $6.5M
Rank #113 / 145
40.4%
Facility 40.4%
MD AVG 38.5%
Rank #107 / 145
215074

Frequently Asked Questions about Autumn Lake Healthcare at Alice Manor

What neighborhood is Autumn Lake Healthcare at Alice Manor in?

Autumn Lake Healthcare at Alice Manor is in the Woodberry neighborhood of Baltimore.

Is Autumn Lake Healthcare at Alice Manor in a walkable area?

Autumn Lake Healthcare at Alice Manor has a walk score of 59. Moderately walkable. Some errands can be accomplished on foot, with a mix of nearby amenities.

What is the occupancy rate at Autumn Lake Healthcare at Alice Manor?

Autumn Lake Healthcare at Alice Manor's occupancy is 81.7%.

Are there photos of Autumn Lake Healthcare at Alice Manor?

Yes — there are 7 photos of Autumn Lake Healthcare at Alice Manor in the photo gallery on this page.

What is the phone number of Autumn Lake Healthcare at Alice Manor?

(410) 889-9700 will put you in contact with the team at Autumn Lake Healthcare at Alice Manor.

Is Autumn Lake Healthcare at Alice Manor Medicare or Medicaid certified?

Yes — Autumn Lake Healthcare at Alice Manor is a CMS-certified provider of Medicare and Medicaid.

Guides for Better Senior Living

Care Cost Calculator: See Prices in Your Area

Nursing Home Data Explorer

Don’t Wait Too Long: 7 Red Flag Signs Your Parent Needs Assisted Living Now

The True Cost of Assisted Living in 2025 – And How Families Are Paying For It

Understanding Senior Living Costs: Pricing Models, Discounts & Financial Assistance

Explore Open Rooms
1 Contact details
2 What type of senior care service are you looking for?
3 What budget do you have in mind for senior care?
4 How soon do you need to find care?
5 Additional details

Thank you for your interest!

Our team will be in touch shortly to help with next steps.