Azria Health Olathe
Nursing Home & Memory Care · Olathe, KS
CMS overall rating Info CMS (the Centers for Medicare & Medicaid Services) is the federal agency that rates nursing home quality. Its Overall Rating runs from 1 to 5 stars, combining health inspections, staffing, and quality measures, with inspections weighted most heavily.

Azria Health Olathe

Nursing Home & Memory Care · Olathe, KS
CMS overall rating Info CMS (the Centers for Medicare & Medicaid Services) is the federal agency that rates nursing home quality. Its Overall Rating runs from 1 to 5 stars, combining health inspections, staffing, and quality measures, with inspections weighted most heavily.
Calculator: See prices in your area
Azria Health Olathe accepts Medicare, Medicaid, and private pay.

Overview of Azria Health Olathe

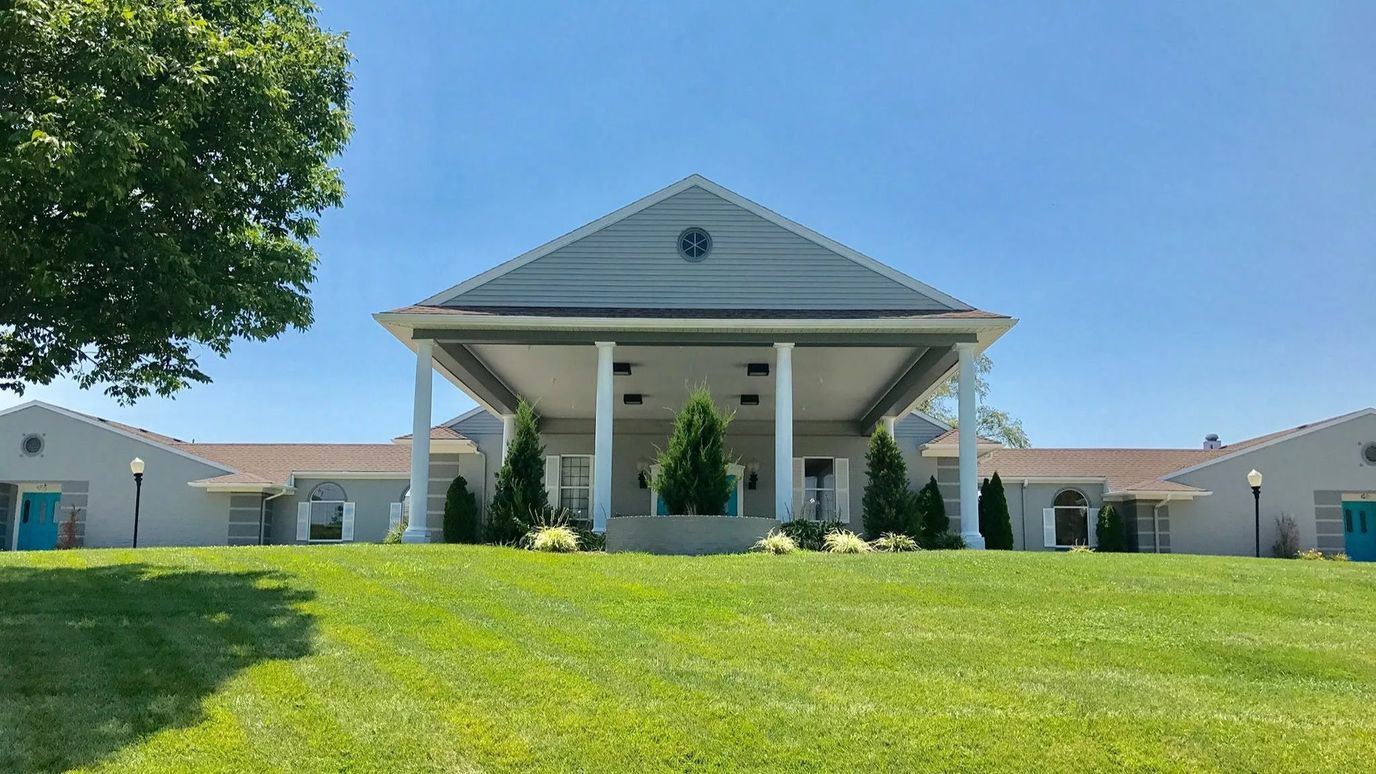
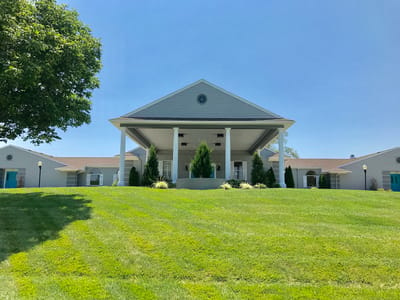
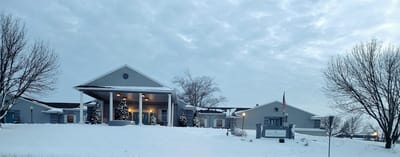
Azria Health Olathe shines as a beacon of excellence in the realm of senior care, offering a multitude of services that encompass everything from skilled nursing to memory care. This distinguished establishment has gained recognition for its commitment to providing top-tier senior living housing, where residents are embraced by a compassionate and dedicated team. The focus on individualized care plans, state-of-the-art programs, and a patient-centered approach makes Azria Health Olathe a preferred choice for seniors seeking a haven of comfort and support.
Nestled in the heart of Olathe, Kansas, Azria Health Olathe radiates a sense of community and belonging. Their dedication to fostering an environment of holistic well-being is evident in the variety of engaging activities and amenities they offer. From expertly prepared dining options to enriching life enrichment lectures, residents can bask in the joys of camaraderie and personal growth. As a testament to their unwavering commitment to senior living housing, Azria Health Olathe has established itself as a trusted partner in the journey towards a fulfilling and vibrant retirement experience.

Quality ratings

Measured by Centers for Medicare & Medicaid Services (CMS)

Overall rating Info The Overall CMS Rating combines results from health inspections, staffing levels and quality measures. Health inspections carry the most weight. Staffing and quality scores can increase or decrease the final rating based on performance compared to state and national standards.
▼ 65.4% Below KS avg. ▼ 65.4% Below KS avg.KS average: 2.9Click the badge to see the full State ranking.Click here to see the full State ranking.
Health Inspection Info Based on the results of the facility's three most recent standard inspections and any complaint investigations. CMS reviews the number, scope, and severity of deficiencies, with more recent findings weighted more heavily.
▼ 63.8% Below KS avg. ▼ 63.8% Below KS avg.KS average: 2.8Click the badge to see the full State ranking.Click here to see the full State ranking.
Staffing Info Measures average nursing staff hours per resident per day, including Registered Nurses (RNs) and total nursing staff. Ratings are adjusted based on the level of care residents require and are compared to state and national benchmarks.
▼ 42.2% Below KS avg. ▼ 42.2% Below KS avg.KS average: 3.5Click the badge to see the full State ranking.Click here to see the full State ranking.
Quality Measures Info Based on clinical and physical health indicators reported to CMS, such as hospital readmissions, falls, pressure ulcers, and improvements in mobility. These measures reflect how well residents' health needs are being managed.
▼ 35.3% Below KS avg. ▼ 35.3% Below KS avg.KS average: 3.1Click the badge to see the full State ranking.Click here to see the full State ranking.

Staffing hours breakdown

Info Daily nursing hours per resident by staff type, reported to CMS. Higher is generally better — compare this facility to state and national averages to see where staffing stands.

Hours per resident per day — compared to Kansas state averages

Total nursing care / resident Info Total adjusted nursing hours per resident per day, combining RN, LPN, and aide time. CMS adjusts this for case-mix so facilities can be fairly compared.
3h 51m per day
This facility Kansas avg (4h 38m per day)
vs Kansas avg
-17%

2 of 6 metrics below state avg

Standout metric LPN / LVN is +87% above state avg
Staff typeHours / Day / Residentvs state avg
Registered Nurse (RN) Info RNs hold the highest nursing license and can assess residents, interpret test results, and direct care plans. More RN hours per day often signals stronger clinical oversight and faster response to health changes. 16m per day ▼ 64% State avg: 43m per day · National avg: 41m per day
LPN / LVN Info Licensed Practical Nurses (LPNs) or Licensed Vocational Nurses (LVNs) deliver routine hands-on care — medication administration, wound dressing, and monitoring vital signs. They work under RN supervision and make up a large share of daily bedside care. 1h 15m per day ▲ 87% State avg: 40m per day · National avg: 52m per day
Nurse Aide Info Certified Nurse Aides (CNAs) provide the most direct day-to-day assistance: bathing, dressing, feeding, and mobility. Nurse aide hours are typically the largest staffing category and directly affect residents' quality of life. 2h 41m per day ■ Avg State avg: 2h 42m per day · National avg: 2h 21m per day
Weekend Total Nursing Info Combined nursing hours (RN + LPN + Nurse Aide) per resident per day on weekends. Staffing often drops on weekends — this figure reveals whether the facility maintains adequate coverage outside of weekday hours. 3h 53m per day ▲ 8% State avg: 3h 35m per day · National avg: 3h 26m per day
Physical Therapist Info Hours per resident per day provided by licensed Physical Therapists (PTs) or PT Assistants. PT services help residents recover mobility after injury or illness and are especially important for post-acute (short-stay) rehabilitation. 3m per day ▲ 61% State avg: 2m per day · National avg: 4m per day
Weekend RN Info Registered nurse hours specifically on weekends. Facilities sometimes reduce RN presence on Saturdays and Sundays — a low weekend RN figure compared to weekday hours can indicate reduced clinical oversight when most administrative staff are absent. 16m per day ▼ 46% State avg: 29m per day · National avg: 29m per day

Capacity and availability

This home usually has availability

Similar occupancy to the Kansas average: 79.5%
Occupancy rate
79.4%
Avg. Length of Stay
185 days
Bed community size
125-bed community Rank #17 / 224Bed count — State benchmarkedThis home is ranked 17th out of 224 homes in Kansas. Shows this facility's certified or reported bed count compared to other Kansas facilities. Larger communities may offer more amenities, programs, and on-site services for residents and families.Rankings are based only on facilities in Kansas that report data for that category. Facilities without available data are excluded from the ranking.Click the rank badge to see the full State ranking.Click here to see the full State ranking.
A larger shared setting that may offer more common spaces and organized community services.
Walk Score
Walk Score: 52 / 100 Rank #155 / 363Walk Score — State benchmarkedThis home is ranked 155th out of 363 homes in Kansas. Shows how walkable this facility's neighborhood is compared to the average Walk Score across Kansas facilities. Higher scores benefit residents, families, and staff.Rankings are based only on facilities in Kansas that report data for that category. Facilities without available data are excluded from the ranking.Click the rank badge to see the full State ranking.Click here to see the full State ranking.
Moderately walkable. Some errands can be accomplished on foot, with a mix of nearby amenities.

About this community

Awards

Five-Star Quality Rated
Recipient of 2015
2016 and 2018 KACE Award for Excellence in Quality Care

Payment & Insurance

1 service
Accept Medicare

Therapy & Rehabilitation

3 services
Rehabilitation Services
Respite Care
Short-Term Rehab

Staffing & Medical

1 service
24-Hour Staffing

Additional Services

2 services
Post-Acute Rehabilitation
Specialized Care Programs

Amenities & Lifestyle

Complimentary Wi-Fi
Chef-Prepared Menus
Private Dining Room
Beauty Salon And Spa Services
Life-Enriching Lectures And Presentations
Interpreters
Private Lounge
Media Room
Library And Reading Center
Pet Visitation
Laundry Services

Dining & Nutrition

Food DescriptionChef-prepared menus and private dining room available.

Contact Azria Health Olathe

Staffing Data

Reporting period: October 1 – December 31, 2025 (Q4 2025). Source: CMS Payroll-Based Journal report.

Total staff 230
Employees 172
Contractors 58
Staff to resident ratio 2.21 : 1
0% compared with Kansas average
Kansas average ratio: 2.24 : 1 Kansas average ratio: 2.24 : 1See full Kansas ranking
Avg staff/day 60
Average shift 9 hours
17% better than Kansas average
Kansas average: 7.7 hours Kansas average shift: 7.7 hoursSee full Kansas ranking
Total staff hours (quarter) 49,613

Nursing staff breakdown

Q4 2025 · Oct 1 – Dec 31 More info This data comes from the CMS Payroll-Based Journal report covering October 1 – December 31, 2025.
Registered Nurse

Manages medical care and health needs.

RN Staff Info 21 total: 7 full-time employees and 14 contractors. 21
Average shift length Info Average shift length. Calculated as total hours divided by days worked and average staff per day. 10 hours
Licensed Practical Nurse

Assists with medical care and medications.

LPN Staff Info 47 total: 35 full-time employees and 12 contractors. 47
Average shift length Info Average shift length. Calculated as total hours divided by days worked and average staff per day. 9.3 hours
Certified Nursing Assistant

Helps with daily care and mobility.

CNA Staff Info 116 total: 87 full-time employees and 29 contractors. 116
Average shift length Info Average shift length. Calculated as total hours divided by days worked and average staff per day. 9.4 hours

Contractor staffing

Q4 2025 · Oct 1 – Dec 31 More info This data comes from the CMS Payroll-Based Journal report covering October 1 – December 31, 2025.

Total hours from contractors

6.4%

3,165 contractor hours this quarter

Certified Nursing Assistant: 29 Registered Nurse: 14 Licensed Practical Nurse: 12 Occupational Therapy Aide: 1 Medical Director: 1 Occupational Therapy Assistant: 1

Staff by category

Q4 2025 · Oct 1 – Dec 31 More info This data comes from the CMS Payroll-Based Journal report covering October 1 – December 31, 2025.
Certified Nursing Assistant872911626,03392100%9.4
Licensed Practical Nurse35124711,94392100%9.3
Medication Aide/Technician9092,0279098%10.1
Registered Nurse714212,0018795%10
Physical Therapy Assistant9091,7067683%6.3
Dietitian4041,0858087%7.8
RN Director of Nursing3031,0646874%8.5
Mental Health Service Worker2029316975%8.9
Qualified Social Worker3038726672%6.1
Respiratory Therapy Technician8085616672%5.4
Nurse Practitioner1014645863%8
Speech Language Pathologist1012633639%7.3
Clinical Nurse Specialist2022562830%8
Administrator1012483134%8
Occupational Therapy Aide0111113336%3.4
Medical Director011261314%2
Occupational Therapy Assistant0112433%7.8
116 Certified Nursing Assistant
% of Days 100%
47 Licensed Practical Nurse
% of Days 100%
9 Medication Aide/Technician
% of Days 98%
21 Registered Nurse
% of Days 95%
9 Physical Therapy Assistant
% of Days 83%
4 Dietitian
% of Days 87%
3 RN Director of Nursing
% of Days 74%
2 Mental Health Service Worker
% of Days 75%
3 Qualified Social Worker
% of Days 72%
8 Respiratory Therapy Technician
% of Days 72%
1 Nurse Practitioner
% of Days 63%
1 Speech Language Pathologist
% of Days 39%
2 Clinical Nurse Specialist
% of Days 30%
1 Administrator
% of Days 34%
1 Occupational Therapy Aide
% of Days 36%
1 Medical Director
% of Days 14%
1 Occupational Therapy Assistant
% of Days 3%

Penalties and fines

Includes penalties issued in 2024

Federal penalties imposed by CMS for regulatory violations, including civil money penalties (fines) and denials of payment for new Medicare/Medicaid admissions.

Source: CMS Penalties Database (Data as of Jan 2026)

Total fines amount $23K
48% lower than Kansas average

Kansas average: $44K

Number of fines 1
59% fewer fines than Kansas average

Kansas average: 2.4

Payment Denials Info Serious action where Medicare and/or Medicaid temporarily stops payments for new residents until issues are fixed. 1
200% more payment denials than Kansas average

Kansas average: 0.3

Fines amount comparison
This facility $23K
Kansas average $44K
Penalty History

Penalties are imposed by CMS for violations of federal nursing home regulations.

2 penalties in the past 3 years

Multiple penalties were reported in the last 3 years.

Civil Money Penalty Info Fines imposed for noncompliance, which can be assessed per day or per instance of violation. Feb 6, 2024
$23K
Payment Denial Info Serious action where Medicare and/or Medicaid temporarily stops payments for new residents until issues are fixed. Feb 6, 2024
24 days

Last updated: Jan 2026

Quality of care over time

These measures show how residents usually do over time at this home, based on health outcomes and preventive care.

High-risk clinical events score Info A composite score based on pressure ulcers, falls with injury, weight loss, walking ability decline, and activities of daily living decline. 13.0
24% worse than Kansas average

Kansas average: 10.5

Functional decline score Info A composite score based on activities of daily living decline, walking ability decline, and incontinence. 29.6
43% worse than Kansas average

Kansas average: 20.7

Long-stay resident measures
Significantly below average Kansas avg: 3.0 Info CMS star rating based on long-stay quality measure performance. 5 stars = significantly above average, 1 star = significantly below average.
Need for Help with Daily Activities Increased Info Percent of long-stay residents whose need for help with daily activities has increased 22.3%
17% worse than Kansas average

Kansas average: 19.0%

Walking Ability Worsened Info Percent of long-stay residents whose ability to move independently worsened 34.5%
78% worse than Kansas average

Kansas average: 19.4%

Low Risk Residents with Bowel/Bladder Incontinence Info Percent of low risk long-stay residents who lose control of their bowels or bladder 32.1%
35% worse than Kansas average

Kansas average: 23.8%

Falls with Major Injury Info Percent of long-stay residents experiencing one or more falls with major injury 3.6%
18% better than Kansas average

Kansas average: 4.4%

High Risk Residents with Pressure Ulcers Info Percent of long-stay high risk residents with pressure ulcers 3.3%
29% better than Kansas average

Kansas average: 4.6%

Urinary Tract Infection Info Percent of long-stay residents with a urinary tract infection 2.9%
6% better than Kansas average

Kansas average: 3.1%

Lost Too Much Weight Info Percent of long-stay residents who lose too much weight 1.4%
73% better than Kansas average

Kansas average: 5.1%

Depressive Symptoms Info Percent of long-stay residents who have depressive symptoms 8.0%
55% worse than Kansas average

Kansas average: 5.2%

Antipsychotic Use Info Percent of long-stay residents who received an antipsychotic medication 20.2%
19% worse than Kansas average

Kansas average: 16.9%

Pneumococcal Vaccine Info Percent of long-stay residents assessed and appropriately given the pneumococcal vaccine 81.4%
11% worse than Kansas average

Kansas average: 91.9%

Influenza Vaccine Info Percent of long-stay residents assessed and appropriately given the seasonal influenza vaccine 96.8%
In line with Kansas average

Kansas average: 95.5%

Hospitalizations per 1,000 days Info Number of hospitalizations per 1,000 long-stay resident days. 2.83
54% worse than Kansas average

Kansas average: 1.84

ED visits per 1,000 days Info Number of outpatient emergency department visits per 1,000 long-stay resident days. 1.32
39% better than Kansas average

Kansas average: 2.16

Short-stay resident measures
Average Kansas avg: 2.6 Info CMS star rating based on short-stay quality measure performance. 5 stars = much above average, 1 star = much below average.
Pneumococcal Vaccine Info Percent of short-stay residents assessed and appropriately given the pneumococcal vaccine 60.0%
21% worse than Kansas average

Kansas average: 75.6%

Antipsychotic medication increase Info Percent of short-stay residents who newly received an antipsychotic medication 4.2%
92% worse than Kansas average

Kansas average: 2.2%

Influenza Vaccine Info Percent of short-stay residents assessed and appropriately given the seasonal influenza vaccine 29.6%
60% worse than Kansas average

Kansas average: 73.5%

Re-hospitalized after SNF stay Info Percentage of short-stay residents who were re-hospitalized after their nursing home admission. 26.1%
13% worse than Kansas average

Kansas average: 23.0%

Emergency department visits Info Percentage of short-stay residents who had an outpatient emergency department visit. 3.5%
70% better than Kansas average

Kansas average: 11.7%

Falls with major injury Info Percentage of SNF residents who experience falls with major injury during their stay. 1.6%
103% worse than Kansas average

Kansas average: 0.8%

Ability to care for self at discharge Info Percentage of residents at or above expected ability to care for themselves at discharge. 27.5%
49% worse than Kansas average

Kansas average: 53.7%

Breakdown by payment type

Medicare

21% of new residents, usually for short-term rehab.

Typical stay 21 days

Private pay

70% of new residents, often for short stays.

Typical stay 1 months

Medicaid

8% of new residents, often for long-term daily care.

Typical stay 5 - 6 years

Facility Characteristics

Source: CMS Long-Term Care Facility Characteristics (Data as of Jan 2026)

Total residents 104
Medicare
8
7.7% of residents
Medicaid
94
90.4% of residents
Private pay or other
2
1.9% of residents
Programs & Services
Residents Group

Residents meet regularly to discuss policies, care quality, and activities

Active Resident Council

Organized group of residents that meets regularly to discuss facility policies, quality of life, and activities.

Finances and operations

Based on CMS SNF Cost Report for fiscal year ending in 12/2023.

Voluntary non-profit community
Operated by a church.
Net patient revenue Info Net patient revenue — what the home actually collects for resident care, after contractual allowances, bad debt and discounts are subtracted from its gross charges (CMS cost report, Worksheet G-3). It covers resident care only; money the home earns from other sources is shown separately as "Other income."
$10.1M
Net patient income Info Net patient income: net patient revenue minus the home's total operating expenses. A positive figure means it earns more from resident care than it spends to deliver it; a negative figure means the opposite. It excludes non-operating "other income."
-$966.8K
Voluntary non-profit community Operated by a church.
Net patient revenue Info Net patient revenue — what the home actually collects for resident care, after contractual allowances, bad debt and discounts are subtracted from its gross charges (CMS cost report, Worksheet G-3). It covers resident care only; money the home earns from other sources is shown separately as "Other income."
$10.1M
Net patient income Info Net patient income: net patient revenue minus the home's total operating expenses. A positive figure means it earns more from resident care than it spends to deliver it; a negative figure means the opposite. It excludes non-operating "other income."
-$966.8K
Other income Info Money the home earns outside of resident care — such as investments, grants, rentals and other non-operating sources (CMS cost report, Worksheet G-3). It is tracked separately from net patient revenue: it is not part of that figure, and it is not included in net patient income.
$99.1K
Payroll costs Info Staff salaries plus wage-related costs — benefits such as payroll taxes, health insurance and retirement — from the home's own accounting records (CMS cost report, Worksheet A). Contract or agency labor is counted separately, under other operating costs.
$6.6M 65.5% of net patient revenue Info Payroll as a share of revenue: staff salaries and wage-related benefits divided by net patient revenue. A higher figure means more of each revenue dollar goes to staff pay.
Other operating costs Info Everything it costs to run the home apart from payroll — food, utilities, supplies, maintenance, contract labor and administration. Calculated as total operating expense minus payroll (staff salaries and wage-related benefits).
$4.5M
Total costs Info The home's total operating expense for the year — all the costs of running it, salaries included (CMS cost report, Worksheet G-3).
$11.1M

Who this home usually serves

TYPE OF STAY

Primarily short stays

Residents typically stay for brief periods, with frequent admissions and discharges throughout the year.

Most new residents arrive under private pay (70% of admissions), and a typical private pay stay runs around 1 months.

Admissions
203 total

Coverage residents most often arrive under.

Medicare 21%
Private pay 70%
Medicaid 8%
Discharges
200 total

Coverage residents most often leave under.

Medicare 8%
Private pay 86%
Medicaid 7%

Places of interest near Azria Health Olathe

Address 1.0 miles from city center Info Estimated distance in miles from Olathe's city center to Azria Health Olathe's address, calculated via Google Maps. — 6.94 miles to nearest hospital (Overland Park Regional Medical Center)

Calculate Travel Distance to Azria Health Olathe

Add your location

Address

Compare Nursing Homes around Olathe

The information below is reported by the Kansas Department for Aging and Disability Services.

3 facilities compared · CMS & KS Dept. of Health data

Aberdeen Village
NH
AL
IL
MC
Olathe (Aberdeen Village)
60
Facility 60
KS AVG 69
Rank #94 / 224
91.6% +15%5.27 +6%+14%$8.0k225.5153-
45
Facility 45
KS AVG 46
Rank #199 / 363
Patricia Cook$14.3M$6.5M45.1%175448
Evergreen Community of Johnson County
NH
AL
IL
MC
Olathe (Downtown)
84
Facility 84
KS AVG 69
Rank #54 / 224
83.3% +5%5.36 +60%+16%$22.9k306.0378-
76
Facility 76
KS AVG 46
Rank #32 / 363
Evergreen Living Innovations Inc$9.6M$7.8M81.8%175355
Azria Health Olathe
NH
MC
Olathe (Dennis Avenue Shops)
125
Facility 125
KS AVG 69
Rank #17 / 224
79.4% 0%3.84 -10%-17%$70.9k299.71114-
52
Facility 52
KS AVG 46
Rank #155 / 363
Azria Olathe Equity LLC$10.1M$6.6M65.5%175557

Financial Assistance for
Nursing Home in Kansas

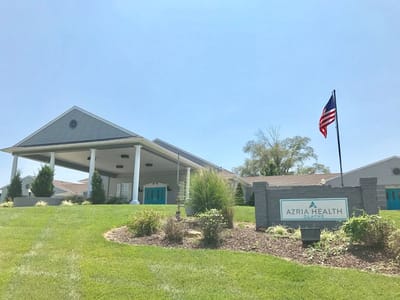
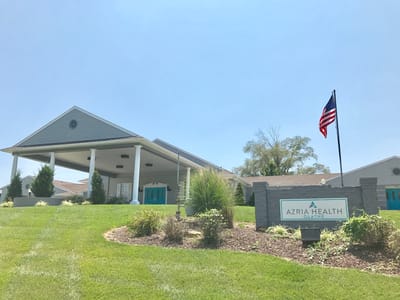
Azria Health Olathe is located in Olathe, Kansas.
Here are the financial assistance programs available to residents in Kansas.

Get Financial aid guidance

Frail Elderly Waiver

Kansas Medicaid FE Waiver

Age 65+
General Kansas resident, Medicaid-eligible, nursing home- level care need.
Income Limits (2025) ~$2,829/month 300% FBR, individual
Asset Limits $2,000 (individual), $3,000 (couple).
KS

Requires care level assessment.

Benefits
Personal care (5-7 hours/day) Respite (240 hours/year) Adult day care (~$60/day) Home aides

Senior Care Act

Kansas SCA

Age 60+
General Kansas resident, at risk of nursing home.
Income Limits ~$1,800/month individual, varies
Asset Limits $2,000 individual
KS

Limited funding; waitlists common.

Benefits
In-home care (3-5 hours/week) Respite (up to 10 days/year) Homemaker services

Medicare Savings Program (MSP)

Kansas Medicare Savings Program

Age 65+ or disabled
General Kansas resident, Medicare Part A/B.
Income Limits (2025) ~$2,510/month (QMB), ~$3,380/month (SLMB), ~$3,598/month (QI)—individual.
Asset Limits $9,430 (individual), $14,130 (couple).
KS

Three tiers; no waitlist.

Benefits
Covers Part B premiums ($174.70/month) Deductibles ($240/year) Copays (~20%)

National Family Caregiver Support Program (NFCSP) Respite

Kansas NFCSP Respite Care

Age
General Caregivers of 60+ needing care or 55+ caregivers of others; Kansas resident; functional needs (2+ ADLs).
Income Limits (2025) Prioritizes ~$24,980/year (individual); no strict cap.
Asset Limits Not assessed; need-based.
KS

11 AAAs; prioritizes low-income, rural caregivers.

Benefits
Respite (4-6 hours/week or 5 days/year) Adult day care ($60/day) Caregiver training

VA Aid and Attendance (A&A) and Housebound Benefits

Kansas VA Aid and Attendance/Housebound

Age 65+ or disabled veteran/spouse
General Kansas resident, wartime service, need for ADL help (A&A) or homebound.
Income Limits (2025) Net income < ~$1,984/month (veteran with dependent, A&A); pension offsets income.
Asset Limits ~$155,356 net worth limit
KS

High veteran demand in rural/urban areas.

Benefits
Cash (~$1,433-$2,642/month veteran, ~$951-$1,318 spouse) for care costs (e.g., in-home, assisted living)

Frequently Asked Questions about Azria Health Olathe

What neighborhood is Azria Health Olathe in?

Azria Health Olathe is in the Dennis Avenue Shops neighborhood.

Is Azria Health Olathe in a walkable area?

Azria Health Olathe has a walk score of 52. Moderately walkable. Some errands can be accomplished on foot, with a mix of nearby amenities.

What is the occupancy rate at Azria Health Olathe?

Azria Health Olathe's occupancy is 79.4%.

Are there photos of Azria Health Olathe?

Yes — there are 10 photos of Azria Health Olathe in the photo gallery on this page.

What is the address of Azria Health Olathe?

Azria Health Olathe is located at 201 E Flaming Rd, Olathe, KS 66061.

What is the phone number of Azria Health Olathe?

(913) 829-2273 will put you in contact with the team at Azria Health Olathe.

Is Azria Health Olathe Medicare or Medicaid certified?

Yes — Azria Health Olathe is a CMS-certified provider of Medicare and Medicaid.

Guides for Better Senior Living

Care Cost Calculator: See Prices in Your Area

Nursing Home Data Explorer

Don’t Wait Too Long: 7 Red Flag Signs Your Parent Needs Assisted Living Now

The True Cost of Assisted Living in 2025 – And How Families Are Paying For It

Understanding Senior Living Costs: Pricing Models, Discounts & Financial Assistance