

Total staff
89
Employees
89
Contractors
0

We arrange tours, appointments, and even moving support so you don’t have to

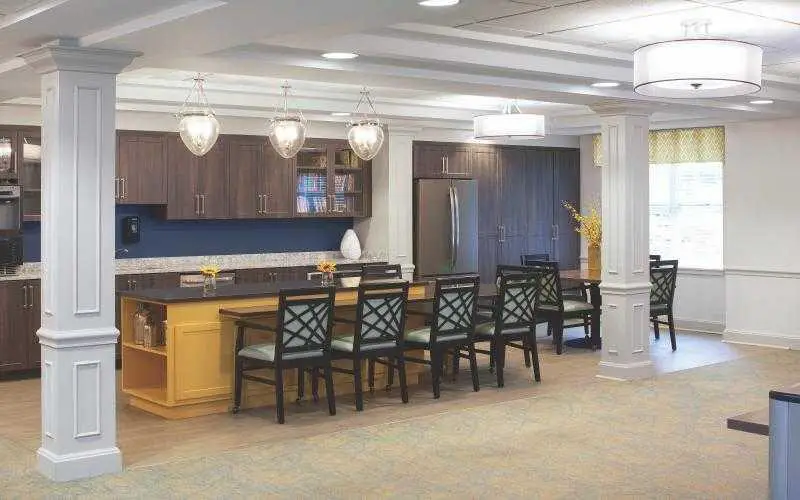
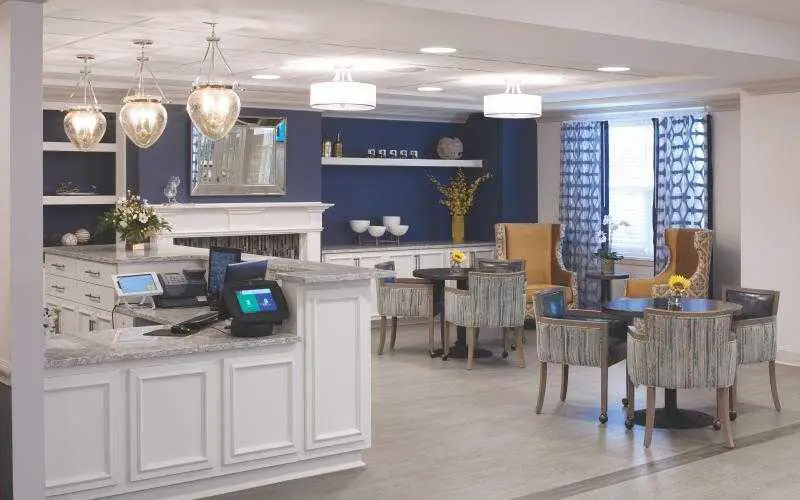
Beaconshire Nursing Center is a trusted healthcare provider in Detroit with skilled therapists providing physical, occupational, and speech therapy to help patients regain their independence and improve their quality of life. Aside from clinical lab and on-site physician services, they also offer podiatry services to address residents’ needs. There are also secure dementia units designed to provide specialized care for residents with memory care impairment.
With round-the-clock care, their experienced staff is always available to provide personalized attention and support. They also take pride in offering fine dining options that cater to our different dietary preferences, and their housekeeping and laundry departments work diligently to maintain a clean and comfortable space. Beaconshire Nursing Center’s patient-centric approach to healthcare is truly remarkable.
| Staff type | Hours / Day / Resident | vs state avg |
|---|---|---|
|
Registered Nurse (RN)
| 9m per day | ▼ 80% State avg: 46m per day · National avg: 41m per day |
|
LPN / LVN
| 32m per day | ▼ 40% State avg: 53m per day · National avg: 52m per day |
|
Nurse Aide
| 28m per day | ▼ 80% State avg: 2h 23m per day · National avg: 2h 21m per day |
|
Weekend Total Nursing
| 53m per day | ▼ 75% State avg: 3h 31m per day · National avg: 3h 26m per day |
|
Weekend RN
| 6m per day | ▼ 79% State avg: 29m per day · National avg: 29m per day |
Reporting period: October 1 – December 31, 2025 (Q4 2025). Source: CMS Payroll-Based Journal report.
Manages medical care and health needs.
Assists with medical care and medications.
Helps with daily care and mobility.
| Certified Nursing Assistant | 41 | 0 | 41 | 17,759 | 92 | 100% | 9.3 |
| Licensed Practical Nurse | 27 | 0 | 27 | 12,288 | 92 | 100% | 9.5 |
| Other Dietary Services Staff | 7 | 0 | 7 | 3,276 | 92 | 100% | 9.3 |
| RN Director of Nursing | 3 | 0 | 3 | 1,679 | 89 | 97% | 8.3 |
| Mental Health Service Worker | 2 | 0 | 2 | 928 | 63 | 68% | 10.4 |
| Nurse Practitioner | 1 | 0 | 1 | 688 | 64 | 70% | 10.8 |
| Clinical Nurse Specialist | 1 | 0 | 1 | 688 | 64 | 70% | 10.8 |
| Dental Services Staff | 1 | 0 | 1 | 688 | 64 | 70% | 10.8 |
| Nurse Aide in Training | 3 | 0 | 3 | 560 | 25 | 27% | 16 |
| Administrator | 1 | 0 | 1 | 448 | 33 | 36% | 13.6 |
| Registered Nurse | 2 | 0 | 2 | 419 | 45 | 49% | 7.6 |
Includes penalties issued in 2023-2025
Federal penalties imposed by CMS for regulatory violations, including civil money penalties (fines) and denials of payment for new Medicare/Medicaid admissions.
Source: CMS Penalties Database (Data as of Jan 2026)
Michigan average: $76K
Michigan average: 2.0
Michigan average: 0.8
Penalties are imposed by CMS for violations of federal nursing home regulations.
6 penalties in the past 3 years
Multiple penalties were reported in the last 3 years.
Last updated: Jan 2026
These measures show how residents usually do over time at this home, based on health outcomes and preventive care.
Michigan average: 8.4
Michigan average: 16.3
Michigan average: 12.5%
Michigan average: 15.3%
Michigan average: 21.0%
Michigan average: 3.2%
Michigan average: 5.7%
Michigan average: 1.7%
Michigan average: 5.7%
Michigan average: 3.9%
Michigan average: 15.0%
Michigan average: 94.9%
Michigan average: 95.0%
Michigan average: 1.74
Michigan average: 1.54
Michigan average: 82.5%
Michigan average: 1.4%
Michigan average: 79.5%
Michigan average: 24.2%
Michigan average: 11.5%
Michigan average: 0.8%
Quality measures are calculated from Minimum Data Set (MDS) assessments. For most measures, lower percentages indicate better care quality.
5% of new residents, usually for short-term rehab.
19% of new residents, often for short stays.
77% of new residents, often for long-term daily care.
Source: CMS Long-Term Care Facility Characteristics (Data as of Jan 2026)
Residents meet regularly to discuss policies, care quality, and activities
Organized group of residents that meets regularly to discuss facility policies, quality of life, and activities.
Data sourced from CMS Long-Term Care Facility Characteristics quarterly report. Payer mix reflects the current resident census by primary payment source.
Historical financial and operational data for Beaconshire Nursing Center based on CMS SNF Cost Reports.
Most residents stay for extended periods and receive ongoing daily care.
![]() 13.4 miles from city center
13.4 miles from city center
![]() Estimated distance in miles from Detroit's city center to Beaconshire Nursing Center's address, calculated via Google Maps.
— 4.16 miles to nearest hospital (Select Specialty Hospital - Northwest Detroit)
Estimated distance in miles from Detroit's city center to Beaconshire Nursing Center's address, calculated via Google Maps.
— 4.16 miles to nearest hospital (Select Specialty Hospital - Northwest Detroit)
Add your location
Beaconshire Nursing Center is located in Detroit, Michigan.
Here are the financial assistance programs available to residents in Michigan.
The information below is reported by the Michigan Department of Licensing and Regulatory Affairs (LARA).
| OakPointe Senior Care & Rehab Center |
NH Nursing Home Licensed facility providing 24/7 skilled nursing care for residents with complex, ongoing medical needs. Staffed by RNs, LPNs, and CNAs. Inspected and star-rated annually by CMS. Accepts Medicare (short-term rehab) and Medicaid (long-term care).
AL Assisted Living A licensed, long-term care setting for seniors or individuals with disabilities who need help with daily activities — like bathing, dressing, and medication management — but not 24-hour skilled nursing. Offers housing, meals, and around-the-clock support while aiming to maximize resident independence. | Detroit (Schulze) | 133 | - | - | 4.36 | -17% | +1% | $0 | 14 | 4.7 | - | 88 | - | 67 | Thomas Ensign | $18.1M | $8.0M | 44.5% | 235207 | ||||
| Qualicare Nursing Home |
NH Nursing Home Licensed facility providing 24/7 skilled nursing care for residents with complex, ongoing medical needs. Staffed by RNs, LPNs, and CNAs. Inspected and star-rated annually by CMS. Accepts Medicare (short-term rehab) and Medicaid (long-term care).
AL Assisted Living A licensed, long-term care setting for seniors or individuals with disabilities who need help with daily activities — like bathing, dressing, and medication management — but not 24-hour skilled nursing. Offers housing, meals, and around-the-clock support while aiming to maximize resident independence. | Detroit (Islandview) | 96 | 94.1% | +24% | 3.26 | -14% | -24% | $0 | 15 | 2.5 | 1 | 96 | A+ | 48 | Carney Bradford | $19.3M | $6.6M | 34.4% | 235622 | ||||
| Allegria Village |
NH Nursing Home Licensed facility providing 24/7 skilled nursing care for residents with complex, ongoing medical needs. Staffed by RNs, LPNs, and CNAs. Inspected and star-rated annually by CMS. Accepts Medicare (short-term rehab) and Medicaid (long-term care).
AL Assisted Living A licensed, long-term care setting for seniors or individuals with disabilities who need help with daily activities — like bathing, dressing, and medication management — but not 24-hour skilled nursing. Offers housing, meals, and around-the-clock support while aiming to maximize resident independence.
IL Independent Living Lifestyle-focused communities for older adults offering dining, activities, and transportation with minimal personal care. Best for active, independent seniors who want community without medical support.
MC Memory Care Secured, specialized care for people living with Alzheimer's or dementia. Staff trained in cognitive impairment, with higher staff-to-resident ratios and an environment designed to reduce confusion and wandering risk. | Dearborn | 132 | 53.0% | -30% | 4.72 | -20% | +10% | $0 | 16 | 3.2 | 1 | 75 | D- | 52 | Firo Operator LLC | $35.3M | $17.0M | 48.2% | 235593 | ||||
| The Orchards at Northwest |
NH Nursing Home Licensed facility providing 24/7 skilled nursing care for residents with complex, ongoing medical needs. Staffed by RNs, LPNs, and CNAs. Inspected and star-rated annually by CMS. Accepts Medicare (short-term rehab) and Medicaid (long-term care).
AL Assisted Living A licensed, long-term care setting for seniors or individuals with disabilities who need help with daily activities — like bathing, dressing, and medication management — but not 24-hour skilled nursing. Offers housing, meals, and around-the-clock support while aiming to maximize resident independence.
MC Memory Care Secured, specialized care for people living with Alzheimer's or dementia. Staff trained in cognitive impairment, with higher staff-to-resident ratios and an environment designed to reduce confusion and wandering risk.
RC Respite Care Short-term temporary care — days to weeks — to give family caregivers a break. Full care provided during the stay. Often used after hospitalization or to trial a facility before a permanent placement decision. | Detroit (Hubbell-Puritan) | 140 | 83.3% | +10% | 3.79 | -61% | -12% | $15.9k | 39 | 6.5 | 1 | 115 | - | 51 | Northwest Opco Holdco LLC | $13.5M | $6.2M | 46.3% | 235539 | ||||
| Beaconshire Nursing Center |
NH Nursing Home Licensed facility providing 24/7 skilled nursing care for residents with complex, ongoing medical needs. Staffed by RNs, LPNs, and CNAs. Inspected and star-rated annually by CMS. Accepts Medicare (short-term rehab) and Medicaid (long-term care).
AL Assisted Living A licensed, long-term care setting for seniors or individuals with disabilities who need help with daily activities — like bathing, dressing, and medication management — but not 24-hour skilled nursing. Offers housing, meals, and around-the-clock support while aiming to maximize resident independence. | Detroit (Evergreen Lahser 7/8) | 99 | - | - | - | -78% | - | $42.6k | 51 | 4.3 | 4 | 96 | - | 63 | Trina Lafferty | $18.4M | $4.8M | 26.3% | 235475 |
Beaconshire Nursing Center is in the Evergreen Lahser 7/8 neighborhood.
Beaconshire Nursing Center has a walk score of 63. Moderately walkable. Some errands can be accomplished on foot, with a mix of nearby amenities.
Yes — there are 3 photos of Beaconshire Nursing Center in the photo gallery on this page.
(313) 534-8400 will put you in contact with the team at Beaconshire Nursing Center.
Yes — Beaconshire Nursing Center is a CMS-certified provider of Medicare and Medicaid.
Care Cost Calculator: See Prices in Your Area
Nursing Home Data Explorer
Don’t Wait Too Long: 7 Red Flag Signs Your Parent Needs Assisted Living Now
The True Cost of Assisted Living in 2025 – And How Families Are Paying For It
Understanding Senior Living Costs: Pricing Models, Discounts & Financial Assistance


Thank you for your interest!
Our team will be in touch shortly to help with next steps.
