Total health inspections
12
Colorado average 4.8
Last Health inspection on Nov 2025

We arrange tours, appointments, and even moving support so you don’t have to


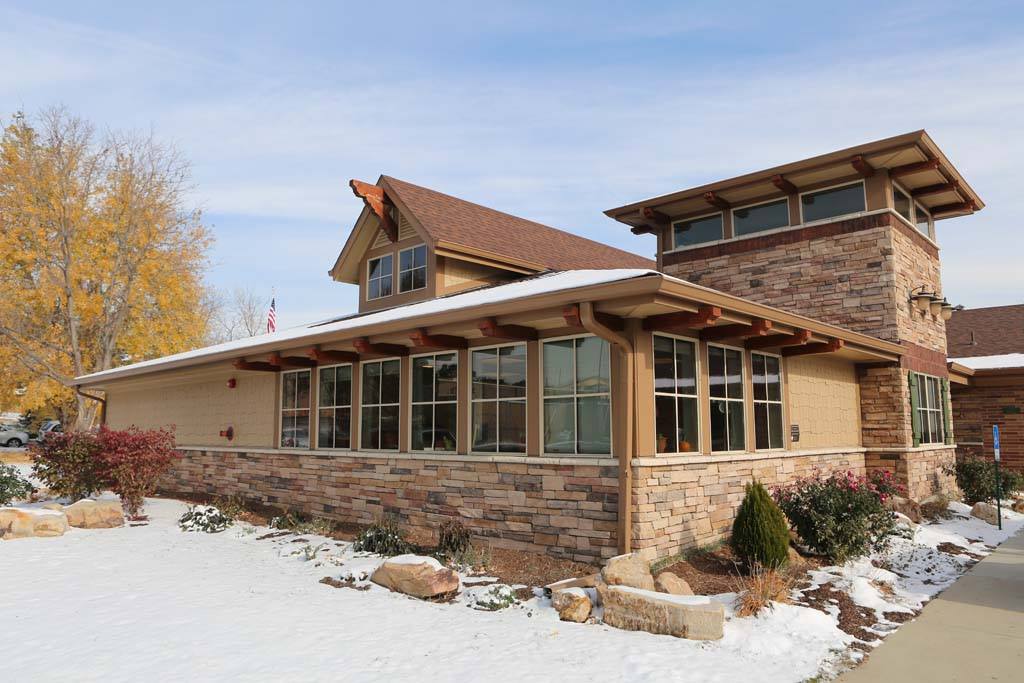
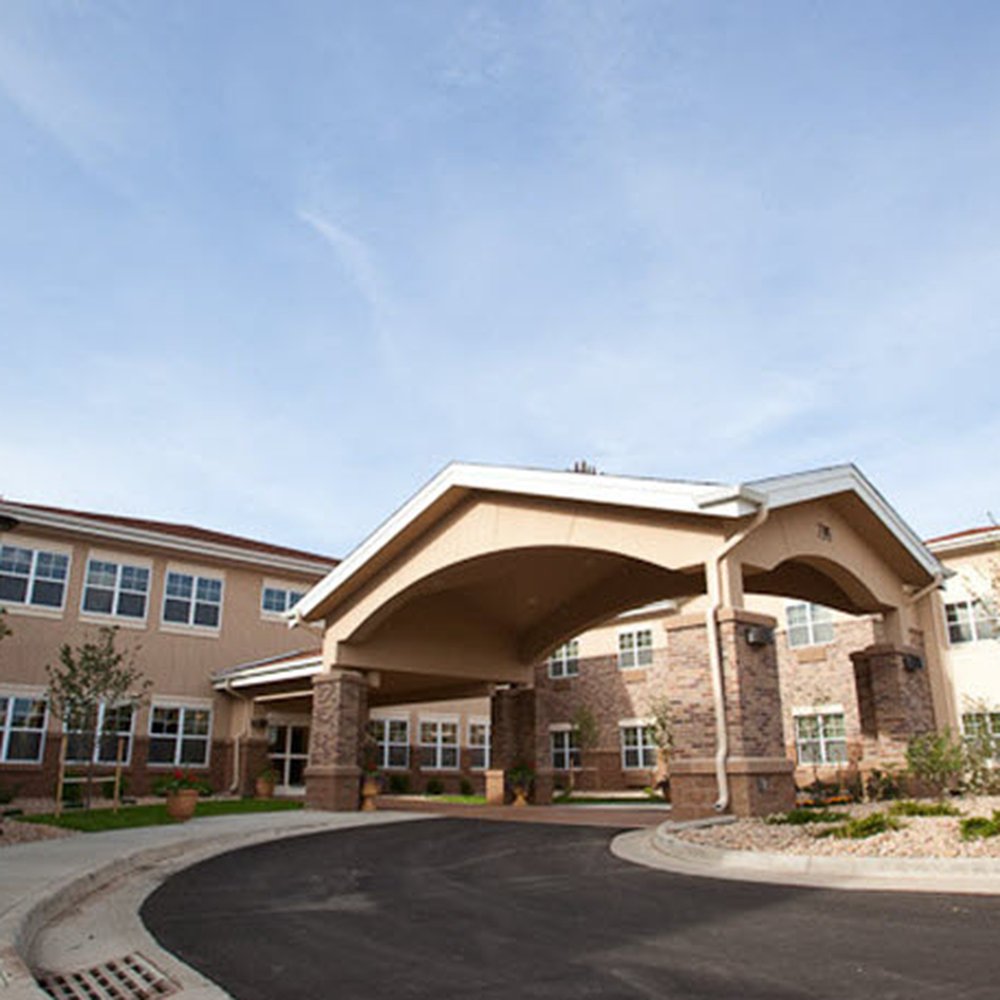
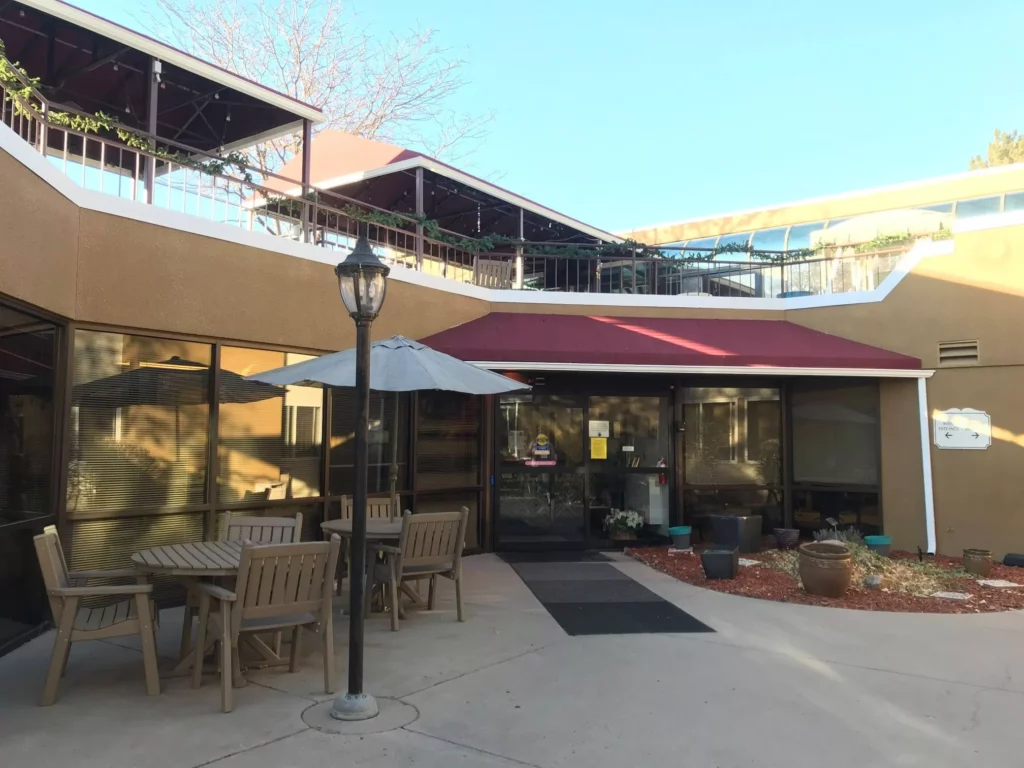
Bear Creek Care and Rehabilitation Center is nestled in the charming town of Morrison, Colorado. Whether a resident needs short-term rehabilitation, long-term care, or respite services, Bear Creek has them covered. Their rehabilitation therapy program is top-notch, and staff members are always available to help with medication management.
One of the standout features of Bear Creek is its commitment to providing urgent medical services. With access to CareNow Urgent Care and a nearby health clinic, residents can receive prompt medical attention whenever they need it. But Bear Creek isn’t just about medical care – the environment and atmosphere are designed to feel like home. In addition to nursing care, Bear Creek also offers services such as podiatry, dental, and audiology care.
 Official CMS rating based on health inspections, staffing and quality measures.
Official CMS rating based on deficiencies found during state health inspections.
Official CMS rating based on nurse staffing hours per resident per day.
Official CMS rating based on clinical outcomes for residents.
Average daily nursing hours per resident (adjusted for acuity). Higher values indicate more nursing time per resident.
Official CMS rating based on health inspections, staffing and quality measures.
Official CMS rating based on deficiencies found during state health inspections.
Official CMS rating based on nurse staffing hours per resident per day.
Official CMS rating based on clinical outcomes for residents.
Average daily nursing hours per resident (adjusted for acuity). Higher values indicate more nursing time per resident.
Offers a balance of services and community atmosphere.
Lower occupancy suggests more openings may be available.
This home supports both short-term rehab and long-term care, with residents staying for a wide range of durations.
6% of new residents, usually for short-term rehab.
48% of new residents, often for short stays.
46% of new residents, often for long-term daily care.
The portion of the home's budget spent on staff, including nurses, caregivers, and other employees who support care and operations.
All remaining costs needed to run the home, such as food, utilities, building maintenance, supplies and administrative expenses.
Colorado average 4.8
Last Health inspection on Nov 2025
Health citations are formal notices following inspections when they fail to comply with safety and care standards.
30 of 64 citations resulted from standard inspections; 24 of 64 resulted from complaint investigations; and 10 of 64 came from combined inspections (standard and complaint).
Colorado average: 0.4
Colorado average: 2.1
Data sourced from CMS Health Deficiencies reports. Citation severity codes range from A (least serious) to L (most serious). Immediate Jeopardy (J-L) citations indicate situations where the facility's noncompliance has placed residents at risk of death or serious harm.
Nursing Homes 24/7 care needed
Hospice Care
Nursing Homes 24/7 care needed
Respite Care
Memory Care Specialized care for those with Memory Loss, Alzheimer's, or dementia, ensuring safety and support.
Nursing Homes 24/7 care needed
Nursing Homes 24/7 care needed
Nursing Homes 24/7 care needed
 Cherrelyn Healthcare Center
 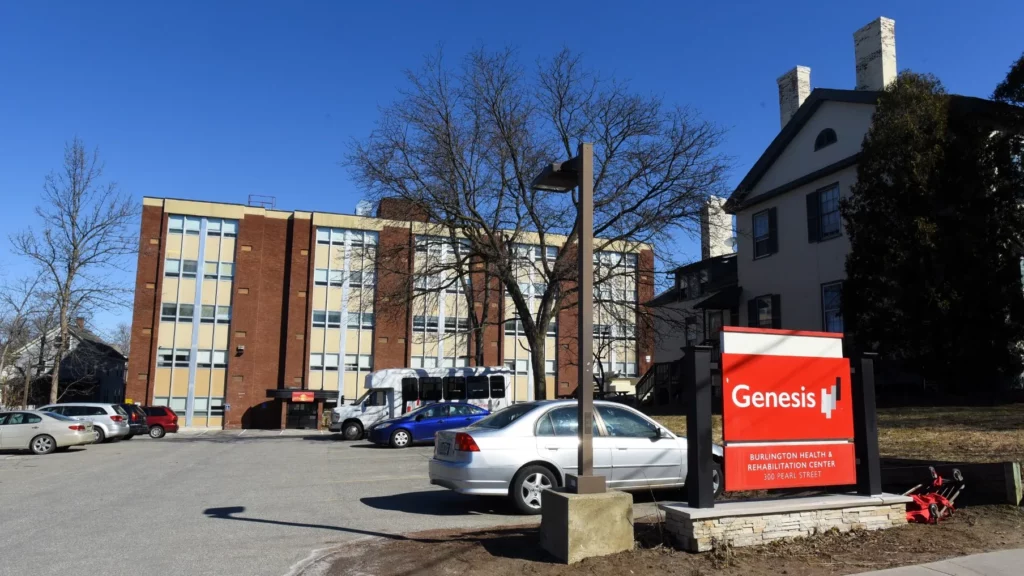 Pearl Street Health and Rehabilitation Center
  Bear Creek Care and Rehabilitation Center
![]() 16.3 miles from city center — 5.52 miles to nearest hospital (CommonSpirit St. Anthony Hospital)
16.3 miles from city center — 5.52 miles to nearest hospital (CommonSpirit St. Anthony Hospital)
![]() 150 Spring St Morrison, CO 80465
150 Spring St Morrison, CO 80465
Add your location
Source: CMS Payroll-Based Journal (Q2 2025)
| Role ⓘ | Count ⓘ | Avg Shift (hrs) ⓘ | Uses Contractors? ⓘ |
|---|---|---|---|
| Registered Nurse | 35 | 9.5 | Yes |
| Licensed Practical Nurse | 86 | 10.5 | Yes |
| Certified Nursing Assistant | 150 | 9.5 | Yes |
| Role ⓘ | Employees ⓘ | Contractors ⓘ | Total Staff ⓘ | Total Hours ⓘ | Days Worked ⓘ | % of Days ⓘ | Avg Shift (hrs) ⓘ |
|---|---|---|---|---|---|---|---|
| Certified Nursing Assistant | 47 | 103 | 150 | 14,256 | 91 | 100% | 9.5 |
| Licensed Practical Nurse | 31 | 55 | 86 | 7,371 | 91 | 100% | 10.5 |
| Registered Nurse | 8 | 27 | 35 | 3,302 | 91 | 100% | 9.5 |
| Dental Services Staff | 1 | 6 | 7 | 1,038 | 60 | 66% | 7.1 |
| Respiratory Therapy Technician | 3 | 2 | 5 | 871 | 65 | 71% | 7.4 |
| Other Dietary Services Staff | 3 | 2 | 5 | 710 | 59 | 65% | 8.5 |
| Clinical Nurse Specialist | 3 | 0 | 3 | 704 | 46 | 51% | 8.8 |
| Physical Therapy Assistant | 1 | 2 | 3 | 574 | 56 | 62% | 10.1 |
| Administrator | 2 | 1 | 3 | 512 | 64 | 70% | 8 |
| Nurse Practitioner | 1 | 1 | 2 | 496 | 62 | 68% | 8 |
| Occupational Therapy Aide | 1 | 1 | 2 | 487 | 61 | 67% | 8 |
| RN Director of Nursing | 2 | 0 | 2 | 468 | 44 | 48% | 10.4 |
| Dietitian | 2 | 0 | 2 | 453 | 47 | 52% | 9.6 |
| Mental Health Service Worker | 1 | 0 | 1 | 283 | 36 | 40% | 7.9 |
| Qualified Social Worker | 2 | 3 | 5 | 275 | 53 | 58% | 5 |
| Qualified Activities Professional | 0 | 5 | 5 | 214 | 11 | 12% | 9.7 |
| Speech Language Pathologist | 1 | 2 | 3 | 197 | 25 | 27% | 7.3 |
| Physical Therapy Aide | 1 | 1 | 2 | 105 | 19 | 21% | 5.5 |
| Occupational Therapy Assistant | 0 | 1 | 1 | 14 | 1 | 1% | 13.5 |
| Medical Director | 0 | 1 | 1 | 4 | 1 | 1% | 3.5 |
Source: CMS Long-Term Care Facility Characteristics (Data as of Jan 2026)
Residents meet regularly to discuss policies, care quality, and activities
Organized group of residents that meets regularly to discuss facility policies, quality of life, and activities.
Data sourced from CMS Long-Term Care Facility Characteristics quarterly report. Payer mix reflects the current resident census by primary payment source.
These measures show how residents usually do over time at this home, based on health outcomes and preventive care.
Colorado average: 9.0
Colorado average: 18.8
Colorado average: 16.0%
Colorado average: 17.0%
Colorado average: 23.2%
Colorado average: 3.3%
Colorado average: 3.9%
Colorado average: 1.4%
Colorado average: 5.2%
Colorado average: 7.2%
Colorado average: 18.8%
Colorado average: 93.3%
Colorado average: 94.7%
Colorado average: 76.6%
Colorado average: 1.4%
Colorado average: 75.6%
Quality measures are calculated from Minimum Data Set (MDS) assessments. For most measures, lower percentages indicate better care quality.
Federal penalties imposed by CMS for regulatory violations, including civil money penalties (fines) and denials of payment for new Medicare/Medicaid admissions.
Source: CMS Penalties Database (Data as of Jan 2026)
Colorado average: $40K
Colorado average: 2.2
Colorado average: 0.3
Penalties are imposed by CMS for violations of federal nursing home regulations.
Last updated: Jan 2026
Historical financial and operational data for Bear Creek Care and Rehabilitation Center based on CMS SNF Cost Reports.
Loading trend charts...
Care Cost Calculator: See Prices in Your Area
Nursing Home Data Explorer
Don’t Wait Too Long: 7 Red Flag Signs Your Parent Needs Assisted Living Now
The True Cost of Assisted Living in 2025 – And How Families Are Paying For It
Understanding Senior Living Costs: Pricing Models, Discounts & Financial Assistance

Touring a community? Use this expert-backed checklist to stay organized, ask the right questions, and find the perfect fit.
We'll send you a PDF version of the touring checklist.