


Bear Creek Care and Rehabilitation Center
Nursing Home, Memory Care & Skilled Nursing · Morrison, CO

Bear Creek Care and Rehabilitation Center
Nursing Home, Memory Care & Skilled Nursing · Morrison, CO
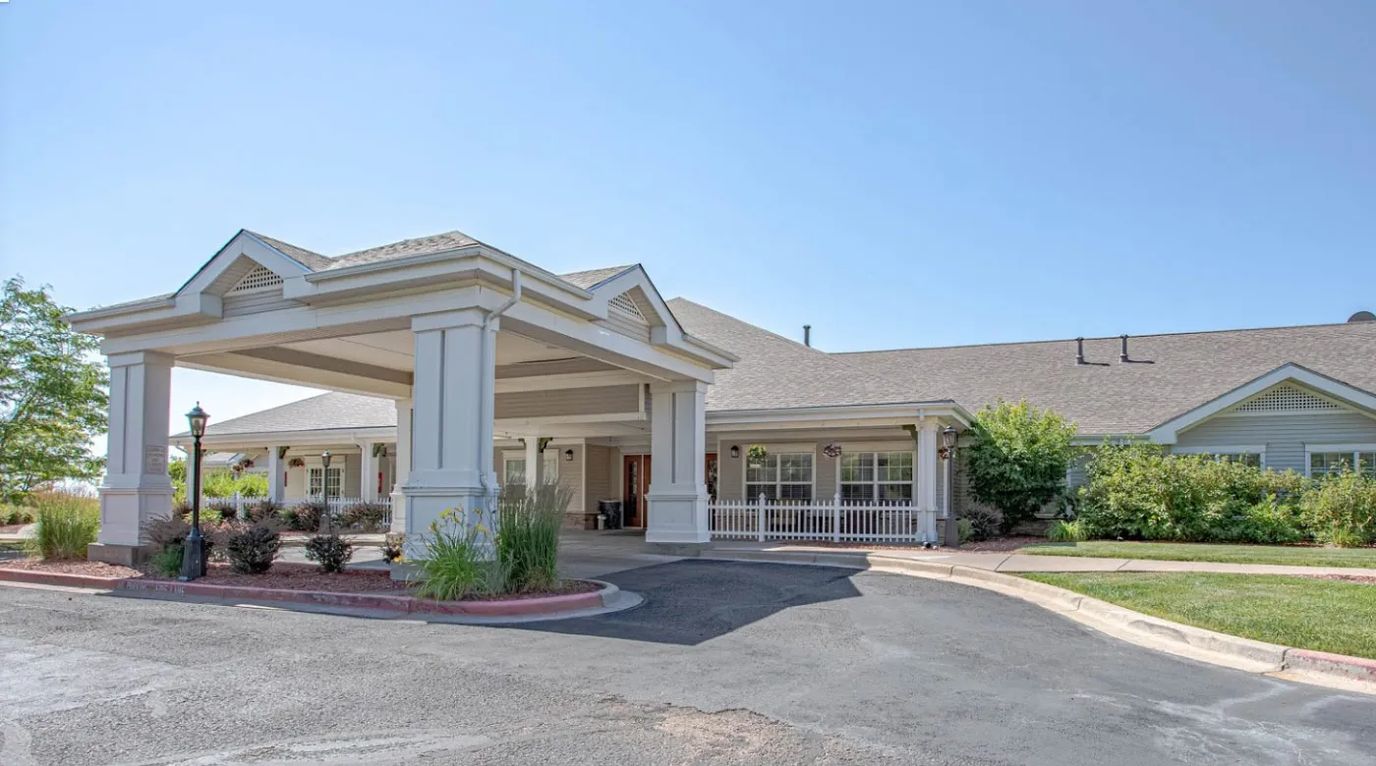
Bear Creek Care and Rehabilitation Center is a nursing home and memory care community operated by owner and manager June Richards in Morrison, Colorado. Serving the area for over six decades since its establishment in 1964, the facility provides short-term rehabilitation and long-term nursing care, plus respite services for families needing momentary support.
The community spotlights clinical support and hands-on care. A core focus is rehabilitation therapy, and the staff handles medication management for occupants. Beyond nursing services, the facility delivers on-site podiatry, dental, and audiology care, which can decrease the need for outside appointments. It coordinates with nearby urgent care services and sits roughly 5 and a half miles from CommonSpirit St. Anthony Hospital. Morrison is somewhat walkable, with a Walk Score of 36. Most trips in the area demand a car, though some nearby services are within walking reach. The neighborhood character is small-town and serene.
State inspections have noted repeating issues: supervision, medication management, staff training, and resident safety protocols. Families contemplating Bear Creek Care and Rehabilitation Center must discuss how it has addressed these areas before deciding.
To learn about specific amenities, activities, dining options, current bed availability, staffing details, and pricing, one will want to contact the facility directly.
Walk Score: 36 / 100 Rank #614 / 869Walk Score — State benchmarkedThis home is ranked 614th out of 869 homes in Colorado for walk score. Shows how walkable this facility's neighborhood is compared to the average walk score across Colorado facilities. Higher scores benefit residents, families, and staff.Facilities with the same value for a metric share the same rank. Rankings are based only on facilities in Colorado that report data for that category. Facilities without available data are excluded from the ranking.Click the rank badge to see the full State ranking.Click here to see the full State ranking.
Somewhat walkable. A few nearby services may be reachable on foot, but most trips require transportation.
Staffing
Key information about the people who lead and staff this community.
ContactMs. June Richards, Owner/Manager (per BBB, record updated Jul 2026)
Pets not allowed
Inspection History
In Colorado, the Department of Public Health and Environment, Health Facilities Division is the regulatory body that performs unannounced surveys and publishes facility inspection findings.
Since 2018 · 8 years of data
60 deficiencies
Inspection Scorecard
 This scorecard compares key inspection, deficiency, and complaint metrics at this facility against the Colorado state average. Metrics rated ≥15% worse than average are highlighted in red; those ≥15% better are highlighted in green.
Since 2018 vs. Colorado state average
Overall vs. CO average
1 Worse
Metrics worse than Colorado average:
• Total deficiencies (50% above) 0 Better No metrics in this bucket.
• Total deficiencies (50% above) 0 Better No metrics in this bucket.
Deficiencies
| This Facility | CO Average | vs. CO Avg |
|---|---|---|---|
|
Total deficiencies
| 60 | 40 | This facility has 50% more total deficiencies than a typical Colorado nursing home (60 vs. CO avg 40).↑ 50% worse |
Inspection Reports Summary
An editor-reviewed summary of the themes and findings across this facility's recent inspection reports.
- November 4, 2025 inspection found immediate jeopardy for failure to protect residents from sexual abuse, inadequate supervision causing injury, and ineffective staff training programs.
- July 28, 2025 complaint investigation substantiated resident-to-resident verbal and physical abuse and significant medication errors, including missed IV vancomycin doses.
- April 9, 2025 complaint investigation found repeated failures in supervision and use of assistive devices, causing multiple resident falls and serious injuries despite prior corrective actions.
Places of interest near Bear Creek Care and Rehabilitation Center
![]() 0.1 miles from city center
0.1 miles from city center
![]() Estimated distance in miles from Morrison's city center to Bear Creek Care and Rehabilitation Center's address, calculated via Google Maps.
— 5.52 miles to nearest hospital (CommonSpirit St. Anthony Hospital)
Estimated distance in miles from Morrison's city center to Bear Creek Care and Rehabilitation Center's address, calculated via Google Maps.
— 5.52 miles to nearest hospital (CommonSpirit St. Anthony Hospital)
Calculate Travel Distance to Bear Creek Care and Rehabilitation Center
Add your location
Compare Nursing Homes around Littleton
Info below is compiled from CMS reports & the CO Dept. of Public Health & Environment (CDPHE), senior community websites & trusted data sources such as Walk Score & BBB.
Communities are listed from highest to lowest based on our ranking methodology.
| Littleton Care and Rehabilitation Center | NH MC SNF | Littleton | 35
Facility
35
CO AVG
76
Rank
#395 / 526 |
91.7%
Facility
91.7%
CO AVG
70.5
Rank
#26 / 147 | +30% | 3.66
Facility
3.66
CO AVG
3.86
Rank
#89 / 203 | +41% | -5% | $7.8k
Facility
$7.8k
CO AVG
$39.2k
Rank
#92 / 209 | 12
Facility
12
CO AVG
24.8
Rank
#25 / 204 | 2.4
Facility
2.4
CO AVG
5.2
Rank
#17 / 204 | 1 | 32 | A+ |
69
Facility
69
CO AVG
51
Rank
#243 / 869 | - | $5.5MFiscal year ending 12/2023
Facility
$5.5MFiscal year ending 12/2023
CO AVG
$11.2M
Rank
#193 / 207 | $3.3MFiscal year ending 12/2023
Facility
$3.3MFiscal year ending 12/2023
CO AVG
$4.9M
Rank
#188 / 207 | 59.7%Fiscal year ending 12/2023
Facility
59.7%Fiscal year ending 12/2023
CO AVG
46.6%
Rank
#74 / 207 | 65320 | ||||
| Cherrelyn Healthcare Center | NH SNF | Littleton | 190
Facility
190
CO AVG
76
Rank
#12 / 526 |
88.4%
Facility
88.4%
CO AVG
70.5
Rank
#37 / 147 | +25% | 2.69
Facility
2.69
CO AVG
3.86
Rank
#189 / 203 | -13% | -30% | $0
Facility
$0
CO AVG
$39.2k
Rank
#1 / 209 | 37
Facility
37
CO AVG
24.8
Rank
#165 / 204 | 9.3
Facility
9.3
CO AVG
5.2
Rank
#194 / 204 | 7 | 168 | A+ |
78
Facility
78
CO AVG
51
Rank
#132 / 869 | Stellar Cherrelyn Management LLC | $20.1MFiscal year ending 12/2023
Facility
$20.1MFiscal year ending 12/2023
CO AVG
$11.2M
Rank
#19 / 207 | $13.0MFiscal year ending 12/2023
Facility
$13.0MFiscal year ending 12/2023
CO AVG
$4.9M
Rank
#5 / 207 | 64.8%Fiscal year ending 12/2023
Facility
64.8%Fiscal year ending 12/2023
CO AVG
46.6%
Rank
#74 / 207 | 65203 | ||||
| Life Care Center of Littleton | NH SNF | Littleton | 120
Facility
120
CO AVG
76
Rank
#77 / 526 |
85.2%
Facility
85.2%
CO AVG
70.5
Rank
#48 / 147 | +21% | 4.35
Facility
4.35
CO AVG
3.86
Rank
#33 / 203 | +29% | +13% | $0
Facility
$0
CO AVG
$39.2k
Rank
#1 / 209 | 26
Facility
26
CO AVG
24.8
Rank
#123 / 204 | 8.7
Facility
8.7
CO AVG
5.2
Rank
#187 / 204 | 1 | 102 | A+ |
54
Facility
54
CO AVG
51
Rank
#429 / 869 | Sara Dent | $15.1MFiscal year ending 05/2024
Facility
$15.1MFiscal year ending 05/2024
CO AVG
$11.2M
Rank
#34 / 207 | $8.9MFiscal year ending 05/2024
Facility
$8.9MFiscal year ending 05/2024
CO AVG
$4.9M
Rank
#23 / 207 | 58.7%Fiscal year ending 05/2024
Facility
58.7%Fiscal year ending 05/2024
CO AVG
46.6%
Rank
#106 / 207 | 65370 | ||||
| Pearl Street Health and Rehabilitation Center | NH RC SNF | Englewood | 81
Facility
81
CO AVG
76
Rank
#231 / 526 |
83.6%
Facility
83.6%
CO AVG
70.5
Rank
#53 / 147 | +19% | 4.04
Facility
4.04
CO AVG
3.86
Rank
#63 / 203 | -40% | +5% | $0
Facility
$0
CO AVG
$39.2k
Rank
#1 / 209 | 38
Facility
38
CO AVG
24.8
Rank
#171 / 204 | 4.2
Facility
4.2
CO AVG
5.2
Rank
#67 / 204 | - | 68 | A+ |
80
Facility
80
CO AVG
51
Rank
#107 / 869 | - | $6.5MFiscal year ending 12/2023
Facility
$6.5MFiscal year ending 12/2023
CO AVG
$11.2M
Rank
#147 / 207 | $2.7MFiscal year ending 12/2023
Facility
$2.7MFiscal year ending 12/2023
CO AVG
$4.9M
Rank
#178 / 207 | 41.5%Fiscal year ending 12/2023
Facility
41.5%Fiscal year ending 12/2023
CO AVG
46.6%
Rank
#178 / 207 | 65208 |
Financial Assistance for
Nursing Home in Colorado
Bear Creek Care and Rehabilitation Center is located in Morrison, Colorado.
Here are the financial assistance programs available to residents in Colorado.
Frequently Asked Questions about Bear Creek Care and Rehabilitation Center
Is Bear Creek Care and Rehabilitation Center in a walkable area?
Bear Creek Care and Rehabilitation Center has a walk score of 36. Somewhat walkable. A few nearby services may be reachable on foot, but most trips require transportation.
Are pets allowed at Bear Creek Care and Rehabilitation Center?
No, Bear Creek Care and Rehabilitation Center has a no-pet policy.
Are there photos of Bear Creek Care and Rehabilitation Center?
Yes — there are 5 photos of Bear Creek Care and Rehabilitation Center in the photo gallery on this page.
What is the address of Bear Creek Care and Rehabilitation Center?
Bear Creek Care and Rehabilitation Center is located at 150 Spring St, Morrison, CO 80465.
What is the phone number of Bear Creek Care and Rehabilitation Center?
(303) 697-8105 will put you in contact with the team at Bear Creek Care and Rehabilitation Center.
Is Bear Creek Care and Rehabilitation Center Medicare or Medicaid certified?
Bear Creek Care and Rehabilitation Center is not currently listed as a CMS-certified provider of Medicare or Medicaid.
Guides for Better Senior Living
Care Cost Calculator: See Prices in Your Area
Nursing Home Data Explorer
Don’t Wait Too Long: 7 Red Flag Signs Your Parent Needs Assisted Living Now
The True Cost of Assisted Living in 2025 – And How Families Are Paying For It
Understanding Senior Living Costs: Pricing Models, Discounts & Financial Assistance
Updated on
