Bella Terra Wheeling
Nursing Home, Hospice Care, Memory Care & Palliative Care · Illinois, IL
CMS overall rating Info CMS (the Centers for Medicare & Medicaid Services) is the federal agency that rates nursing home quality. Its Overall Rating runs from 1 to 5 stars, combining health inspections, staffing, and quality measures, with inspections weighted most heavily.

Bella Terra Wheeling

Nursing Home, Hospice Care, Memory Care & Palliative Care · Illinois, IL
CMS overall rating Info CMS (the Centers for Medicare & Medicaid Services) is the federal agency that rates nursing home quality. Its Overall Rating runs from 1 to 5 stars, combining health inspections, staffing, and quality measures, with inspections weighted most heavily.
Calculator: See prices in your area
Bella Terra Wheeling accepts Medicare, Medicaid, and private pay.

Overview of Bella Terra Wheeling

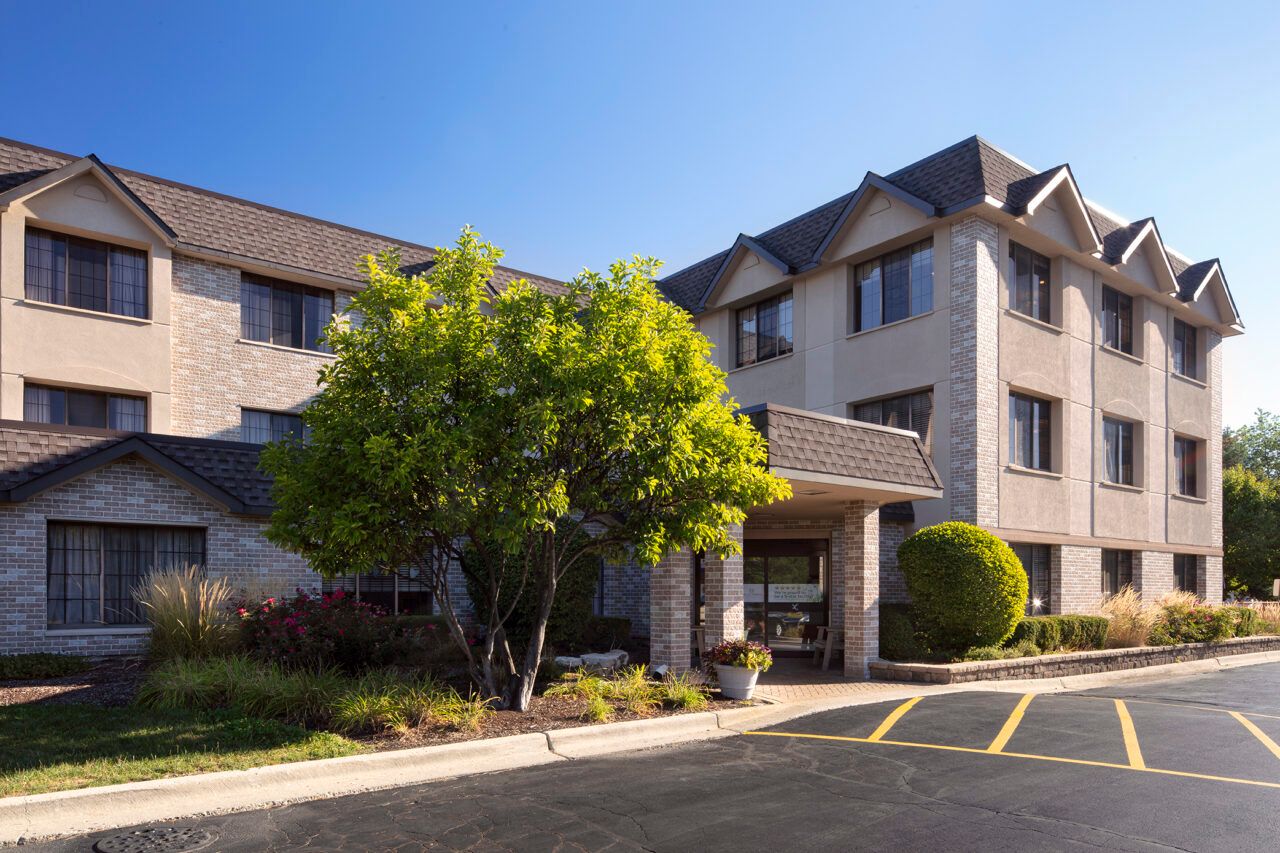
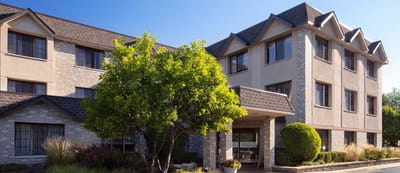
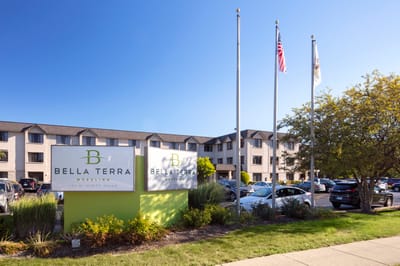
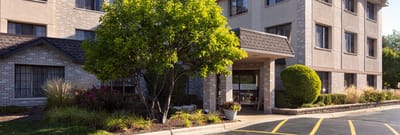
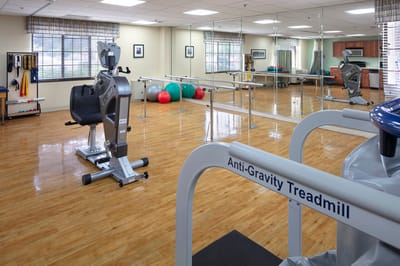
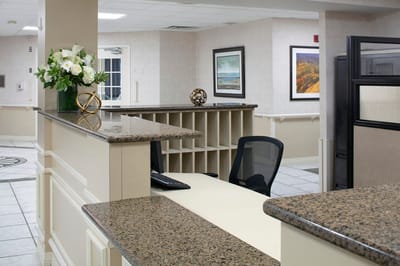
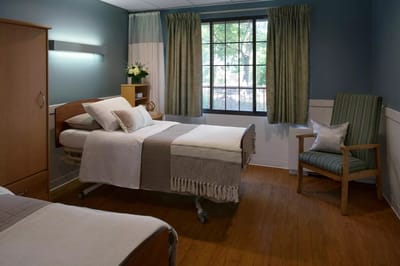
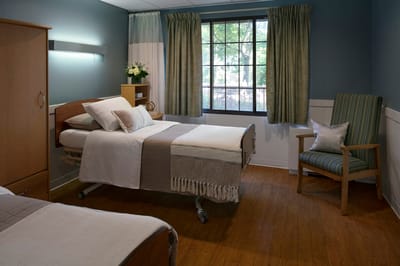
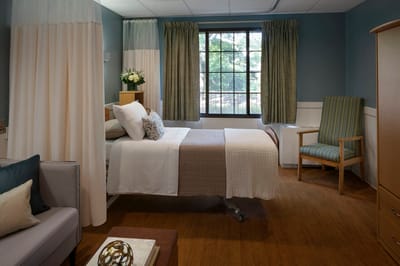
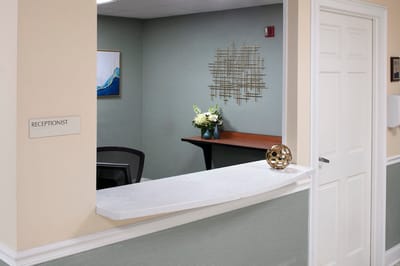
Greeting seniors with peace and vibrancy, Bella Terra Wheeling is a trusted senior living community in Wheeling, IL where personal attention and progressive medical care go hand in hand in this community. For post-hospital rehabilitation or residential skilled nursing care, this community offers the perfect environment for recovery and comfort. With a dedicated, attentive team and a beautifully designed campus, residents enjoy an atmosphere that promotes healing and enhances the quality of life.

With extensive amenities and services, residents have more opportunities to mingle with friends and maintain an active lifestyle. Moreover, this community provides cardiac programming, an inotropes program, physical, occupational and speech therapy. Bella Terra Wheeling strives to create a haven for seniors to make every moment of their best years memorable while having a premiere care experience.

(847) 537-7474

Quality ratings

Measured by Centers for Medicare & Medicaid Services (CMS)

Overall rating Info The Overall CMS Rating combines results from health inspections, staffing levels and quality measures. Health inspections carry the most weight. Staffing and quality scores can increase or decrease the final rating based on performance compared to state and national standards.
▲ 58.7% Above IL avg. ▲ 58.7% Above IL avg.IL average: 2.5Click the badge to see the full State ranking.Click here to see the full State ranking.
Health Inspection Info Based on the results of the facility's three most recent standard inspections and any complaint investigations. CMS reviews the number, scope, and severity of deficiencies, with more recent findings weighted more heavily.
▲ 44.1% Above IL avg. ▲ 44.1% Above IL avg.IL average: 2.8Click the badge to see the full State ranking.Click here to see the full State ranking.
Staffing Info Measures average nursing staff hours per resident per day, including Registered Nurses (RNs) and total nursing staff. Ratings are adjusted based on the level of care residents require and are compared to state and national benchmarks.
▲ 40.4% Above IL avg. ▲ 40.4% Above IL avg.IL average: 2.1Click the badge to see the full State ranking.Click here to see the full State ranking.
Quality Measures Info Based on clinical and physical health indicators reported to CMS, such as hospital readmissions, falls, pressure ulcers, and improvements in mobility. These measures reflect how well residents' health needs are being managed.
▲ 42.1% Above IL avg. ▲ 42.1% Above IL avg.IL average: 2.8Click the badge to see the full State ranking.Click here to see the full State ranking.

Staffing hours breakdown

Info Daily nursing hours per resident by staff type, reported to CMS. Higher is generally better — compare this facility to state and national averages to see where staffing stands.

Hours per resident per day — compared to Illinois state averages

Total nursing care / resident Info This home is ranked 67th out of 172 homes in Illinois for nurse hours. Total adjusted nursing hours per resident per day, combining RN, LPN, and aide time. CMS adjusts this for case-mix so facilities can be fairly compared.
3h 4m per day
Rank #67 / 172Nurse hours — State benchmarkedThis home is ranked 67th out of 172 homes in Illinois. Shows adjusted nurse hours per resident per day benchmarked to the Illinois average, with a ranking across 172 Illinois facilities. More hours mean more direct care. The national average is about 3.5 hrs; below 3.0 is a red flag.Rankings are based only on facilities in Illinois that report data for that category. Facilities without available data are excluded from the ranking.Click the rank badge to see the full State ranking.Click here to see the full State ranking.
This facility Illinois avg (3h 6m per day)
vs Illinois avg
-1%

1 of 6 metrics below state avg

Standout metric Weekend RN is +64% above state avg
Staff typeHours / Day / Residentvs state avg
Registered Nurse (RN) Info RNs hold the highest nursing license and can assess residents, interpret test results, and direct care plans. More RN hours per day often signals stronger clinical oversight and faster response to health changes. 1h 0m per day ▲ 36% State avg: 44m per day · National avg: 41m per day
LPN / LVN Info Licensed Practical Nurses (LPNs) or Licensed Vocational Nurses (LVNs) deliver routine hands-on care — medication administration, wound dressing, and monitoring vital signs. They work under RN supervision and make up a large share of daily bedside care. 46m per day ▲ 22% State avg: 38m per day · National avg: 52m per day
Nurse Aide Info Certified Nurse Aides (CNAs) provide the most direct day-to-day assistance: bathing, dressing, feeding, and mobility. Nurse aide hours are typically the largest staffing category and directly affect residents' quality of life. 1h 56m per day ▼ 10% State avg: 2h 8m per day · National avg: 2h 21m per day
Weekend Total Nursing Info Combined nursing hours (RN + LPN + Nurse Aide) per resident per day on weekends. Staffing often drops on weekends — this figure reveals whether the facility maintains adequate coverage outside of weekday hours. 3h 33m per day ▲ 15% State avg: 3h 5m per day · National avg: 3h 26m per day
Physical Therapist Info Hours per resident per day provided by licensed Physical Therapists (PTs) or PT Assistants. PT services help residents recover mobility after injury or illness and are especially important for post-acute (short-stay) rehabilitation. 4m per day ▲ 23% State avg: 3m per day · National avg: 4m per day
Weekend RN Info Registered nurse hours specifically on weekends. Facilities sometimes reduce RN presence on Saturdays and Sundays — a low weekend RN figure compared to weekday hours can indicate reduced clinical oversight when most administrative staff are absent. 56m per day ▲ 64% State avg: 34m per day · National avg: 29m per day

Capacity and availability

This home usually has availability

Higher occupancy than the Illinois average: 69.3%
Occupancy rate
72.1% Rank #115 / 204Occupancy rate — State benchmarkedThis home is ranked 115th out of 204 homes in Illinois. Shows this facility's occupancy rate versus the Illinois average, with its Statewide rank out of 204. Higher occupancy signals strong local demand and financial stability.Rankings are based only on facilities in Illinois that report data for that category. Facilities without available data are excluded from the ranking.Click the rank badge to see the full State ranking.Click here to see the full State ranking.
Avg. Length of Stay
67 days
Bed community size
120-bed community Rank #80 / 426Bed count — State benchmarkedThis home is ranked 80th out of 426 homes in Illinois. Shows this facility's certified or reported bed count compared to other Illinois facilities. Larger communities may offer more amenities, programs, and on-site services for residents and families.Rankings are based only on facilities in Illinois that report data for that category. Facilities without available data are excluded from the ranking.Click the rank badge to see the full State ranking.Click here to see the full State ranking.
A larger shared setting that may offer more common spaces and organized community services.
Walk Score
Walk Score: 60 / 100 Rank #233 / 648Walk Score — State benchmarkedThis home is ranked 233rd out of 648 homes in Illinois. Shows how walkable this facility's neighborhood is compared to the average Walk Score across Illinois facilities. Higher scores benefit residents, families, and staff.Rankings are based only on facilities in Illinois that report data for that category. Facilities without available data are excluded from the ranking.Click the rank badge to see the full State ranking.Click here to see the full State ranking.
Moderately walkable. Some errands can be accomplished on foot, with a mix of nearby amenities.

About this community

License Details

AccreditationsGold Seal of Approval® Certification from The Joint Commission

Therapy & Rehabilitation

2 services
Rehabilitation Services
Short-Term Rehab

Amenities & Lifestyle

Specific ProgramsCardiac Programming, Secured Memory Care Unit, Inotropes

Contact Bella Terra Wheeling

Staffing Data

Reporting period: October 1 – December 31, 2025 (Q4 2025). Source: CMS Payroll-Based Journal report.

Total staff 280
Employees 102
Contractors 178
Staff to resident ratio 2.89 : 1
61% more staff per resident than Illinois average
Illinois average ratio: 1.80 : 1 Illinois average ratio: 1.80 : 1See full Illinois ranking
Avg staff/day 59
Average shift 7.4 hours
0% compared with Illinois average
Illinois average: 7.6 hours Illinois average shift: 7.6 hoursSee full Illinois ranking
Total staff hours (quarter) 39,943

Nursing staff breakdown

Q4 2025 · Oct 1 – Dec 31 More info This data comes from the CMS Payroll-Based Journal report covering October 1 – December 31, 2025.
Registered Nurse

Manages medical care and health needs.

RN Staff Info 103 total: 20 full-time employees and 83 contractors. 103
Average shift length Info Average shift length. Calculated as total hours divided by days worked and average staff per day. 7.7 hours
Licensed Practical Nurse

Assists with medical care and medications.

LPN Staff Info 43 total: 16 full-time employees and 27 contractors. 43
Average shift length Info Average shift length. Calculated as total hours divided by days worked and average staff per day. 8.6 hours
Certified Nursing Assistant

Helps with daily care and mobility.

CNA Staff Info 88 total: 51 full-time employees and 37 contractors. 88
Average shift length Info Average shift length. Calculated as total hours divided by days worked and average staff per day. 7.9 hours

Contractor staffing

Q4 2025 · Oct 1 – Dec 31 More info This data comes from the CMS Payroll-Based Journal report covering October 1 – December 31, 2025.

Total hours from contractors

16.4%

6,563 contractor hours this quarter

Registered Nurse: 83 Certified Nursing Assistant: 37 Licensed Practical Nurse: 27 Respiratory Therapy Technician: 11 Speech Language Pathologist: 7 Physical Therapy Assistant: 5 Physical Therapy Aide: 4 Qualified Social Worker: 4

Staff by category

Q4 2025 · Oct 1 – Dec 31 More info This data comes from the CMS Payroll-Based Journal report covering October 1 – December 31, 2025.
Certified Nursing Assistant51378817,19792100%7.9
Registered Nurse20831036,49192100%7.7
Licensed Practical Nurse1627435,91392100%8.6
Clinical Nurse Specialist5051,9039098%5.5
Speech Language Pathologist0771,5837986%7.2
RN Director of Nursing2029679098%5.6
Physical Therapy Assistant0558298997%7
Physical Therapy Aide0447987379%6.8
Other Dietary Services Staff2025658087%7.1
Respiratory Therapy Technician011115487986%5.5
Qualified Social Worker0445306470%7.6
Dietitian1015008997%5.6
Administrator1014928896%5.6
Nurse Practitioner1014848795%5.6
Mental Health Service Worker1014848795%5.6
Dental Services Staff1014658491%5.5
Qualified Activities Professional1011983336%6
88 Certified Nursing Assistant
% of Days 100%
103 Registered Nurse
% of Days 100%
43 Licensed Practical Nurse
% of Days 100%
5 Clinical Nurse Specialist
% of Days 98%
7 Speech Language Pathologist
% of Days 86%
2 RN Director of Nursing
% of Days 98%
5 Physical Therapy Assistant
% of Days 97%
4 Physical Therapy Aide
% of Days 79%
2 Other Dietary Services Staff
% of Days 87%
11 Respiratory Therapy Technician
% of Days 86%
4 Qualified Social Worker
% of Days 70%
1 Dietitian
% of Days 97%
1 Administrator
% of Days 96%
1 Nurse Practitioner
% of Days 95%
1 Mental Health Service Worker
% of Days 95%
1 Dental Services Staff
% of Days 91%
1 Qualified Activities Professional
% of Days 36%

Penalties and fines

Federal penalties imposed by CMS for regulatory violations, including civil money penalties (fines) and denials of payment for new Medicare/Medicaid admissions.

Source: CMS Penalties Database (Data as of Jan 2026)

Total fines amount $18K Rank #1 / 173Federal fines — State benchmarkedThis home is ranked 1st out of 173 homes in Illinois. Shows this facility's cumulative CMS federal fine dollars versus the Illinois average among facilities with fines, and where it ranks among 173 facilities in the pool. Lower total dollars mean a better rank.Rankings are based only on facilities in Illinois that report data for that category. Facilities without available data are excluded from the ranking.Click the rank badge to see the full State ranking.Click here to see the full State ranking.
87% lower than Illinois average

Illinois average: $143K

Number of fines 1
66% fewer fines than Illinois average

Illinois average: 3.0

Payment Denials Info Serious action where Medicare and/or Medicaid temporarily stops payments for new residents until issues are fixed. 0
100% fewer payment denials than Illinois average

Illinois average: 1.1

Fines amount comparison
This facility $18K
Illinois average $143K

No penalties in the past 3 years

No civil money penalties or payment denials were reported in the last 3 years.

Quality of care over time

These measures show how residents usually do over time at this home, based on health outcomes and preventive care.

High-risk clinical events score Info A composite score based on pressure ulcers, falls with injury, weight loss, walking ability decline, and activities of daily living decline. 5.9
39% better than Illinois average

Illinois average: 9.7

Functional decline score Info A composite score based on activities of daily living decline, walking ability decline, and incontinence. 10.1
46% better than Illinois average

Illinois average: 18.6

Long-stay resident measures
Average Info CMS star rating based on long-stay quality measure performance. 5 stars = significantly above average, 1 star = significantly below average.
Need for Help with Daily Activities Increased Info Percent of long-stay residents whose need for help with daily activities has increased 8.0%
48% better than Illinois average

Illinois average: 15.5%

Walking Ability Worsened Info Percent of long-stay residents whose ability to move independently worsened 8.0%
57% better than Illinois average

Illinois average: 18.4%

Low Risk Residents with Bowel/Bladder Incontinence Info Percent of low risk long-stay residents who lose control of their bowels or bladder 14.3%
34% better than Illinois average

Illinois average: 21.6%

Falls with Major Injury Info Percent of long-stay residents experiencing one or more falls with major injury 2.3%
33% better than Illinois average

Illinois average: 3.4%

High Risk Residents with Pressure Ulcers Info Percent of long-stay high risk residents with pressure ulcers 5.2%
In line with Illinois average

Illinois average: 5.3%

Urinary Tract Infection Info Percent of long-stay residents with a urinary tract infection 4.6%
153% worse than Illinois average

Illinois average: 1.8%

Lost Too Much Weight Info Percent of long-stay residents who lose too much weight 6.3%
In line with Illinois average

Illinois average: 6.5%

Depressive Symptoms Info Percent of long-stay residents who have depressive symptoms 87.5%
82% worse than Illinois average

Illinois average: 48.1%

Antipsychotic Use Info Percent of long-stay residents who received an antipsychotic medication 21.7%
7% worse than Illinois average

Illinois average: 20.2%

Pneumococcal Vaccine Info Percent of long-stay residents assessed and appropriately given the pneumococcal vaccine 76.4%
14% worse than Illinois average

Illinois average: 89.2%

Influenza Vaccine Info Percent of long-stay residents assessed and appropriately given the seasonal influenza vaccine 89.5%
In line with Illinois average

Illinois average: 91.6%

Hospitalizations per 1,000 days Info Number of hospitalizations per 1,000 long-stay resident days. 2.75
34% worse than Illinois average

Illinois average: 2.05

ED visits per 1,000 days Info Number of outpatient emergency department visits per 1,000 long-stay resident days. 2.28
In line with Illinois average

Illinois average: 2.25

Short-stay resident measures
Below average Info CMS star rating based on short-stay quality measure performance. 5 stars = much above average, 1 star = much below average.
Pneumococcal Vaccine Info Percent of short-stay residents assessed and appropriately given the pneumococcal vaccine 66.2%
In line with Illinois average

Illinois average: 68.3%

Antipsychotic medication increase Info Percent of short-stay residents who newly received an antipsychotic medication 4.2%
81% worse than Illinois average

Illinois average: 2.3%

Influenza Vaccine Info Percent of short-stay residents assessed and appropriately given the seasonal influenza vaccine 57.1%
9% worse than Illinois average

Illinois average: 63.0%

Re-hospitalized after SNF stay Info Percentage of short-stay residents who were re-hospitalized after their nursing home admission. 30.9%
18% worse than Illinois average

Illinois average: 26.2%

Emergency department visits Info Percentage of short-stay residents who had an outpatient emergency department visit. 7.0%
50% better than Illinois average

Illinois average: 14.0%

Falls with major injury Info Percentage of SNF residents who experience falls with major injury during their stay. 0.9%
10% worse than Illinois average

Illinois average: 0.8%

Ability to care for self at discharge Info Percentage of residents at or above expected ability to care for themselves at discharge. 35.5%
34% worse than Illinois average

Illinois average: 53.7%

Successful return to home or community Info Rate of successful return to home or community from a skilled nursing facility. 46.5%
8% worse than Illinois average

Illinois average: 50.6%

Breakdown by payment type

Medicare

34% of new residents, usually for short-term rehab.

Typical stay 24 days

Private pay

56% of new residents, often for short stays.

Typical stay 2 - 3 months

Medicaid

10% of new residents, often for long-term daily care.

Typical stay 5 - 6 months

Facility Characteristics

Source: CMS Long-Term Care Facility Characteristics (Data as of Jan 2026)

Total residents 97
Medicare
18
18.6% of residents
Medicaid
54
55.7% of residents
Private pay or other
25
25.8% of residents
Programs & Services
Residents Group

Residents meet regularly to discuss policies, care quality, and activities

Active Resident Council

Organized group of residents that meets regularly to discuss facility policies, quality of life, and activities.

Finances and operations

Based on CMS SNF Cost Report for fiscal year ending in 12/2023.

Privately-owned community
Operated by a single business entity.
Net patient revenue Info Net patient revenue — what the home actually collects for resident care, after contractual allowances, bad debt and discounts are subtracted from its gross charges (CMS cost report, Worksheet G-3). It covers resident care only; money the home earns from other sources is shown separately as "Other income."
$11.6M
Net patient income Info Net patient income: net patient revenue minus the home's total operating expenses. A positive figure means it earns more from resident care than it spends to deliver it; a negative figure means the opposite. It excludes non-operating "other income."
-$1.7M
Privately-owned community Operated by a single business entity.
Net patient revenue Info Net patient revenue — what the home actually collects for resident care, after contractual allowances, bad debt and discounts are subtracted from its gross charges (CMS cost report, Worksheet G-3). It covers resident care only; money the home earns from other sources is shown separately as "Other income."
$11.6M Rank #64 / 171Revenue — State benchmarkedThis home is ranked 64th out of 171 homes in Illinois. Shows this facility's annual revenue compared to the Illinois average. Higher revenue generally means more resources for staffing and capital — read alongside Payroll %.Rankings are based only on facilities in Illinois that report data for that category. Facilities without available data are excluded from the ranking.Click the rank badge to see the full State ranking.Click here to see the full State ranking.
Net patient income Info Net patient income: net patient revenue minus the home's total operating expenses. A positive figure means it earns more from resident care than it spends to deliver it; a negative figure means the opposite. It excludes non-operating "other income."
-$1.7M
Other income Info Money the home earns outside of resident care — such as investments, grants, rentals and other non-operating sources (CMS cost report, Worksheet G-3). It is tracked separately from net patient revenue: it is not part of that figure, and it is not included in net patient income.
$295.1K
Payroll costs Info Staff salaries plus wage-related costs — benefits such as payroll taxes, health insurance and retirement — from the home's own accounting records (CMS cost report, Worksheet A). Contract or agency labor is counted separately, under other operating costs. Rank #91 / 171Payroll — State benchmarkedThis home is ranked 91st out of 171 homes in Illinois. Shows total annual staff payroll benchmarked to the Illinois average. Higher payroll investment relative to peers often signals better staffing and less reliance on cheaper contract labor.Rankings are based only on facilities in Illinois that report data for that category. Facilities without available data are excluded from the ranking.Click the rank badge to see the full State ranking.Click here to see the full State ranking.
$4.6M 39.8% of net patient revenue Info Payroll as a share of revenue: staff salaries and wage-related benefits divided by net patient revenue. A higher figure means more of each revenue dollar goes to staff pay. Rank #137 / 171Payroll % — State benchmarkedThis home is ranked 137th out of 171 homes in Illinois. Shows payroll as a percentage of revenue versus the Illinois average. Well-run Illinois facilities typically land around 54–67% — the top third Statewide. Below 25% may signal understaffing or heavy agency use — read with Staffing ratings.Rankings are based only on facilities in Illinois that report data for that category. Facilities without available data are excluded from the ranking.Click the rank badge to see the full State ranking.Click here to see the full State ranking.
Other operating costs Info Everything it costs to run the home apart from payroll — food, utilities, supplies, maintenance, contract labor and administration. Calculated as total operating expense minus payroll (staff salaries and wage-related benefits).
$8.7M
Total costs Info The home's total operating expense for the year — all the costs of running it, salaries included (CMS cost report, Worksheet G-3).
$13.3M

What does this home offer?

Building type icon
Building type icon

Building Type: 3-story

Who this home usually serves

TYPE OF STAY

Mix of rehab and long-term care

This home supports both short-term rehab and long-term care, with residents staying for a wide range of durations.

Most new residents arrive under private pay (56% of admissions), and a typical private pay stay runs around 2 - 3 months.

Admissions
460 total

Coverage residents most often arrive under.

Medicare 34%
Private pay 56%
Medicaid 10%
Discharges
470 total

Coverage residents most often leave under.

Medicare 27%
Private pay 57%
Medicaid 16%

Places of interest near Bella Terra Wheeling

Address 1.6 miles from city center Info Estimated distance in miles from Wheeling's city center to Bella Terra Wheeling's address, calculated via Google Maps. — 4.9 miles to nearest hospital (Endeavor Health Northwest Community Hospital)

Calculate Travel Distance to Bella Terra Wheeling

Add your location

Address

Compare Nursing Homes around Illinois

The information below is reported by the Illinois Department of Public Health, Office of Health Care Regulation.

5 facilities compared · CMS & IL Dept. of Health data

Mercy Circle Senior Living
NH
AL
IL
MC
Chicago (Mount Greenwood)
43
Facility 43
IL AVG 86
Rank #337 / 426
98.9%
Facility 98.9%
IL AVG 69.3%
Rank #15 / 204
+43%
4.57
Facility 4.57
IL AVG 3.10
Rank #24 / 172
-8%+47%
$0
Facility $0
IL AVG $151.3k
Rank #1 / 173
16
Facility 16
IL AVG 36.8
Rank #24 / 172
4.0
Facility 4.0
IL AVG 3.7
Rank #119 / 172
-22-
44
Facility 44
IL AVG 51
Rank #392 / 648
Sisters Of Mercy Of The Americas West Midwest Community Inc
$10.3M
Facility $10.3M
IL AVG $12.2M
Rank #95 / 171
$5.1M
Facility $5.1M
IL AVG $4.8M
Rank #117 / 171
49.8%
Facility 49.8%
IL AVG 44.3%
Rank #118 / 171
146174
The Selfhelp Home Senior Living Community
NH
AL
IL
RC
Chicago (Uptown)
72
Facility 72
IL AVG 86
Rank #209 / 426
81.9%
Facility 81.9%
IL AVG 69.3%
Rank #74 / 204
+18%
5.56
Facility 5.56
IL AVG 3.10
Rank #8 / 172
+44%+79%
$0
Facility $0
IL AVG $151.3k
Rank #1 / 173
21
Facility 21
IL AVG 36.8
Rank #45 / 172
5.3
Facility 5.3
IL AVG 3.7
Rank #154 / 172
155A+
92
Facility 92
IL AVG 51
Rank #28 / 648
Marvin Rubin
$9.3M
Facility $9.3M
IL AVG $12.2M
Rank #78 / 171
$7.0M
Facility $7.0M
IL AVG $4.8M
Rank #73 / 171
75.3%
Facility 75.3%
IL AVG 44.3%
Rank #70 / 171
146009
GreenFields of Geneva
NH
AL
IL
MC
Geneva
77
Facility 77
IL AVG 86
Rank #193 / 426
54.5%
Facility 54.5%
IL AVG 69.3%
Rank #172 / 204
-21%
4.58
Facility 4.58
IL AVG 3.10
Rank #24 / 172
+61%+48%
$14.2k
Facility $14.2k
IL AVG $151.3k
Rank #84 / 173
19
Facility 19
IL AVG 36.8
Rank #39 / 172
4.8
Facility 4.8
IL AVG 3.7
Rank #144 / 172
341A+
6
Facility 6
IL AVG 51
Rank #610 / 648
Brian Robbins
$20.4M
Facility $20.4M
IL AVG $12.2M
Rank #26 / 171
$8.9M
Facility $8.9M
IL AVG $4.8M
Rank #43 / 171
43.5%
Facility 43.5%
IL AVG 44.3%
Rank #147 / 171
146166
Encore Village of Schaumburg
NH
AL
IL
MC
Schaumburg
109
Facility 109
IL AVG 86
Rank #108 / 426
55.4%
Facility 55.4%
IL AVG 69.3%
Rank #169 / 204
-20%
3.46
Facility 3.46
IL AVG 3.10
Rank #54 / 172
+8%+12%
$25.5k
Facility $25.5k
IL AVG $151.3k
Rank #94 / 173
28
Facility 28
IL AVG 36.8
Rank #69 / 172
2.6
Facility 2.6
IL AVG 3.7
Rank #28 / 172
2105A+
58
Facility 58
IL AVG 51
Rank #253 / 648
Il Ccrc, LLC
$16.2M
Facility $16.2M
IL AVG $12.2M
Rank #1 / 171
$15.9M
Facility $15.9M
IL AVG $4.8M
Rank #4 / 171
98.3%
Facility 98.3%
IL AVG 44.3%
Rank #171 / 171
145341
Bella Terra Wheeling
NH
HC
MC
PC
Wheeling
120
Facility 120
IL AVG 86
Rank #80 / 426
72.1%
Facility 72.1%
IL AVG 69.3%
Rank #115 / 204
+4%
3.07
Facility 3.07
IL AVG 3.10
Rank #67 / 172
+159%-1%
$0
Facility $0
IL AVG $151.3k
Rank #1 / 173
30
Facility 30
IL AVG 36.8
Rank #79 / 172
3.3
Facility 3.3
IL AVG 3.7
Rank #69 / 172
197-
60
Facility 60
IL AVG 51
Rank #233 / 648
Bonny Mundt
$11.6M
Facility $11.6M
IL AVG $12.2M
Rank #64 / 171
$4.6M
Facility $4.6M
IL AVG $4.8M
Rank #91 / 171
39.8%
Facility 39.8%
IL AVG 44.3%
Rank #137 / 171
145737

Financial Assistance for
Nursing Home in Illinois

Bella Terra Wheeling is located in Wheeling, Illinois.
Here are the financial assistance programs available to residents in Illinois.

Get Financial aid guidance

Community Care Program

Illinois CCP

Age 60+
General Illinois resident, at risk of nursing home placement.
Income Limits (2025) ~$1,215/month individual
Asset Limits $17,500 individual, excludes home, car
IL

High demand in urban areas; waitlists possible.

Benefits
In-home care (3-5 hours/day) Adult day services ($65/day) Emergency home response systems ($30/month)

Illinois Respite Program

IL Respite (via NFCSP)

Age Caregiver of someone 60+ (or with dementia)
General Illinois resident.
Income Limits No strict limit; prioritizes low-income.
Asset Limits Not applicable.
IL

Limited slots; urban/rural balance.

Benefits
In-home respite (4-6 hours/day) Adult day care (~$65/day) Short-term facility care (up to 5 days)

Supportive Living Program (SLP)

Illinois Medicaid Supportive Living Program

Age 65+ or 22-64 with disability
General Illinois resident, Medicaid-eligible, needs moderate assistance (not nursing home-level).
Income Limits (2025) ~$2,829/month (300% FBR, individual); QIT allowed.
Asset Limits $2,000 (individual), $3,000 (couple) (excludes home, car).
IL

~200 SLP sites statewide; room/board not covered.

Benefits
Personal care (5-7 hours/day, e.g., bathing, mobility) Meals Housekeeping Medication management Respite (~240 hours/year)

Persons Who Are Elderly Waiver

Illinois Medicaid Elderly Waiver

Age 65+
General Illinois resident, Medicaid-eligible, nursing home-level care need.
Income Limits (2025) ~$2,829/month 300% FBR, individual
Asset Limits $2,000 (individual), $3,000 (couple).
IL

Part of HealthChoice Illinois; consumer-directed options available.

Benefits
Personal care (5-7 hours/day, e.g., dressing, eating) Homemaker Adult day care (~$60/day) Respite (240 hours/year) Home mods ($1,000 avg.)

Medicare Savings Program (MSP)

Illinois Medicare Savings Program

Age 65+ or disabled
General Illinois resident, Medicare Part A/B.
Income Limits (2025) ~$2,510/month (QMB), ~$3,380/month (SLMB), ~$3,598/month (QI)—individual.
Asset Limits $9,430 (individual), $14,130 (couple).
IL

Three tiers; no waitlist.

Benefits
Covers Part B premiums ($174.70/month) Deductibles ($240/year) Copays (~20%)

Optional State Supplementation (OSS)

Illinois Optional State Supplementation

Age 65+ or disabled
General Illinois resident, in approved facility, SSI recipient or low-income.
Income Limits (2025) ~$1,004/month including SSI
Asset Limits $2,000 (individual), $3,000 (couple).
IL

~$50-$500/month based on facility type.

Benefits
Cash (~$50-$500/month) for room/board in personal care homes or SLFs

VA Aid and Attendance (A&A) and Housebound Benefits

Illinois VA Aid and Attendance/Housebound

Age 65+ or disabled veteran/spouse
General Illinois resident, wartime service, need for ADL help (A&A) or homebound.
Income Limits (2025) Net income < ~$1,984/month (veteran with dependent, A&A); pension offsets income.
Asset Limits ~$155,356 net worth limit
IL

High veteran demand in urban/rural areas.

Benefits
Cash (~$1,433-$2,642/month veteran, ~$951-$1,318 spouse) for care costs (e.g., in-home, assisted living)

Frequently Asked Questions about Bella Terra Wheeling

Is Bella Terra Wheeling in a walkable area?

Bella Terra Wheeling has a walk score of 60. Moderately walkable. Some errands can be accomplished on foot, with a mix of nearby amenities.

What is the occupancy rate at Bella Terra Wheeling?

Bella Terra Wheeling's occupancy is 72.1%.

Are there photos of Bella Terra Wheeling?

Yes — there are 21 photos of Bella Terra Wheeling in the photo gallery on this page.

What is the address of Bella Terra Wheeling?

Bella Terra Wheeling is located at 730 W Hintz Rd, Wheeling, IL 60090.

What is the phone number of Bella Terra Wheeling?

(847) 537-7474 will put you in contact with the team at Bella Terra Wheeling.

Is Bella Terra Wheeling Medicare or Medicaid certified?

Yes — Bella Terra Wheeling is a CMS-certified provider of Medicare and Medicaid.

Guides for Better Senior Living

Care Cost Calculator: See Prices in Your Area

Nursing Home Data Explorer

Don’t Wait Too Long: 7 Red Flag Signs Your Parent Needs Assisted Living Now

The True Cost of Assisted Living in 2025 – And How Families Are Paying For It

Understanding Senior Living Costs: Pricing Models, Discounts & Financial Assistance