CareOne at Concord
Nursing Home, Memory Care & Respite Care · Concord, MA
CMS overall rating Info CMS (the Centers for Medicare & Medicaid Services) is the federal agency that rates nursing home quality. Its Overall Rating runs from 1 to 5 stars, combining health inspections, staffing, and quality measures, with inspections weighted most heavily.

CareOne at Concord

Nursing Home, Memory Care & Respite Care · Concord, MA
CMS overall rating Info CMS (the Centers for Medicare & Medicaid Services) is the federal agency that rates nursing home quality. Its Overall Rating runs from 1 to 5 stars, combining health inspections, staffing, and quality measures, with inspections weighted most heavily.
Calculator: See prices in your area
CareOne at Concord accepts Medicare, Medicaid, and private pay.

Overview of Careone at Concord

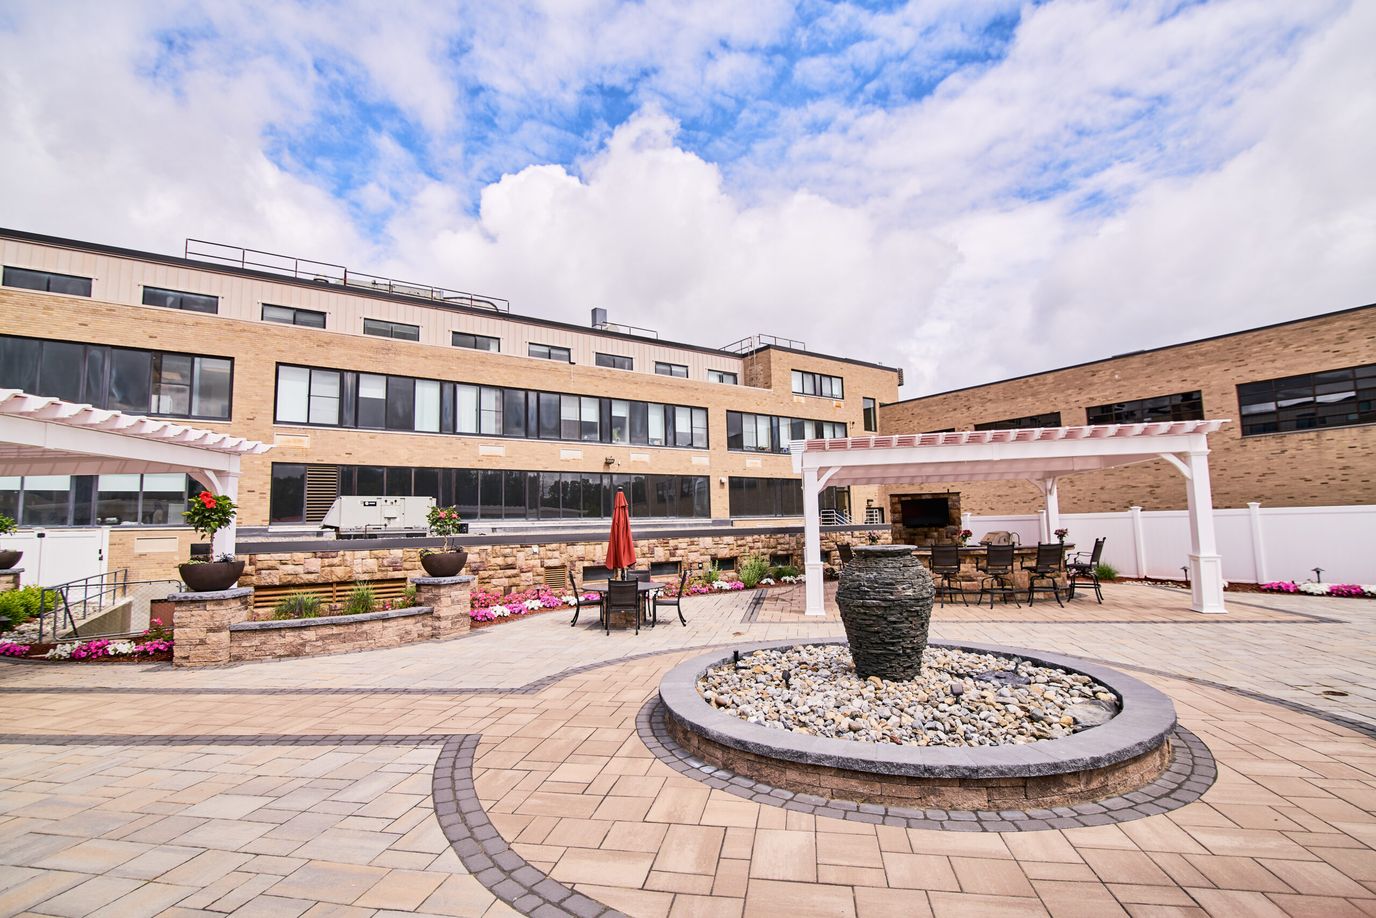
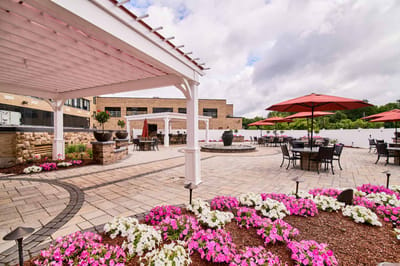
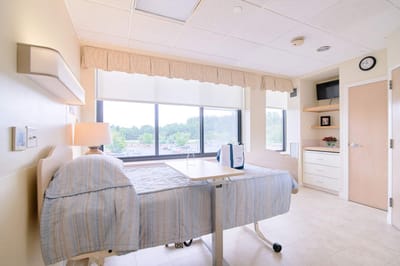
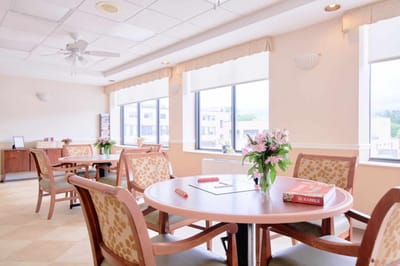
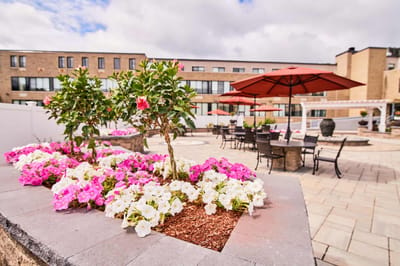
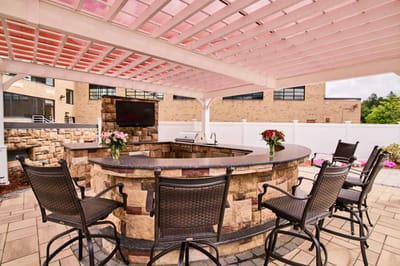
Make your dream retirement happen with Careone at Concord, a warm and welcoming community in Concord, MA, designed for rehabilitation, long-term care, and memory care. They help residents avoid rehospitalization by offering them physician-led programs tailored to their unique needs and circumstances. Those living with chronic conditions are guaranteed a high quality of life with complex medical services, such as medication management and health monitoring services available to them.

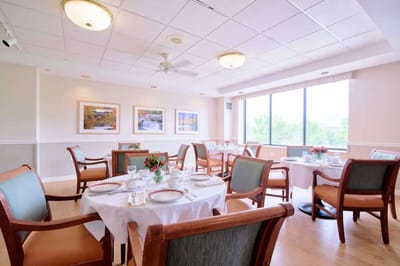
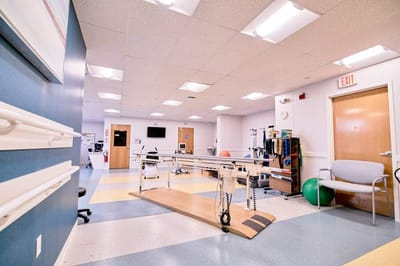
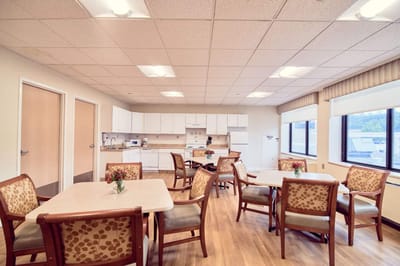
Individuals living with memory conditions like Alzheimer’s and other forms of dementia are provided with a range of care and supportive services tailored to improve their cognition and physical functioning. Thoughtful amenities like movie theaters, restaurant-style dining, and daily housekeeping are also available to make residents’ lives more comfortable and pleasing. At Careone at Concord, they ensure residents are equipped with all the tools and support they need to thrive and live their best lives.

Quality ratings

Measured by Centers for Medicare & Medicaid Services (CMS)

Overall rating Info The Overall CMS Rating combines results from health inspections, staffing levels and quality measures. Health inspections carry the most weight. Staffing and quality scores can increase or decrease the final rating based on performance compared to state and national standards.
▲ 38.0% Above MA avg. ▲ 38.0% Above MA avg.MA average: 2.9Click the badge to see the full State ranking.Click here to see the full State ranking.
Health Inspection Info Based on the results of the facility's three most recent standard inspections and any complaint investigations. CMS reviews the number, scope, and severity of deficiencies, with more recent findings weighted more heavily.
▲ 40.5% Above MA avg. ▲ 40.5% Above MA avg.MA average: 2.8Click the badge to see the full State ranking.Click here to see the full State ranking.
Staffing Info Measures average nursing staff hours per resident per day, including Registered Nurses (RNs) and total nursing staff. Ratings are adjusted based on the level of care residents require and are compared to state and national benchmarks.
At MA avg. At MA avg.MA average: 3.0Click the badge to see the full State ranking.Click here to see the full State ranking.
Quality Measures Info Based on clinical and physical health indicators reported to CMS, such as hospital readmissions, falls, pressure ulcers, and improvements in mobility. These measures reflect how well residents' health needs are being managed.
▲ 25.8% Above MA avg. ▲ 25.8% Above MA avg.MA average: 3.2Click the badge to see the full State ranking.Click here to see the full State ranking.

Staffing hours breakdown

Info Daily nursing hours per resident by staff type, reported to CMS. Higher is generally better — compare this facility to state and national averages to see where staffing stands.

Hours per resident per day — compared to Massachusetts state averages

Total nursing care / resident Info This home is ranked 43rd out of 93 homes in Massachusetts for nurse hours. Total adjusted nursing hours per resident per day, combining RN, LPN, and aide time. CMS adjusts this for case-mix so facilities can be fairly compared.
3h 51m per day
Rank #43 / 93Nurse hours — State benchmarkedThis home is ranked 43rd out of 93 homes in Massachusetts. Shows adjusted nurse hours per resident per day benchmarked to the Massachusetts average, with a ranking across 93 Massachusetts facilities. More hours mean more direct care. The national average is about 3.5 hrs; below 3.0 is a red flag.Rankings are based only on facilities in Massachusetts that report data for that category. Facilities without available data are excluded from the ranking.Click the rank badge to see the full State ranking.Click here to see the full State ranking.
This facility Massachusetts avg (3h 56m per day)
vs Massachusetts avg
-2%

4 of 6 metrics below state avg

Standout metric Physical Therapist is +67% above state avg
Staff typeHours / Day / Residentvs state avg
Registered Nurse (RN) Info RNs hold the highest nursing license and can assess residents, interpret test results, and direct care plans. More RN hours per day often signals stronger clinical oversight and faster response to health changes. 18m per day ▼ 53% State avg: 39m per day · National avg: 41m per day
LPN / LVN Info Licensed Practical Nurses (LPNs) or Licensed Vocational Nurses (LVNs) deliver routine hands-on care — medication administration, wound dressing, and monitoring vital signs. They work under RN supervision and make up a large share of daily bedside care. 1h 12m per day ▲ 24% State avg: 58m per day · National avg: 52m per day
Nurse Aide Info Certified Nurse Aides (CNAs) provide the most direct day-to-day assistance: bathing, dressing, feeding, and mobility. Nurse aide hours are typically the largest staffing category and directly affect residents' quality of life. 2h 3m per day ▼ 9% State avg: 2h 16m per day · National avg: 2h 21m per day
Weekend Total Nursing Info Combined nursing hours (RN + LPN + Nurse Aide) per resident per day on weekends. Staffing often drops on weekends — this figure reveals whether the facility maintains adequate coverage outside of weekday hours. 3h 18m per day ▼ 4% State avg: 3h 27m per day · National avg: 3h 26m per day
Physical Therapist Info Hours per resident per day provided by licensed Physical Therapists (PTs) or PT Assistants. PT services help residents recover mobility after injury or illness and are especially important for post-acute (short-stay) rehabilitation. 7m per day ▲ 67% State avg: 4m per day · National avg: 4m per day
Weekend RN Info Registered nurse hours specifically on weekends. Facilities sometimes reduce RN presence on Saturdays and Sundays — a low weekend RN figure compared to weekday hours can indicate reduced clinical oversight when most administrative staff are absent. 7m per day ▼ 77% State avg: 28m per day · National avg: 29m per day

Capacity and availability

This home usually has limited availability

Higher occupancy than the Massachusetts average: 82%
Occupancy rate
85.3% Rank #48 / 96Occupancy rate — State benchmarkedThis home is ranked 48th out of 96 homes in Massachusetts. Shows this facility's occupancy rate versus the Massachusetts average, with its Statewide rank out of 96. Higher occupancy signals strong local demand and financial stability.Rankings are based only on facilities in Massachusetts that report data for that category. Facilities without available data are excluded from the ranking.Click the rank badge to see the full State ranking.Click here to see the full State ranking.
Avg. Length of Stay
67 days
Bed community size
135-bed community Rank #42 / 280Bed count — State benchmarkedThis home is ranked 42nd out of 280 homes in Massachusetts. Shows this facility's certified or reported bed count compared to other Massachusetts facilities. Larger communities may offer more amenities, programs, and on-site services for residents and families.Rankings are based only on facilities in Massachusetts that report data for that category. Facilities without available data are excluded from the ranking.Click the rank badge to see the full State ranking.Click here to see the full State ranking.
A larger shared setting that may offer more common spaces and organized community services.
Walk Score
Walk Score: 24 / 100 Rank #386 / 499Walk Score — State benchmarkedThis home is ranked 386th out of 499 homes in Massachusetts. Shows how walkable this facility's neighborhood is compared to the average Walk Score across Massachusetts facilities. Higher scores benefit residents, families, and staff.Rankings are based only on facilities in Massachusetts that report data for that category. Facilities without available data are excluded from the ranking.Click the rank badge to see the full State ranking.Click here to see the full State ranking.
Car-dependent. Most errands require a car, with limited nearby walkable options.

Payment & Insurance

1 service
Accept Medicare

Therapy & Rehabilitation

3 services
Rehabilitation Services
Respite Care
Short-Term Rehab

Staffing & Medical

1 service
24-Hour Staffing

Additional Services

1 service
Post-Acute Care & Rehab

Amenities & Lifestyle

24/7 Nursing
Dedicated Sub-Acute Units
Fitness / Wellness Center
Housekeeping
Private Bathrooms
Restaurant-Style Dining
Specific ProgramsCardiac Care Management, Complex Medical, Diabetes Management, Orthopedic Rehabilitation, Pulmonary Rehabilitation, Stroke Recovery, Wound Care Management

Contact CareOne at Concord

Staffing Data

Reporting period: October 1 – December 31, 2025 (Q4 2025). Source: CMS Payroll-Based Journal report.

Total staff 139
Employees 132
Contractors 7
Staff to resident ratio 1.14 : 1
31% fewer staff per resident than Massachusetts average
Massachusetts average ratio: 1.66 : 1 Massachusetts average ratio: 1.66 : 1See full Massachusetts ranking
Avg staff/day 64
Average shift 8.7 hours
10% better than Massachusetts average
Massachusetts average: 7.9 hours Massachusetts average shift: 7.9 hoursSee full Massachusetts ranking
Total staff hours (quarter) 51,474

Nursing staff breakdown

Q4 2025 · Oct 1 – Dec 31 More info This data comes from the CMS Payroll-Based Journal report covering October 1 – December 31, 2025.
Registered Nurse

Manages medical care and health needs.

RN Staff Info All 4 RN Staff are full-time employees. No contractors work on this role. 4
Average shift length Info Average shift length. Calculated as total hours divided by days worked and average staff per day. 8.7 hours
Licensed Practical Nurse

Assists with medical care and medications.

LPN Staff Info 22 total: 18 full-time employees and 4 contractors. 22
Average shift length Info Average shift length. Calculated as total hours divided by days worked and average staff per day. 9.8 hours
Certified Nursing Assistant

Helps with daily care and mobility.

CNA Staff Info All 48 CNA Staff are full-time employees. No contractors work on this role. 48
Average shift length Info Average shift length. Calculated as total hours divided by days worked and average staff per day. 9.1 hours

Contractor staffing

Q4 2025 · Oct 1 – Dec 31 More info This data comes from the CMS Payroll-Based Journal report covering October 1 – December 31, 2025.

Total hours from contractors

1.1%

542 contractor hours this quarter

Licensed Practical Nurse: 4 Physical Therapy Assistant: 2 Medical Director: 1

Staff by category

Q4 2025 · Oct 1 – Dec 31 More info This data comes from the CMS Payroll-Based Journal report covering October 1 – December 31, 2025.
Certified Nursing Assistant4804824,17292100%9.1
Licensed Practical Nurse1842210,24992100%9.8
RN Director of Nursing9093,83392100%8.3
Other Dietary Services Staff110112,65892100%7.2
Physical Therapy Assistant112131,8887986%7.6
Clinical Nurse Specialist110111,8377177%7.7
Registered Nurse4041,3238896%8.7
Respiratory Therapy Technician8081,30792100%7.6
Speech Language Pathologist2029027379%7.9
Administrator1015046368%8
Occupational Therapy Aide2024665762%8
Nurse Practitioner1014566065%7.6
Dietitian1014525762%7.9
Mental Health Service Worker1014035155%7.9
Dental Services Staff2023715358%6.3
Qualified Social Worker1013584650%7.8
Physical Therapy Aide1012473841%6.5
Medical Director0115033%16.7
48 Certified Nursing Assistant
% of Days 100%
22 Licensed Practical Nurse
% of Days 100%
9 RN Director of Nursing
% of Days 100%
11 Other Dietary Services Staff
% of Days 100%
13 Physical Therapy Assistant
% of Days 86%
11 Clinical Nurse Specialist
% of Days 77%
4 Registered Nurse
% of Days 96%
8 Respiratory Therapy Technician
% of Days 100%
2 Speech Language Pathologist
% of Days 79%
1 Administrator
% of Days 68%
2 Occupational Therapy Aide
% of Days 62%
1 Nurse Practitioner
% of Days 65%
1 Dietitian
% of Days 62%
1 Mental Health Service Worker
% of Days 55%
2 Dental Services Staff
% of Days 58%
1 Qualified Social Worker
% of Days 50%
1 Physical Therapy Aide
% of Days 41%
1 Medical Director
% of Days 3%

Penalties and fines

Includes penalties issued in 2023

Federal penalties imposed by CMS for regulatory violations, including civil money penalties (fines) and denials of payment for new Medicare/Medicaid admissions.

Source: CMS Penalties Database (Data as of Jan 2026)

Total fines amount $8K Rank #50 / 94Federal fines — State benchmarkedThis home is ranked 50th out of 94 homes in Massachusetts. Shows this facility's cumulative CMS federal fine dollars versus the Massachusetts average among facilities with fines, and where it ranks among 94 facilities in the pool. Lower total dollars mean a better rank.Rankings are based only on facilities in Massachusetts that report data for that category. Facilities without available data are excluded from the ranking.Click the rank badge to see the full State ranking.Click here to see the full State ranking.
89% lower than Massachusetts average

Massachusetts average: $72K

Number of fines 1
42% fewer fines than Massachusetts average

Massachusetts average: 1.7

Payment Denials Info Serious action where Medicare and/or Medicaid temporarily stops payments for new residents until issues are fixed. 0
100% fewer payment denials than Massachusetts average

Massachusetts average: 0.1

Fines amount comparison
This facility $8K
Massachusetts average $72K
Penalty History

Penalties are imposed by CMS for violations of federal nursing home regulations.

1 penalty in the past 3 years

Nov 7, 2023 · $8K

Civil Money Penalty Info Fines imposed for noncompliance, which can be assessed per day or per instance of violation. Nov 7, 2023
$8K

Last updated: Jan 2026

Quality of care over time

These measures show how residents usually do over time at this home, based on health outcomes and preventive care.

High-risk clinical events score Info A composite score based on pressure ulcers, falls with injury, weight loss, walking ability decline, and activities of daily living decline. 10.7
5% worse than Massachusetts average

Massachusetts average: 10.2

Functional decline score Info A composite score based on activities of daily living decline, walking ability decline, and incontinence. 24.2
21% worse than Massachusetts average

Massachusetts average: 20.0

Long-stay resident measures
Significantly above average Massachusetts avg: 3.6 Info CMS star rating based on long-stay quality measure performance. 5 stars = significantly above average, 1 star = significantly below average.
Need for Help with Daily Activities Increased Info Percent of long-stay residents whose need for help with daily activities has increased 17.8%
5% better than Massachusetts average

Massachusetts average: 18.7%

Walking Ability Worsened Info Percent of long-stay residents whose ability to move independently worsened 27.3%
41% worse than Massachusetts average

Massachusetts average: 19.3%

Low Risk Residents with Bowel/Bladder Incontinence Info Percent of low risk long-stay residents who lose control of their bowels or bladder 27.4%
24% worse than Massachusetts average

Massachusetts average: 22.1%

Falls with Major Injury Info Percent of long-stay residents experiencing one or more falls with major injury 2.3%
36% better than Massachusetts average

Massachusetts average: 3.6%

High Risk Residents with Pressure Ulcers Info Percent of long-stay high risk residents with pressure ulcers 4.2%
9% better than Massachusetts average

Massachusetts average: 4.7%

Urinary Tract Infection Info Percent of long-stay residents with a urinary tract infection 0.3%
86% better than Massachusetts average

Massachusetts average: 2.1%

Lost Too Much Weight Info Percent of long-stay residents who lose too much weight 2.1%
60% better than Massachusetts average

Massachusetts average: 5.2%

Depressive Symptoms Info Percent of long-stay residents who have depressive symptoms 2.8%
74% better than Massachusetts average

Massachusetts average: 10.7%

Antipsychotic Use Info Percent of long-stay residents who received an antipsychotic medication 27.9%
38% worse than Massachusetts average

Massachusetts average: 20.3%

Pneumococcal Vaccine Info Percent of long-stay residents assessed and appropriately given the pneumococcal vaccine 78.7%
14% worse than Massachusetts average

Massachusetts average: 91.9%

Influenza Vaccine Info Percent of long-stay residents assessed and appropriately given the seasonal influenza vaccine 92.6%
In line with Massachusetts average

Massachusetts average: 94.8%

Hospitalizations per 1,000 days Info Number of hospitalizations per 1,000 long-stay resident days. 1.23
34% better than Massachusetts average

Massachusetts average: 1.86

ED visits per 1,000 days Info Number of outpatient emergency department visits per 1,000 long-stay resident days. 0.98
36% better than Massachusetts average

Massachusetts average: 1.54

Short-stay resident measures
Average Massachusetts avg: 3.2 Info CMS star rating based on short-stay quality measure performance. 5 stars = much above average, 1 star = much below average.
Pneumococcal Vaccine Info Percent of short-stay residents assessed and appropriately given the pneumococcal vaccine 74.7%
In line with Massachusetts average

Massachusetts average: 76.7%

Antipsychotic medication increase Info Percent of short-stay residents who newly received an antipsychotic medication 0.5%
64% better than Massachusetts average

Massachusetts average: 1.3%

Influenza Vaccine Info Percent of short-stay residents assessed and appropriately given the seasonal influenza vaccine 59.5%
23% worse than Massachusetts average

Massachusetts average: 77.7%

Re-hospitalized after SNF stay Info Percentage of short-stay residents who were re-hospitalized after their nursing home admission. 31.9%
24% worse than Massachusetts average

Massachusetts average: 25.8%

Emergency department visits Info Percentage of short-stay residents who had an outpatient emergency department visit. 13.5%
14% worse than Massachusetts average

Massachusetts average: 11.8%

Falls with major injury Info Percentage of SNF residents who experience falls with major injury during their stay. 0.4%
49% better than Massachusetts average

Massachusetts average: 0.8%

Ability to care for self at discharge Info Percentage of residents at or above expected ability to care for themselves at discharge. 51.5%
In line with Massachusetts average

Massachusetts average: 53.7%

Successful return to home or community Info Rate of successful return to home or community from a skilled nursing facility. 63.3%
25% better than Massachusetts average

Massachusetts average: 50.6%

Breakdown by payment type

Medicare

48% of new residents, usually for short-term rehab.

Typical stay 20 days

Private pay

50% of new residents, often for short stays.

Typical stay 1 - 2 months

Medicaid

2% of new residents, often for long-term daily care.

Typical stay 5 years

Facility Characteristics

Source: CMS Long-Term Care Facility Characteristics (Data as of Jan 2026)

Total residents 122
Medicare
20
16.4% of residents
Medicaid
72
59% of residents
Private pay or other
30
24.6% of residents
Programs & Services
Residents Group

Residents meet regularly to discuss policies, care quality, and activities

Active Resident Council

Organized group of residents that meets regularly to discuss facility policies, quality of life, and activities.

Finances and operations

Based on CMS SNF Cost Report for fiscal year ending in 12/2023.

For-profit
LLC
Net patient revenue Info Net patient revenue — what the home actually collects for resident care, after contractual allowances, bad debt and discounts are subtracted from its gross charges (CMS cost report, Worksheet G-3). It covers resident care only; money the home earns from other sources is shown separately as "Other income."
$17.4M
Net patient income Info Net patient income: net patient revenue minus the home's total operating expenses. A positive figure means it earns more from resident care than it spends to deliver it; a negative figure means the opposite. It excludes non-operating "other income."
-$609.7K
For-profit LLC
Net patient revenue Info Net patient revenue — what the home actually collects for resident care, after contractual allowances, bad debt and discounts are subtracted from its gross charges (CMS cost report, Worksheet G-3). It covers resident care only; money the home earns from other sources is shown separately as "Other income."
$17.4M Rank #17 / 96Revenue — State benchmarkedThis home is ranked 17th out of 96 homes in Massachusetts. Shows this facility's annual revenue compared to the Massachusetts average. Higher revenue generally means more resources for staffing and capital — read alongside Payroll %.Rankings are based only on facilities in Massachusetts that report data for that category. Facilities without available data are excluded from the ranking.Click the rank badge to see the full State ranking.Click here to see the full State ranking.
Net patient income Info Net patient income: net patient revenue minus the home's total operating expenses. A positive figure means it earns more from resident care than it spends to deliver it; a negative figure means the opposite. It excludes non-operating "other income."
-$609.7K
Other income Info Money the home earns outside of resident care — such as investments, grants, rentals and other non-operating sources (CMS cost report, Worksheet G-3). It is tracked separately from net patient revenue: it is not part of that figure, and it is not included in net patient income.
$418.0K
Payroll costs Info Staff salaries plus wage-related costs — benefits such as payroll taxes, health insurance and retirement — from the home's own accounting records (CMS cost report, Worksheet A). Contract or agency labor is counted separately, under other operating costs. Rank #42 / 96Payroll — State benchmarkedThis home is ranked 42nd out of 96 homes in Massachusetts. Shows total annual staff payroll benchmarked to the Massachusetts average. Higher payroll investment relative to peers often signals better staffing and less reliance on cheaper contract labor.Rankings are based only on facilities in Massachusetts that report data for that category. Facilities without available data are excluded from the ranking.Click the rank badge to see the full State ranking.Click here to see the full State ranking.
$10.4M 59.8% of net patient revenue Info Payroll as a share of revenue: staff salaries and wage-related benefits divided by net patient revenue. A higher figure means more of each revenue dollar goes to staff pay. Rank #93 / 96Payroll % — State benchmarkedThis home is ranked 93rd out of 96 homes in Massachusetts. Shows payroll as a percentage of revenue versus the Massachusetts average. Well-run Massachusetts facilities typically land around 54–65% — the top third Statewide. Below 25% may signal understaffing or heavy agency use — read with Staffing ratings.Rankings are based only on facilities in Massachusetts that report data for that category. Facilities without available data are excluded from the ranking.Click the rank badge to see the full State ranking.Click here to see the full State ranking.
Other operating costs Info Everything it costs to run the home apart from payroll — food, utilities, supplies, maintenance, contract labor and administration. Calculated as total operating expense minus payroll (staff salaries and wage-related benefits).
$7.6M
Total costs Info The home's total operating expense for the year — all the costs of running it, salaries included (CMS cost report, Worksheet G-3).
$18.0M

What does this home offer?

Housing options icon

Housing Options: Private / Semi-Private Rooms

Building type icon
Building type icon

Building Type: 2-story

Housekeeping icon
Housekeeping icon

Housekeeping Services

Recreational activities icon

Recreational Activities

Exercise program icon

Exercise Programs

Who this home usually serves

TYPE OF STAY

Mix of rehab and long-term care

This home supports both short-term rehab and long-term care, with residents staying for a wide range of durations.

Most new residents arrive under private pay (50% of admissions), and a typical private pay stay runs around 1 - 2 months.

Admissions
632 total

Coverage residents most often arrive under.

Medicare 48%
Private pay 50%
Medicaid 2%
Discharges
623 total

Coverage residents most often leave under.

Medicare 43%
Private pay 48%
Medicaid 9%

CareOne at Concord Reviews

Care one kills
If you want your loved ones to die, this is the place to send them. There are evil demonic people in this place, and they torture intimidate the seniors and patients at this place There are a couple of people during the day that’s good, but the overnight are very evil and they toward these patients while nobody’s looking I do think it would be difficult if the administration do not know what’s going on because it has to be complaint check yelp for your reviewsWhat do you like most about living here? Answer: Nothing is good about that place Are there enough caregivers to handle the residents' needs, especially during emergencies? Answer: No 
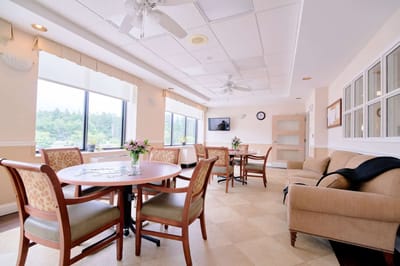
Are the common areas pleasant and comfortable for socializing or relaxing? Answer: No How would you rate the quality and variety of the meals? (1-5) Answer: 1 Are special diets handled well? Answer: No Is the dining schedule flexible enough to meet your preferences? Answer: No How do you feel about the level of social interaction available with other residents? Answer: I would not send a sick animal. There is a demonic evil place where they kill their patients. How was the units offered in this community? Answer: The community of Concord should be ashamed that they have this in their community Do you feel safe living in this community? Answer: No How well do you think the community handles emergencies or unexpected events? Answer: Are there any hidden fees or unexpected charges? Answer: Would you recommend this community to others looking for senior living options? Answer: Is there anything you wish you knew before moving in? Answer:

Places of interest near CareOne at Concord

Address 1.5 miles from city center Info Estimated distance in miles from Concord's city center to CareOne at Concord's address, calculated via Google Maps.

Calculate Travel Distance to CareOne at Concord

Add your location

Address

Compare Nursing Homes around Middlesex County

The information below is reported by the Massachusetts Executive Office of Elder Affairs and Department of Public Health.

5 facilities compared · CMS & MA Dept. of Health data

The Leonard Florence Center
NH
ADC
HC
MC
PC
RC
Chelsea (Admirals Hill)
100
Facility 100
MA AVG 94
Rank #94 / 280
96.7%
Facility 96.7%
MA AVG 82%
Rank #4 / 96
+18%
4.76
Facility 4.76
MA AVG 3.93
Rank #10 / 93
0%+21%
$0
Facility $0
MA AVG $76.6k
Rank #1 / 94
13
Facility 13
MA AVG 32.7
Rank #17 / 93
4.3
Facility 4.3
MA AVG 7.2
Rank #23 / 93
-98-
88
Facility 88
MA AVG 53
Rank #63 / 499
Adam Ernst
$20.6M
Facility $20.6M
MA AVG $17.4M
Rank #27 / 96
$14.3M
Facility $14.3M
MA AVG $6.5M
Rank #16 / 96
69.6%
Facility 69.6%
MA AVG 43.6%
Rank #28 / 96
225775
Life Care Center of Nashoba Valley
NH
MC
Littleton
120
Facility 120
MA AVG 94
Rank #63 / 280
85.4%
Facility 85.4%
MA AVG 82%
Rank #47 / 96
+4%
4.16
Facility 4.16
MA AVG 3.93
Rank #24 / 93
-14%+6%
$0
Facility $0
MA AVG $76.6k
Rank #1 / 94
15
Facility 15
MA AVG 32.7
Rank #21 / 93
5.0
Facility 5.0
MA AVG 7.2
Rank #31 / 93
-112-
5
Facility 5
MA AVG 53
Rank #486 / 499
Shari Laroche
$14.4M
Facility $14.4M
MA AVG $17.4M
Rank #28 / 96
$10.1M
Facility $10.1M
MA AVG $6.5M
Rank #40 / 96
70%
Facility 70%
MA AVG 43.6%
Rank #74 / 96
225569
CareOne at Concord
NH
MC
RC
Concord (Old Road To Nine Acre Corner)
135
Facility 135
MA AVG 94
Rank #42 / 280
85.3%
Facility 85.3%
MA AVG 82%
Rank #48 / 96
+4%
3.85
Facility 3.85
MA AVG 3.93
Rank #43 / 93
-77%-2%
$7.9k
Facility $7.9k
MA AVG $76.6k
Rank #50 / 94
4
Facility 4
MA AVG 32.7
Rank #2 / 93
1.3
Facility 1.3
MA AVG 7.2
Rank #1 / 93
1128-
24
Facility 24
MA AVG 53
Rank #386 / 499
-
$17.4M
Facility $17.4M
MA AVG $17.4M
Rank #17 / 96
$10.4M
Facility $10.4M
MA AVG $6.5M
Rank #42 / 96
59.8%
Facility 59.8%
MA AVG 43.6%
Rank #93 / 96
225663
Life Care Center of Acton
NH
Acton (East Acton)
155
Facility 155
MA AVG 94
Rank #26 / 280
74.2%
Facility 74.2%
MA AVG 82%
Rank #69 / 96
-9%
3.73
Facility 3.73
MA AVG 3.93
Rank #58 / 93
-51%-5%
$0
Facility $0
MA AVG $76.6k
Rank #1 / 94
16
Facility 16
MA AVG 32.7
Rank #24 / 93
5.3
Facility 5.3
MA AVG 7.2
Rank #34 / 93
1125-
39
Facility 39
MA AVG 53
Rank #319 / 499
Christopher Foye
$13.2M
Facility $13.2M
MA AVG $17.4M
Rank #43 / 96
$9.1M
Facility $9.1M
MA AVG $6.5M
Rank #48 / 96
68.6%
Facility 68.6%
MA AVG 43.6%
Rank #60 / 96
225191
Belmont Manor Nursing & Rehabilitation Center
NH
MC
Belmont (Waverley Square)
156
Facility 156
MA AVG 94
Rank #25 / 280
--
4.72
Facility 4.72
MA AVG 3.93
Rank #11 / 93
+8%+20%
$18.5k
Facility $18.5k
MA AVG $76.6k
Rank #71 / 94
28
Facility 28
MA AVG 32.7
Rank #50 / 93
7.0
Facility 7.0
MA AVG 7.2
Rank #58 / 93
119A+
79
Facility 79
MA AVG 53
Rank #123 / 499
Stewart Karger
$21.2M
Facility $21.2M
MA AVG $17.4M
Rank #42 / 96
$14.5M
Facility $14.5M
MA AVG $6.5M
Rank #12 / 96
68.6%
Facility 68.6%
MA AVG 43.6%
Rank #8 / 96
225419

Financial Assistance for
Nursing Home in Massachusetts

CareOne at Concord is located in Concord, Massachusetts.
Here are the financial assistance programs available to residents in Massachusetts.

Get Financial aid guidance

Home Care Program

MassHealth Home Care

Age 60+
General Massachusetts resident, at risk of nursing home placement.
Income Limits (2025) ~$1,500/month individual, varies by region
Asset Limits $2,000 individual, excludes home, car
MA

Coordinated through Aging Services Access Points (ASAPs); high demand in urban areas.

Benefits
In-home care (3-5 hours/day) Homemaker services Respite care (up to 14 days/year) Adult day care (~$75/day)

Frail Elder Waiver

Massachusetts Medicaid FE Waiver

Age 65+
General Massachusetts resident, Medicaid-eligible, nursing home-level care need.
Income Limits (2025) ~$2,829/month 300% FBR, individual
Asset Limits $2,000 (individual), $3,000 (couple).
MA

Requires clinical eligibility determination.

Benefits
Personal care (5-7 hours/day) Respite care (240 hours/year) Adult day care (~$75/day) Home health services

Senior Care Options (SCO)

Massachusetts Senior Care Options

Age 65+
General Massachusetts resident, eligible for MassHealth (Medicare optional), nursing home-level care need.
Income Limits (2025) ~$2,829/month (300% FBR, individual); QIT allowed.
Asset Limits $2,000 (individual), $3,000 (couple) (excludes home up to $713,000, car).
MA

Not available in Dukes/Nantucket Counties; multiple SCO providers (e.g., CCA, Tufts).

Benefits
Personal care (5-7 hours/day) Medical care Respite (240 hours/year) Adult

Medicare Savings Program (MSP)

Massachusetts Medicare Savings Program (MassHealth Buy-In)

Age 65+ or disabled
General Massachusetts resident, Medicare Part A/B.
Income Limits (2025) ~$2,510/month (QMB), ~$3,380/month (SLMB), ~$3,598/month (QI)—individual.
Asset Limits $9,430 (individual), $14,130 (couple).
MA

Three tiers; no waitlist; includes Extra Help for Part D.

Benefits
Covers Part B premiums ($174.70/month) Deductibles ($240/year) Copays (~20%)

National Family Caregiver Support Program (NFCSP) Respite

Massachusetts NFCSP Respite Care

Age
General Caregivers of 60+ needing care or 55+ caregivers of others; Massachusetts resident; functional needs (2+ ADLs).
Income Limits (2025) Prioritizes ~$24,980/year (individual); no strict cap.
Asset Limits Not assessed; need-based.
MA

27 ASAPs; prioritizes low-income, rural caregivers.

Benefits
Respite (4-6 hours/week or 5 days/year) Adult day care ($60/day) Caregiver training Supplies (~$500/year)

Prescription Advantage

Massachusetts Prescription Advantage

Age 65+ or disabled
General Massachusetts resident, enrolled in Medicare Part D (or ineligible for Medicare).
Income Limits (2025) No strict limit; copays vary by income ~$24,980-$75,000/year individual
Asset Limits Not assessed.
MA

Supplements Medicare Part D; no enrollment fee for low-income.

Benefits
Covers prescription copays ($5-$40/drug) Fills coverage gaps Catastrophic cost protection ($4,000+ covered)

VA Aid and Attendance (A&A) and Housebound Benefits

Massachusetts VA Aid and Attendance/Housebound

Age 65+ or disabled veteran/spouse
General Massachusetts resident, wartime service, need for ADL help (A&A) or homebound.
Income Limits (2025) Net income < ~$1,984/month (veteran with dependent, A&A); pension offsets income.
Asset Limits ~$155,356 net worth limit
MA

High veteran demand statewide.

Benefits
Cash (~$1,433-$2,642/month veteran, ~$951-$1,318 spouse) for care costs (e.g., in-home, assisted living)

Frequently Asked Questions about CareOne at Concord

What neighborhood is CareOne at Concord in?

CareOne at Concord is in the Old Road to Nine Acre Corner neighborhood of Concord.

Is CareOne at Concord in a walkable area?

CareOne at Concord has a walk score of 24. Car-dependent. Most errands require a car, with limited nearby walkable options.

What is the occupancy rate at CareOne at Concord?

CareOne at Concord's occupancy is 85.3%.

Does CareOne at Concord operate as a for-profit or non-profit?

CareOne at Concord is registered as a for-profit in MA.

Are there photos of CareOne at Concord?

Yes — there are 14 photos of CareOne at Concord in the photo gallery on this page.

What is the address of CareOne at Concord?

CareOne at Concord is located at 57 Old Road To Nine Acre Corner, Concord, MA 01742.

What is the phone number of CareOne at Concord?

(978) 371-3400 will put you in contact with the team at CareOne at Concord.

Guides for Better Senior Living

Care Cost Calculator: See Prices in Your Area

Nursing Home Data Explorer

Don’t Wait Too Long: 7 Red Flag Signs Your Parent Needs Assisted Living Now

The True Cost of Assisted Living in 2025 – And How Families Are Paying For It

Understanding Senior Living Costs: Pricing Models, Discounts & Financial Assistance