


Total staff
65
Employees
59
Contractors
6
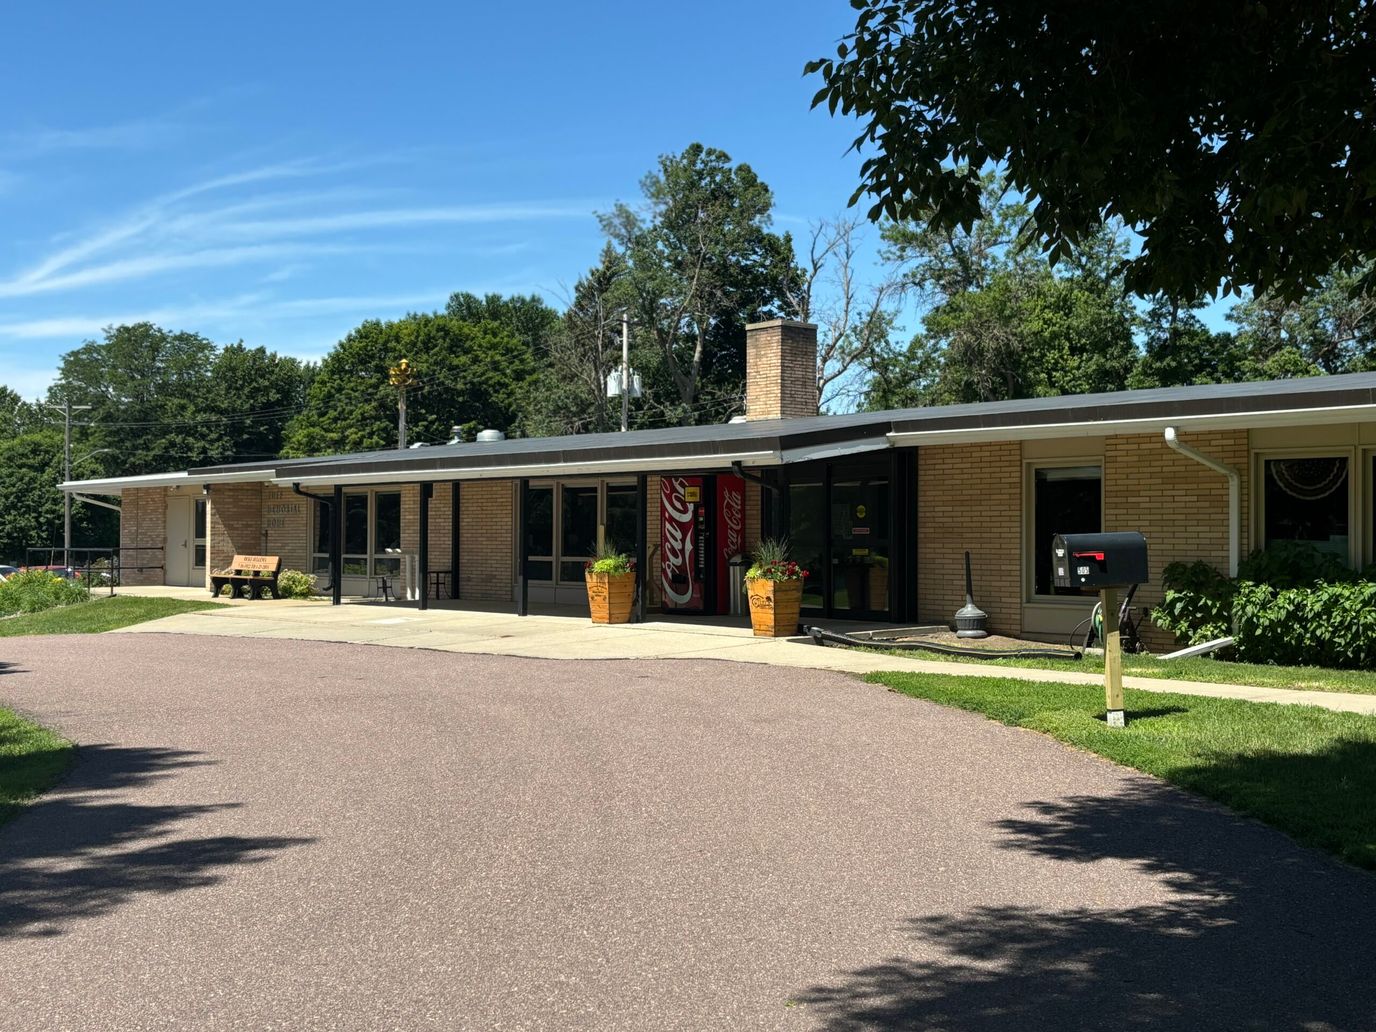
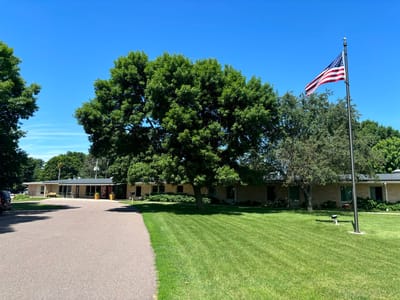
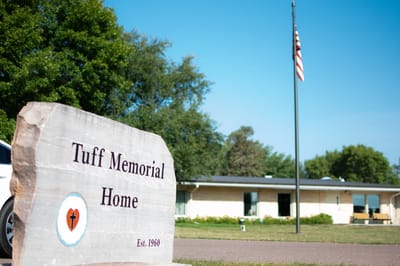
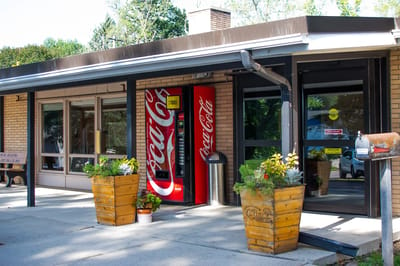
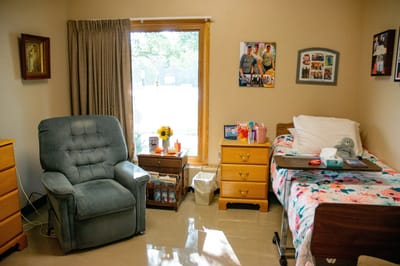
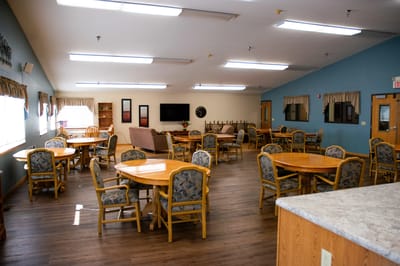
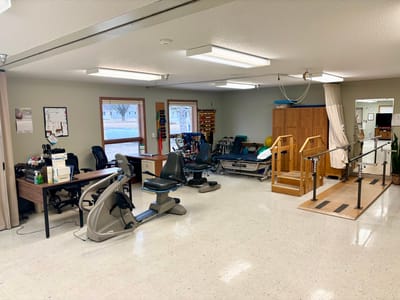
Tuff Memorial Home is a 48-bed nursing home in Hills, Minnesota, a small rural town near the South Dakota state line. The surrounding area is car-dependent, with a Walk Score of 8, which is standard for a community this rural and this size. Rehabilitation services, respite care, and 24-hour staffing are on-site. Medicare, Medicaid, and private pay are all accepted, while the minimum admission age is 50.
At 78% occupancy and an average length of stay of 285 days, the resident population here leans longer-term. The facility handles both extended care and rehabilitation admissions, though the stay-length average suggests the majority of residents are not short-term rehab cases. Total nursing hours are 4 hours and 47 minutes per resident per day; registered nurses account for 43 of those minutes.
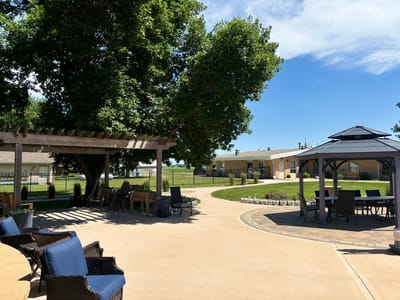
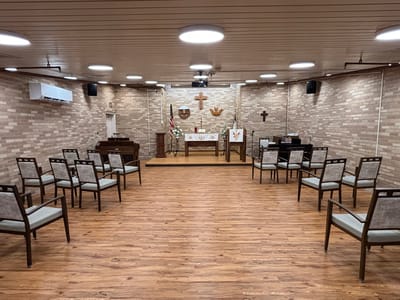
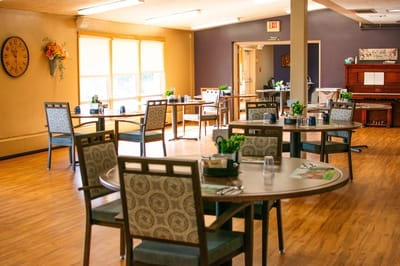
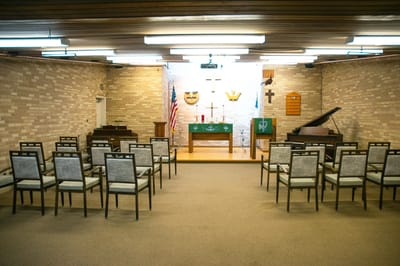
Meals are adapted to individual needs, with regular, liberalized, and modified diet options available. Housekeeping and utilities are included, and the facility has a chapel with Sunday morning services.
Two structural details stand out: first, the facility maintains both an Active Resident Council and an Active Family Council, which means there are organized, ongoing forums for raising concerns about care, policies, and daily life. Those aren’t universal in small rural nursing homes. Second, the dietary program specifically accommodates modified diets, which matters for residents with swallowing difficulties or other clinical dietary needs.
At 48 beds in a rural Minnesota town with Medicare, Medicaid, and private pay accepted, Tuff Memorial Home is a small, community-based nursing home that covers the essentials of long-term and rehabilitative care for the region it serves.
| Staff type | Hours / Day / Resident | vs state avg |
|---|---|---|
|
Registered Nurse (RN)
| 43m per day | ▼ 12% State avg: 49m per day · National avg: 41m per day |
|
LPN / LVN
| 18m per day | ▼ 37% State avg: 29m per day · National avg: 52m per day |
|
Nurse Aide
| 2h 56m per day | ▲ 14% State avg: 2h 34m per day · National avg: 2h 20m per day |
|
Weekend Total Nursing
| 3h 17m per day | ▼ 3% State avg: 3h 23m per day · National avg: 3h 27m per day |
|
Physical Therapist
| 0m per day | ▼ 100% State avg: 3m per day · National avg: 4m per day |
|
Weekend RN
| 22m per day | ▼ 28% State avg: 31m per day · National avg: 29m per day |
Reporting period: October 1 – December 31, 2025 (Q4 2025). Source: CMS Payroll-Based Journal report.
Manages medical care and health needs.
Assists with medical care and medications.
Helps with daily care and mobility.
Total hours from contractors
609 contractor hours this quarter
| Certified Nursing Assistant | 38 | 1 | 39 | 8,367 | 92 | 100% | 7.6 |
| Registered Nurse | 5 | 2 | 7 | 1,447 | 87 | 95% | 10.9 |
| Other Dietary Services Staff | 3 | 0 | 3 | 1,089 | 88 | 96% | 6.8 |
| Licensed Practical Nurse | 3 | 0 | 3 | 1,058 | 81 | 88% | 9.1 |
| Nurse Aide in Training | 2 | 0 | 2 | 1,000 | 79 | 86% | 8.1 |
| Medication Aide/Technician | 3 | 0 | 3 | 980 | 78 | 85% | 12.2 |
| Nurse Practitioner | 1 | 0 | 1 | 684 | 71 | 77% | 9.6 |
| Administrator | 1 | 0 | 1 | 622 | 71 | 77% | 8.8 |
| Dental Services Staff | 1 | 0 | 1 | 431 | 57 | 62% | 7.6 |
| Clinical Nurse Specialist | 1 | 0 | 1 | 423 | 49 | 53% | 8.6 |
| Dietitian | 1 | 0 | 1 | 404 | 57 | 62% | 7.1 |
| Occupational Therapy Assistant | 0 | 1 | 1 | 33 | 8 | 9% | 4.1 |
| Occupational Therapy Aide | 0 | 1 | 1 | 9 | 3 | 3% | 2.8 |
| Medical Director | 0 | 1 | 1 | 6 | 18 | 20% | 0.4 |
Includes penalties issued in 2023
Federal penalties imposed by CMS for regulatory violations, including civil money penalties (fines) and denials of payment for new Medicare/Medicaid admissions.
Source: CMS Penalties Database (Data as of Jan 2026)
South Dakota average: $44K
South Dakota average: 2.0
South Dakota average: 0.4
Penalties are imposed by CMS for violations of federal nursing home regulations.
13 penalties in the past 3 years
Multiple penalties were reported in the last 3 years.
Last updated: Jan 2026
These measures show how residents usually do over time at this home, based on health outcomes and preventive care.
South Dakota average: 11.1
South Dakota average: 22.6
South Dakota average: 18.9%
South Dakota average: 23.8%
South Dakota average: 25.0%
South Dakota average: 3.7%
South Dakota average: 5.4%
South Dakota average: 2.7%
South Dakota average: 4.1%
South Dakota average: 4.4%
South Dakota average: 17.2%
South Dakota average: 97.3%
South Dakota average: 96.0%
South Dakota average: 88.9%
Quality measures are calculated from Minimum Data Set (MDS) assessments. For most measures, lower percentages indicate better care quality.
31% of new residents, usually for short-term rehab.
36% of new residents, often for short stays.
33% of new residents, often for long-term daily care.
Source: CMS Long-Term Care Facility Characteristics (Data as of Jan 2026)
Residents meet regularly to discuss policies, care quality, and activities
Family members meet regularly to discuss policies, care quality, and activities
Organized group of family members that meets regularly to discuss facility policies, resident care, and activities.
Organized group of residents that meets regularly to discuss facility policies, quality of life, and activities.
Data sourced from CMS Long-Term Care Facility Characteristics quarterly report. Payer mix reflects the current resident census by primary payment source.
Historical financial and operational data for Tuff Memorial Home from 2012–2023, based on CMS SNF Cost Reports.
Key figures below are for fiscal year ending in 09/2023.
Based on CMS SNF Cost Report for fiscal year ending in 09/2023.
This home supports both short-term rehab and long-term care, with residents staying for a wide range of durations.
New residents most often arrive under private pay (36% of admissions), and a typical private pay stay runs around 7 - 8 months.
Coverage residents most often arrive under.
Coverage residents most often leave under.
The information below is reported by the South Dakota Department of Health, Office of Health Care Facilities Licensure.
| Bethany Home Sioux Falls/Bethany Home-Brandon | NH AL IL MC SNF | Sioux Falls | 112
Facility
112
SD AVG
69
Rank
#11 / 117 | - | - | 5.47
Facility
5.47
SD AVG
4.34
Rank
#5 / 65 | -15% | +26% | $0
Facility
$0
SD AVG
$38.5k
Rank
#1 / 67 | 13
Facility
13
SD AVG
14.8
Rank
#27 / 65 | 3.3
Facility
3.3
SD AVG
3.3
Rank
#35 / 65 | 1 | 43 | - |
65
Facility
65
SD AVG
39
Rank
#24 / 158 | Augustana Lutheran Church | $5.9MFiscal year ending 06/2024
Facility
$5.9MFiscal year ending 06/2024
SD AVG
$6.7M
Rank
#41 / 63 | $4.1MFiscal year ending 06/2024
Facility
$4.1MFiscal year ending 06/2024
SD AVG
$2.6M
Rank
#23 / 63 | 68.6%Fiscal year ending 06/2024
Facility
68.6%Fiscal year ending 06/2024
SD AVG
40.8%
Rank
#12 / 63 | 435096 | ||||
| Tuff Memorial Home | NH SNF | Sioux Falls | 48
Facility
48
SD AVG
69
Rank
#76 / 117 |
79.8%
Facility
79.8%
SD AVG
82.2
Rank
#24 / 34 | +9% | 4.78 | -24% | 0% | $44.4k | 13 | 3.3 | - | 38 | - |
8
Facility
8
SD AVG
39
Rank
#138 / 158 | Alex Dysthe | $4.0MFiscal year ending 09/2023 | $2.7MFiscal year ending 09/2023 | 67.9%Fiscal year ending 09/2023 | 245548 | ||||
| Good Samaritan Society Sioux Falls Center | NH SNF | Sioux Falls | 98
Facility
98
SD AVG
69
Rank
#23 / 117 |
81.6%
Facility
81.6%
SD AVG
82.2
Rank
#23 / 34 | -1% | 3.93
Facility
3.93
SD AVG
4.34
Rank
#28 / 65 | +21% | -9% | $11.3k
Facility
$11.3k
SD AVG
$38.5k
Rank
#26 / 67 | 14
Facility
14
SD AVG
14.8
Rank
#29 / 65 | 4.7
Facility
4.7
SD AVG
3.3
Rank
#52 / 65 | 1 | 80 | - |
19
Facility
19
SD AVG
39
Rank
#113 / 158 | Luke Wanous | $8.1MFiscal year ending 09/2023
Facility
$8.1MFiscal year ending 09/2023
SD AVG
$6.7M
Rank
#16 / 63 | $4.5MFiscal year ending 09/2023
Facility
$4.5MFiscal year ending 09/2023
SD AVG
$2.6M
Rank
#11 / 63 | 56%Fiscal year ending 09/2023
Facility
56%Fiscal year ending 09/2023
SD AVG
40.8%
Rank
#18 / 63 | 435046 | ||||
| Avantara Norton | NH HOS SNF | Sioux Falls | 110
Facility
110
SD AVG
69
Rank
#12 / 117 |
90.0%
Facility
90.0%
SD AVG
82.2
Rank
#12 / 34 | +9% | 3.53
Facility
3.53
SD AVG
4.34
Rank
#41 / 65 | +53% | -19% | $153.6k
Facility
$153.6k
SD AVG
$38.5k
Rank
#63 / 67 | 75
Facility
75
SD AVG
14.8
Rank
#64 / 65 | 4.2
Facility
4.2
SD AVG
3.3
Rank
#47 / 65 | 18 | 99 | - |
61
Facility
61
SD AVG
39
Rank
#36 / 158 | Jeremy Klinkhammer | $10.3MFiscal year ending 12/2023
Facility
$10.3MFiscal year ending 12/2023
SD AVG
$6.7M
Rank
#9 / 63 | $4.4MFiscal year ending 12/2023
Facility
$4.4MFiscal year ending 12/2023
SD AVG
$2.6M
Rank
#9 / 63 | 42.4%Fiscal year ending 12/2023
Facility
42.4%Fiscal year ending 12/2023
SD AVG
40.8%
Rank
#37 / 63 | 435039 | ||||
| Good Samaritan Society Sioux Falls Village | NH AL IL MC | Sioux Falls | 177
Facility
177
SD AVG
69
Rank
#3 / 117 |
90.7%
Facility
90.7%
SD AVG
82.2
Rank
#10 / 34 | +10% | 4.02
Facility
4.02
SD AVG
4.34
Rank
#23 / 65 | +5% | -7% | $72.8k
Facility
$72.8k
SD AVG
$38.5k
Rank
#56 / 67 | 43
Facility
43
SD AVG
14.8
Rank
#63 / 65 | 6.1
Facility
6.1
SD AVG
3.3
Rank
#62 / 65 | 5 | 161 | - |
2
Facility
2
SD AVG
39
Rank
#147 / 158 | Dana Bachmeier | $19.5MFiscal year ending 09/2023
Facility
$19.5MFiscal year ending 09/2023
SD AVG
$6.7M
Rank
#1 / 63 | $10.5MFiscal year ending 09/2023
Facility
$10.5MFiscal year ending 09/2023
SD AVG
$2.6M
Rank
#4 / 63 | 54.1%Fiscal year ending 09/2023
Facility
54.1%Fiscal year ending 09/2023
SD AVG
40.8%
Rank
#29 / 63 | 435045 |
Tuff Memorial Home is located in Sioux Falls, South Dakota.
Here are the financial assistance programs available to residents in South Dakota.
Tuff Memorial Home has a walk score of 8. Car-dependent. Most errands require a car, with limited nearby walkable options.
Tuff Memorial Home's occupancy is 78.0%.
Tuff Memorial Home is registered as a non-profit.
Yes — there are 23 photos of Tuff Memorial Home in the photo gallery on this page.
(701) 780-6000 will put you in contact with the team at Tuff Memorial Home.
Yes — Tuff Memorial Home is a CMS-certified provider of Medicare and Medicaid.
Care Cost Calculator: See Prices in Your Area
Nursing Home Data Explorer
Don’t Wait Too Long: 7 Red Flag Signs Your Parent Needs Assisted Living Now
The True Cost of Assisted Living in 2025 – And How Families Are Paying For It
Understanding Senior Living Costs: Pricing Models, Discounts & Financial Assistance


