Blakehurst (Chestnut Green)
Nursing Home, Assisted Living, Independent Living & Memory Care · Towson, MD
CMS overall rating Info CMS (the Centers for Medicare & Medicaid Services) is the federal agency that rates nursing home quality. Its Overall Rating runs from 1 to 5 stars, combining health inspections, staffing, and quality measures, with inspections weighted most heavily.

Blakehurst (Chestnut Green)

Nursing Home, Assisted Living, Independent Living & Memory Care · Towson, MD
CMS overall rating Info CMS (the Centers for Medicare & Medicaid Services) is the federal agency that rates nursing home quality. Its Overall Rating runs from 1 to 5 stars, combining health inspections, staffing, and quality measures, with inspections weighted most heavily.
Calculator: See prices in your area
Blakehurst (Chestnut Green) accepts Medicare and private pay.

Overview of Blakehurst (chestnut Green)

Blakehurst is a senior living life plan community in Towson, MD. It offers a full continuum of care including independent living, assisted living, memory care, skilled nursing, and rehabilitation services. Residents enjoy first-in-class services and amenities designed to enrich their lives.

Quality ratings

Measured by Centers for Medicare & Medicaid Services (CMS)

Overall rating Info The Overall CMS Rating combines results from health inspections, staffing levels and quality measures. Health inspections carry the most weight. Staffing and quality scores can increase or decrease the final rating based on performance compared to state and national standards.
▲ 64.4% Above MD avg. ▲ 64.4% Above MD avg.MD average: 3.0Click the badge to see the full State ranking.Click here to see the full State ranking.
Health Inspection Info Based on the results of the facility's three most recent standard inspections and any complaint investigations. CMS reviews the number, scope, and severity of deficiencies, with more recent findings weighted more heavily.
▲ 42.0% Above MD avg. ▲ 42.0% Above MD avg.MD average: 2.8Click the badge to see the full State ranking.Click here to see the full State ranking.
Staffing Info Measures average nursing staff hours per resident per day, including Registered Nurses (RNs) and total nursing staff. Ratings are adjusted based on the level of care residents require and are compared to state and national benchmarks.
▲ 64.2% Above MD avg. ▲ 64.2% Above MD avg.MD average: 3.0Click the badge to see the full State ranking.Click here to see the full State ranking.
Quality Measures Info Based on clinical and physical health indicators reported to CMS, such as hospital readmissions, falls, pressure ulcers, and improvements in mobility. These measures reflect how well residents' health needs are being managed.
▼ 18.8% Below MD avg. ▼ 18.8% Below MD avg.MD average: 3.7Click the badge to see the full State ranking.Click here to see the full State ranking.

Staffing hours breakdown

Info Daily nursing hours per resident by staff type, reported to CMS. Higher is generally better — compare this facility to state and national averages to see where staffing stands.

Hours per resident per day — compared to Maryland state averages

Total nursing care / resident Info Total adjusted nursing hours per resident per day, combining RN, LPN, and aide time. CMS adjusts this for case-mix so facilities can be fairly compared.
5h 15m per day
This facility Maryland avg (3h 46m per day)
vs Maryland avg
+39%

1 of 6 metrics below state avg

Standout metric LPN / LVN is +45% above state avg
Staff typeHours / Day / Residentvs state avg
Registered Nurse (RN) Info RNs hold the highest nursing license and can assess residents, interpret test results, and direct care plans. More RN hours per day often signals stronger clinical oversight and faster response to health changes. 56m per day ▲ 15% State avg: 49m per day · National avg: 41m per day
LPN / LVN Info Licensed Practical Nurses (LPNs) or Licensed Vocational Nurses (LVNs) deliver routine hands-on care — medication administration, wound dressing, and monitoring vital signs. They work under RN supervision and make up a large share of daily bedside care. 1h 19m per day ▲ 45% State avg: 55m per day · National avg: 52m per day
Nurse Aide Info Certified Nurse Aides (CNAs) provide the most direct day-to-day assistance: bathing, dressing, feeding, and mobility. Nurse aide hours are typically the largest staffing category and directly affect residents' quality of life. 2h 18m per day ▲ 8% State avg: 2h 8m per day · National avg: 2h 20m per day
Weekend Total Nursing Info Combined nursing hours (RN + LPN + Nurse Aide) per resident per day on weekends. Staffing often drops on weekends — this figure reveals whether the facility maintains adequate coverage outside of weekday hours. 4h 15m per day ▲ 21% State avg: 3h 31m per day · National avg: 3h 27m per day
Physical Therapist Info Hours per resident per day provided by licensed Physical Therapists (PTs) or PT Assistants. PT services help residents recover mobility after injury or illness and are especially important for post-acute (short-stay) rehabilitation. 2m per day ▼ 73% State avg: 6m per day · National avg: 4m per day
Weekend RN Info Registered nurse hours specifically on weekends. Facilities sometimes reduce RN presence on Saturdays and Sundays — a low weekend RN figure compared to weekday hours can indicate reduced clinical oversight when most administrative staff are absent. 47m per day ▲ 29% State avg: 37m per day · National avg: 29m per day

Capacity and availability

Avg. Length of Stay
134 days
Bed community size
35-bed community Rank #246 / 697Bed count — State benchmarkedThis home is ranked 246th out of 697 homes in Maryland. Shows this facility's certified or reported bed count compared to other Maryland facilities. Larger communities may offer more amenities, programs, and on-site services for residents and families.Rankings are based only on facilities in Maryland that report data for that category. Facilities without available data are excluded from the ranking.Click the rank badge to see the full State ranking.Click here to see the full State ranking.
A moderately sized community that may balance personal attention with shared amenities and social activities.
Years in operation
32 years in operation Rank #33 / 208Years in operation — State benchmarkedThis home is ranked 33rd out of 208 homes in Maryland. Shows how long this facility has been in operation compared to other Maryland facilities. Longer operating histories may benefit residents, families, and staff.Rankings are based only on facilities in Maryland that report data for that category. Facilities without available data are excluded from the ranking.Click the rank badge to see the full State ranking.Click here to see the full State ranking.
A longer operating history, which may indicate experience navigating regulations and delivering ongoing care.
Walk Score
Walk Score: 10 / 100 Rank #837 / 985Walk Score — State benchmarkedThis home is ranked 837th out of 985 homes in Maryland. Shows how walkable this facility's neighborhood is compared to the average Walk Score across Maryland facilities. Higher scores benefit residents, families, and staff.Rankings are based only on facilities in Maryland that report data for that category. Facilities without available data are excluded from the ranking.Click the rank badge to see the full State ranking.Click here to see the full State ranking.
Car-dependent. Most errands require a car, with limited nearby walkable options.

About this community

Occupancy

Occupancy rate
88%
Higher than the Maryland average: 60%
Occupied beds
31 / 35
Average occupied beds in Maryland homes 104 beds

License Details

Facility TypeAl
IssuanceJuly 1, 1993
CountyBaltimore
CMS Certification Number215255

Ownership & Operating Entity

Owner NameLife Care Services Corporation
Profit StatusFor-profit
Nonprofit OwnershipNo

Room costs

Private Room $398 - $456 per day
Apartment $398 - $456 per day

Therapy & Rehabilitation

1 service
Rehabilitation Services

Memory & Specialized Care

1 service
Dedicated Alzheimer's Unit

Additional Policies & Features

Continuing Care Retirement Community (CCRC)

Amenities & Lifestyle

Specific ProgramsDining Options, Wellness Programs, Area Attractions, Renovations, Health Center, Cost Calculator, Life Care 101, LCS Signature Programs

Pricing & Financial Information

Starting Price$5,271 per month

Contact Blakehurst (Chestnut Green)

Health Inspection History

Inspections since 2019
Total health inspections 2

Maryland average 3.9


Last Health inspection on Jul 2024
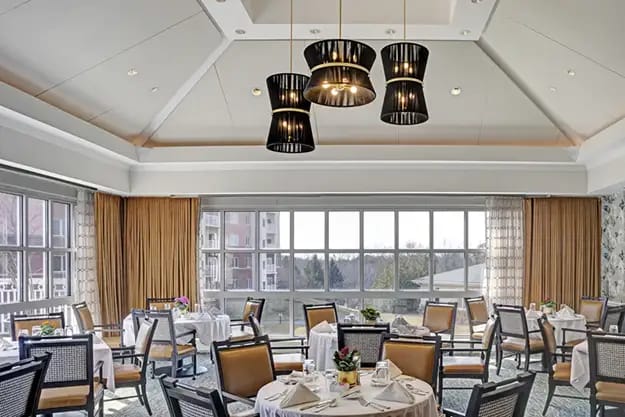
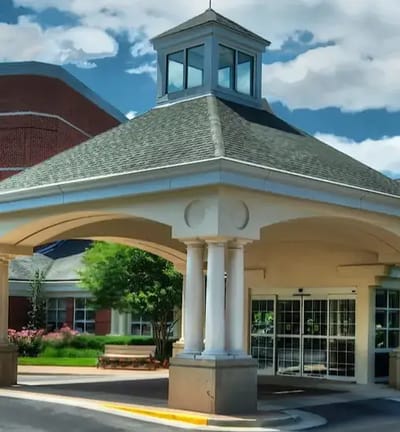
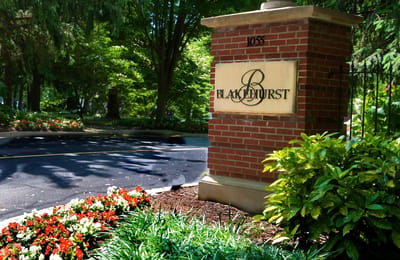
Total health citations
9 Rank #2 / 149Health citations — State benchmarkedThis home is ranked 2nd out of 149 homes in Maryland. Shows this facility's total health deficiency citations benchmarked to the Maryland State average, with a ranking across all 149 MD facilities. Lower citation counts earn a better rank.Rankings are based only on facilities in Maryland that report data for that category. Facilities without available data are excluded from the ranking.Click the rank badge to see the full State ranking.Click here to see the full State ranking.

Maryland average 49.9

Citations per inspection
4.5

Maryland average 12.81


Health citations are formal notices following inspections when they fail to comply with safety and care standards.

All 9 citations resulted from standard inspections.

Breakdown of citation severity (last 7 years)
Critical health citations
0
100% better than Maryland average

Maryland average: 0.5


Serious health citations
0
100% better than Maryland average

Maryland average: 0.6

0 critical citations Maryland average: 0.5

0 serious citations Maryland average: 0.6

9 moderate citations Maryland average: 47.2

0 minor citations Maryland average: 1.7
Citations history (last 7 years)
Nutrition moderate citation Jul 24, 2024
Corrected

Quality of Care moderate citation Jul 24, 2024
Corrected

Care Planning moderate citation Jul 24, 2024
Corrected

Care Planning moderate citation Jul 24, 2024
Corrected

Staffing Data

Reporting period: October 1 – December 31, 2025 (Q4 2025). Source: CMS Payroll-Based Journal report.

Total staff 91
Employees 77
Contractors 14
Staff to resident ratio 2.12 : 1
17% more staff per resident than Maryland average
Maryland average ratio: 1.81 : 1 Maryland average ratio: 1.81 : 1See full Maryland ranking
Avg staff/day 27
Average shift 7.6 hours
5% worse than Maryland average
Maryland average: 8 hours Maryland average shift: 8 hoursSee full Maryland ranking
Total staff hours (quarter) 18,837

Nursing staff breakdown

Q4 2025 · Oct 1 – Dec 31 More info This data comes from the CMS Payroll-Based Journal report covering October 1 – December 31, 2025.
Registered Nurse

Manages medical care and health needs.

RN Staff Info All 11 RN Staff are full-time employees. No contractors work on this role. 11
Average shift length Info Average shift length. Calculated as total hours divided by days worked and average staff per day. 8.3 hours
Licensed Practical Nurse

Assists with medical care and medications.

LPN Staff Info 20 total: 18 full-time employees and 2 contractors. 20
Average shift length Info Average shift length. Calculated as total hours divided by days worked and average staff per day. 9.5 hours
Certified Nursing Assistant

Helps with daily care and mobility.

CNA Staff Info All 34 CNA Staff are full-time employees. No contractors work on this role. 34
Average shift length Info Average shift length. Calculated as total hours divided by days worked and average staff per day. 7.5 hours

Contractor staffing

Q4 2025 · Oct 1 – Dec 31 More info This data comes from the CMS Payroll-Based Journal report covering October 1 – December 31, 2025.

Total hours from contractors

9.3%

1,759 contractor hours this quarter

Licensed Practical Nurse: 2 Speech Language Pathologist: 2 Respiratory Therapy Technician: 2 Physical Therapy Assistant: 2 Qualified Social Worker: 2 Occupational Therapy Aide: 1 Therapeutic Recreation Specialist: 1 Medical Director: 1 Occupational Therapy Assistant: 1

Staff by category

Q4 2025 · Oct 1 – Dec 31 More info This data comes from the CMS Payroll-Based Journal report covering October 1 – December 31, 2025.
Certified Nursing Assistant340347,89792100%7.5
Licensed Practical Nurse182204,50292100%9.5
Registered Nurse110111,9708693%8.3
Other Dietary Services Staff6061,1449098%6.8
Clinical Nurse Specialist4047598896%8.6
Administrator1015286672%8
Nurse Practitioner3034956065%8
Therapeutic Recreation Specialist0114306065%7.2
Physical Therapy Assistant0224066571%6.2
Speech Language Pathologist0222906571%3.2
Occupational Therapy Aide0112214145%5.4
Respiratory Therapy Technician022894347%2.1
Medical Director011611820%3.4
Qualified Social Worker022262224%1.2
Occupational Therapy Assistant0112067%3.3
34 Certified Nursing Assistant
% of Days 100%
20 Licensed Practical Nurse
% of Days 100%
11 Registered Nurse
% of Days 93%
6 Other Dietary Services Staff
% of Days 98%
4 Clinical Nurse Specialist
% of Days 96%
1 Administrator
% of Days 72%
3 Nurse Practitioner
% of Days 65%
1 Therapeutic Recreation Specialist
% of Days 65%
2 Physical Therapy Assistant
% of Days 71%
2 Speech Language Pathologist
% of Days 71%
1 Occupational Therapy Aide
% of Days 45%
2 Respiratory Therapy Technician
% of Days 47%
1 Medical Director
% of Days 20%
2 Qualified Social Worker
% of Days 24%
1 Occupational Therapy Assistant
% of Days 7%

Penalties and fines

Federal penalties imposed by CMS for regulatory violations, including civil money penalties (fines) and denials of payment for new Medicare/Medicaid admissions.

Source: CMS Penalties Database

No penalties in the past 3 years

No civil money penalties or payment denials were reported in the last 3 years.

Quality of care over time

These measures show how residents usually do over time at this home, based on health outcomes and preventive care.

High-risk clinical events score Info A composite score based on pressure ulcers, falls with injury, weight loss, walking ability decline, and activities of daily living decline. 9.5
27% better than Maryland average

Maryland average: 12.9

Functional decline score Info A composite score based on activities of daily living decline, walking ability decline, and incontinence. 23.1
10% better than Maryland average

Maryland average: 25.7

Long-stay resident measures
Need for Help with Daily Activities Increased Info Percent of long-stay residents whose need for help with daily activities has increased 23.3%
In line with Maryland average

Maryland average: 23.7%

Walking Ability Worsened Info Percent of long-stay residents whose ability to move independently worsened 19.4%
30% better than Maryland average

Maryland average: 27.7%

Low Risk Residents with Bowel/Bladder Incontinence Info Percent of low risk long-stay residents who lose control of their bowels or bladder 26.5%
In line with Maryland average

Maryland average: 25.9%

Falls with Major Injury Info Percent of long-stay residents experiencing one or more falls with major injury 0.7%
69% better than Maryland average

Maryland average: 2.3%

High Risk Residents with Pressure Ulcers Info Percent of long-stay high risk residents with pressure ulcers 2.9%
55% better than Maryland average

Maryland average: 6.5%

Urinary Tract Infection Info Percent of long-stay residents with a urinary tract infection 7.1%
346% worse than Maryland average

Maryland average: 1.6%

Lost Too Much Weight Info Percent of long-stay residents who lose too much weight 1.2%
79% better than Maryland average

Maryland average: 5.8%

Depressive Symptoms Info Percent of long-stay residents who have depressive symptoms 0.7%
96% better than Maryland average

Maryland average: 20.2%

Antipsychotic Use Info Percent of long-stay residents who received an antipsychotic medication 24.7%
91% worse than Maryland average

Maryland average: 12.9%

Pneumococcal Vaccine Info Percent of long-stay residents assessed and appropriately given the pneumococcal vaccine 94.4%
In line with Maryland average

Maryland average: 92.0%

Influenza Vaccine Info Percent of long-stay residents assessed and appropriately given the seasonal influenza vaccine 100.0%
In line with Maryland average

Maryland average: 96.6%

Short-stay resident measures
Pneumococcal Vaccine Info Percent of short-stay residents assessed and appropriately given the pneumococcal vaccine 90.3%
15% better than Maryland average

Maryland average: 78.4%

Antipsychotic medication increase Info Percent of short-stay residents who newly received an antipsychotic medication 2.2%
60% worse than Maryland average

Maryland average: 1.4%

Influenza Vaccine Info Percent of short-stay residents assessed and appropriately given the seasonal influenza vaccine 85.7%
6% better than Maryland average

Maryland average: 80.6%

Breakdown by payment type

Medicare

25% of new residents, usually for short-term rehab.

Typical stay 26 days

Private pay

75% of new residents, often for short stays.

Typical stay 4 - 5 months

Facility Characteristics

Source: CMS Long-Term Care Facility Characteristics (Data as of Jan 2026)

Total residents 43
Medicare
3
7% of residents
Private pay or other
40
93% of residents
Programs & Services
Residents Group

Residents meet regularly to discuss policies, care quality, and activities

CCRC

Part of a Continuing Care Retirement Community offering multiple care levels

Active Resident Council

Organized group of residents that meets regularly to discuss facility policies, quality of life, and activities.

Finances and operations

Based on CMS SNF Cost Report for fiscal year ending in 12/2023.

For-profit
Operated by a business corporation.
Net patient revenue Info Net patient revenue — what the home actually collects for resident care, after contractual allowances, bad debt and discounts are subtracted from its gross charges (CMS cost report, Worksheet G-3). It covers resident care only; money the home earns from other sources is shown separately as "Other income."
$4.7M
Net patient income Info Net patient income: net patient revenue minus the home's total operating expenses. A positive figure means it earns more from resident care than it spends to deliver it; a negative figure means the opposite. It excludes non-operating "other income."
-$23.3M
For-profit Operated by a business corporation.
Net patient revenue Info Net patient revenue — what the home actually collects for resident care, after contractual allowances, bad debt and discounts are subtracted from its gross charges (CMS cost report, Worksheet G-3). It covers resident care only; money the home earns from other sources is shown separately as "Other income."
$4.7M
Net patient income Info Net patient income: net patient revenue minus the home's total operating expenses. A positive figure means it earns more from resident care than it spends to deliver it; a negative figure means the opposite. It excludes non-operating "other income."
-$23.3M
Other income Info Money the home earns outside of resident care — such as investments, grants, rentals and other non-operating sources (CMS cost report, Worksheet G-3). It is tracked separately from net patient revenue: it is not part of that figure, and it is not included in net patient income.
$31.1M
Payroll costs Info Staff salaries plus wage-related costs — benefits such as payroll taxes, health insurance and retirement — from the home's own accounting records (CMS cost report, Worksheet A). Contract or agency labor is counted separately, under other operating costs.
$12.5M 262.4% of net patient revenue Info Payroll as a share of revenue: staff salaries and wage-related benefits divided by net patient revenue. A higher figure means more of each revenue dollar goes to staff pay. Rank #126 / 148Payroll % — State benchmarkedThis home is ranked 126th out of 148 homes in Maryland. Shows payroll as a percentage of revenue versus the Maryland average. Well-run Maryland facilities typically land around 49–57% — the top third Statewide. Below 25% may signal understaffing or heavy agency use — read with Staffing ratings.Rankings are based only on facilities in Maryland that report data for that category. Facilities without available data are excluded from the ranking.Click the rank badge to see the full State ranking.Click here to see the full State ranking.
Other operating costs Info Everything it costs to run the home apart from payroll — food, utilities, supplies, maintenance, contract labor and administration. Calculated as total operating expense minus payroll (staff salaries and wage-related benefits).
$15.6M
Total costs Info The home's total operating expense for the year — all the costs of running it, salaries included (CMS cost report, Worksheet G-3).
$28.1M

Who this home usually serves

TYPE OF STAY

Primarily short stays

Residents typically stay for brief periods, with frequent admissions and discharges throughout the year.

Most new residents arrive under private pay (75% of admissions), and a typical private pay stay runs around 4 - 5 months.

Admissions
224 total

Coverage residents most often arrive under.

Medicare 25%
Private pay 75%
Discharges
126 total

Coverage residents most often leave under.

Medicare 25%
Private pay 75%

Places of interest near Blakehurst (Chestnut Green)

Address 1.7 miles from city center Info Estimated distance in miles from Towson's city center to Blakehurst (Chestnut Green)'s address, calculated via Google Maps.

Calculate Travel Distance to Blakehurst (Chestnut Green)

Add your location

Address

Compare Nursing Homes around Towson

The information below is reported by the Maryland Department of Health, Office of Health Care Quality.

4 facilities compared · CMS & MD Dept. of Health data

Edenwald Senior Living
NH
AL
IL
MC
NC
Towson (Southerly Road)
94
Facility 94
MD AVG 43
Rank #148 / 697
72.3% -12%5.28 +5%+40%$0
9
Facility 9
MD AVG 49.9
Rank #2 / 149
4.5-35A+
83
Facility 83
MD AVG 43
Rank #70 / 985
Mark Beggs$29.9M$16.0M
53.6%
Facility 53.6%
MD AVG 38.5%
Rank #77 / 148
215372
Blakehurst (Chestnut Green)
NH
AL
IL
MC
Towson
35
Facility 35
MD AVG 43
Rank #246 / 697
88.1% +7%5.25 -12%+39%$0
9
Facility 9
MD AVG 49.9
Rank #2 / 149
4.5-37-
10
Facility 10
MD AVG 43
Rank #837 / 985
The Chestnut Real Estate Partnership$4.7M$12.5M
262.4%
Facility 262.4%
MD AVG 38.5%
Rank #126 / 148
215255
Complete Care at Multi-Medical Center
NH
HC
PC
RC
Towson
118
Facility 118
MD AVG 43
Rank #86 / 697
89.7% +9%3.11 -23%-18%$0
29
Facility 29
MD AVG 49.9
Rank #31 / 149
9.7-106-
59
Facility 59
MD AVG 43
Rank #327 / 985
Pc MD Opcos LLC$19.9M$7.4M
37.2%
Facility 37.2%
MD AVG 38.5%
Rank #90 / 148
215096
Orchard Hill Rehabilitation & Healthcare Center
NH
HC
MC
NC
PC
RC
Towson (West Road)
139
Facility 139
MD AVG 43
Rank #56 / 697
78.8% -4%3.17 +43%-16%$50.1k
104
Facility 104
MD AVG 49.9
Rank #141 / 149
20.81120-
75
Facility 75
MD AVG 43
Rank #131 / 985
Quinto Guardian LLC$15.8M$6.9M
43.9%
Facility 43.9%
MD AVG 38.5%
Rank #40 / 148
215069

Financial Assistance for
Nursing Home in Maryland

Blakehurst (Chestnut Green) is located in Towson, Maryland.
Here are the financial assistance programs available to residents in Maryland.

Get Financial aid guidance

Community Options Waiver

Maryland Medicaid Community Options Waiver

Age 65+ or disabled
General Maryland resident, Medicaid- eligible, nursing home-level care need.
Income Limits (2025) ~$2,829/month 300% FBR, individual
Asset Limits $2,000 (individual), $3,000 (couple) (excludes home, car).
MD

High urban demand; rural outreach efforts.

Benefits
Personal care (5-7 hours/day, e.g., bathing, dressing) Respite care (up to 240 hours/year) Adult day care ($70/day) Home modifications ($1,500 avg.)

Senior Care Program

Maryland Senior Care

Age 65+
General Maryland resident, at risk of nursing home placement.
Income Limits ~$2,000/month individual, varies by county
Asset Limits $11,000 individual
MD

Limited funding; waitlists common in high-demand areas.

Benefits
In-home care (3-5 hours/week) Respite care (up to 10 days/year) Meals (~$6/meal) Transportation (~5 trips/month) Case management

Maryland Nursing Home Medicaid

Maryland Medical Assistance (Medicaid) Nursing Home Program

Age 65+
General Maryland resident, Medicaid-eligible, requires nursing home-level care.
Income Limits (2025) $943/month (individual); most income applied to care costs.
Asset Limits $2,500 (individual), $3,000 (couple); spousal protections up to $155,356.
MD

Home equity limit $636,000; estate recovery applies post-55.

Benefits
24/7 nursing care Meals Therapy Medications (unlimited per medical need)

Senior Assisted Living Subsidy Program

Maryland Senior Assisted Living Group Home Subsidy

Age 62+
General Maryland resident, in or moving to approved assisted living, low/moderate income.
Income Limits (2025) ~$34,000/year individual, varies by county
Asset Limits Not strict; prioritizes low-income.
MD

Not available statewide; facility must be licensed by MDH.

Benefits
Personal care Meals 24-hour supervision (up to $1,500/month subsidy typical)

Veterans Aid and Attendance (A&A) Benefit

Maryland VA Aid and Attendance

Age
General Wartime veteran/spouse, age 65+ or disabled, needs ADL help, Maryland resident.
Income Limits (2025) Net income minus medical expenses < $1,984/month individual with A&A
Asset Limits $155,356 net worth limit
MD

High veteran population in suburban/rural areas.

Benefits
Cash benefit ($1,478-$2,471/month, varies by status) for care costs

Senior Prescription Drug Assistance Program (SPDAP)

Maryland Senior Prescription Drug Assistance Program

Age 65+
General Maryland resident (6+ months), Medicare Part D enrolled.
Income Limits (2025) $48,560/year individual, 300% FPL
Asset Limits None specified.
MD

Supplements Medicare Part D; annual enrollment required.

Benefits
Up to $40/month premium subsidy Reducing drug costs

Medicare Savings Programs (MSP)

Maryland Medicare Savings Programs

Age 65+
General Maryland resident, Medicare Part A/B enrollee.
Income Limits (2025) $2,014/month (QMB), $2,706/month (SLMB/QI, individual).
Asset Limits $9,090 (individual), $13,630 (couple).
MD

Includes QMB, SLMB, QI categories.

Benefits
Covers premiums (up to $174.70/month Part B) Co-pays Deductibles

Community Personal Assistance Services (CPAS)

Maryland Medicaid Community Personal Assistance Services

Age 65+
General Maryland resident, Medicaid-eligible, needs ADL assistance.
Income Limits (2025) $943/month (individual); spend-down available.
Asset Limits $2,500 (individual), $3,000 (couple).
MD

Consumer-directed option allows hiring family caregivers.

Benefits
Personal care (hours vary, typically 20-30/week) Chores Nurse supervision

Frequently Asked Questions about Blakehurst (Chestnut Green)

Who is the owner of Blakehurst (Chestnut Green)?

The legal owner and operator of Blakehurst (Chestnut Green) is Life Care Services Corporation.

Is Blakehurst (Chestnut Green) in a walkable area?

Blakehurst (Chestnut Green) has a walk score of 10. Car-dependent. Most errands require a car, with limited nearby walkable options.

What is the occupancy rate at Blakehurst (Chestnut Green)?

Blakehurst (Chestnut Green)'s occupancy is 88%.

Does Blakehurst (Chestnut Green) operate as a for-profit or non-profit?

Blakehurst (Chestnut Green) is registered as a for-profit in MD.

How many beds does Blakehurst (Chestnut Green) have?

Blakehurst (Chestnut Green) has 35 beds.

Are there photos of Blakehurst (Chestnut Green)?

Yes — there are 7 photos of Blakehurst (Chestnut Green) in the photo gallery on this page.

What is the address of Blakehurst (Chestnut Green)?

Blakehurst (Chestnut Green) is located at 1055 W. Joppa Road, Towson, MD 21204.

Guides for Better Senior Living

Care Cost Calculator: See Prices in Your Area

Nursing Home Data Explorer

Don’t Wait Too Long: 7 Red Flag Signs Your Parent Needs Assisted Living Now

The True Cost of Assisted Living in 2025 – And How Families Are Paying For It

Understanding Senior Living Costs: Pricing Models, Discounts & Financial Assistance