Complete Care at Multi-Medical Center
Nursing Home, Hospice Care, Palliative Care & Respite Care · Towson, MD
CMS overall rating Info CMS (the Centers for Medicare & Medicaid Services) is the federal agency that rates nursing home quality. Its Overall Rating runs from 1 to 5 stars, combining health inspections, staffing, and quality measures, with inspections weighted most heavily.

Complete Care at Multi-Medical Center

Nursing Home, Hospice Care, Palliative Care & Respite Care · Towson, MD
CMS overall rating Info CMS (the Centers for Medicare & Medicaid Services) is the federal agency that rates nursing home quality. Its Overall Rating runs from 1 to 5 stars, combining health inspections, staffing, and quality measures, with inspections weighted most heavily.
Calculator: See prices in your area
Complete Care at Multi-Medical Center accepts Medicare, Medicaid, and private pay.

Overview of Complete Care at Multi-Medical Center

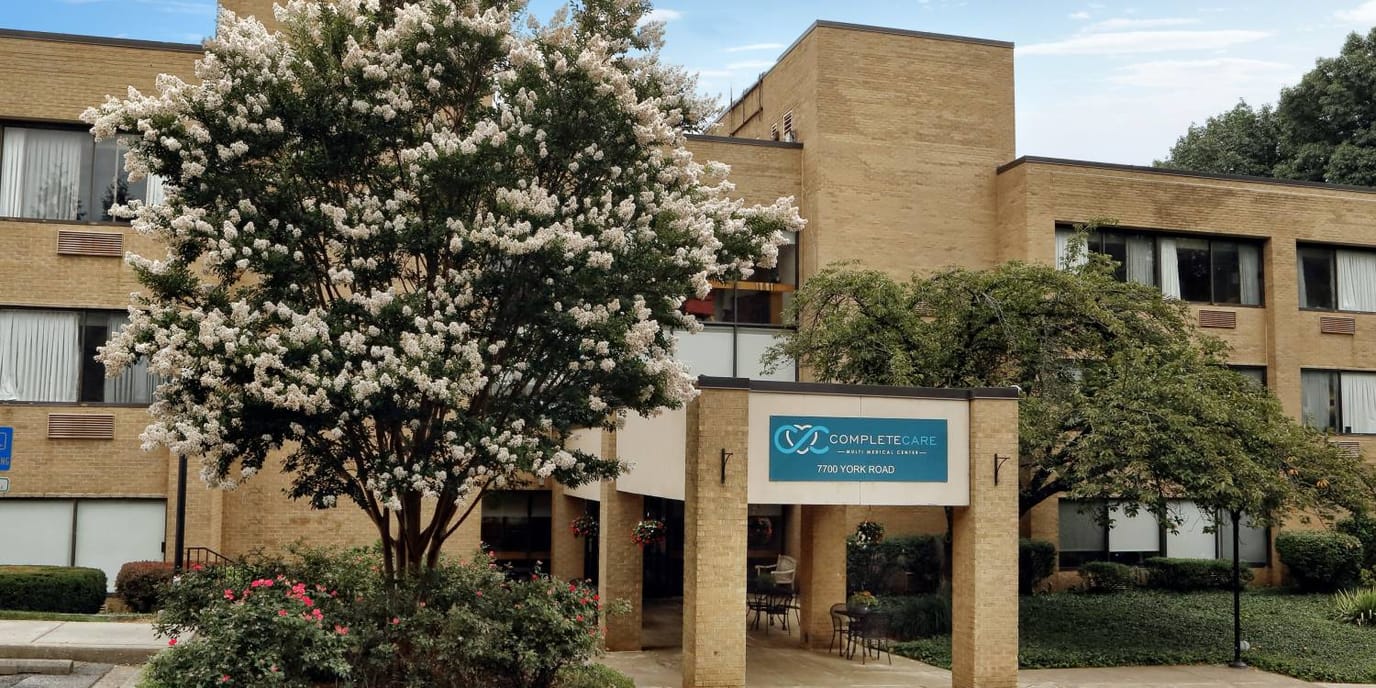
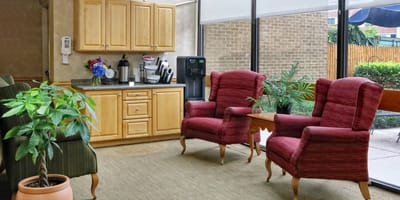
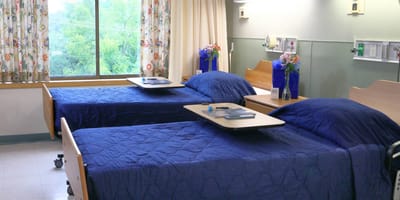
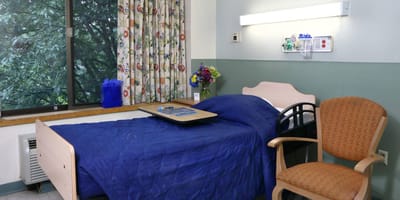
Complete Care at Multi-Medical Center is a nursing home in Towson, MD, offering long-term care, rehabilitation, and skilled nursing. Dedicated to older adults’ comfort and healing, the community continuously promotes a comfortable and supportive environment. With restaurant-style dining, housekeeping, and laundry, residents can regain their independence with ease. For residents’ holistic wellness, customized care plans are also provided based on their unique needs and preferences.

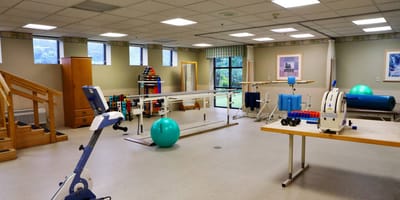
Live entertainment, exercises, and various activities encourage residents to make friends and gain meaningful experiences. Residents can also relax and focus on their recovery, with top-notch rehabilitation equipment and cozy lounges. University of Maryland St. Joseph Medical Center, schools, restaurants, and shops are available in the area, providing residents with quick access to their necessities and leisure. This nursing home is a trusted option for senior living in Maryland, especially with exceptional standards of care and a clean setting.

Quality ratings

Measured by Centers for Medicare & Medicaid Services (CMS)

Overall rating Info The Overall CMS Rating combines results from health inspections, staffing levels and quality measures. Health inspections carry the most weight. Staffing and quality scores can increase or decrease the final rating based on performance compared to state and national standards.
▲ 64.4% Above MD avg. ▲ 64.4% Above MD avg.MD average: 3.0Click the badge to see the full State ranking.Click here to see the full State ranking.
Health Inspection Info Based on the results of the facility's three most recent standard inspections and any complaint investigations. CMS reviews the number, scope, and severity of deficiencies, with more recent findings weighted more heavily.
▲ 42.0% Above MD avg. ▲ 42.0% Above MD avg.MD average: 2.8Click the badge to see the full State ranking.Click here to see the full State ranking.
Staffing Info Measures average nursing staff hours per resident per day, including Registered Nurses (RNs) and total nursing staff. Ratings are adjusted based on the level of care residents require and are compared to state and national benchmarks.
At MD avg. At MD avg.MD average: 3.0Click the badge to see the full State ranking.Click here to see the full State ranking.
Quality Measures Info Based on clinical and physical health indicators reported to CMS, such as hospital readmissions, falls, pressure ulcers, and improvements in mobility. These measures reflect how well residents' health needs are being managed.
▲ 35.3% Above MD avg. ▲ 35.3% Above MD avg.MD average: 3.7Click the badge to see the full State ranking.Click here to see the full State ranking.

Staffing hours breakdown

Info Daily nursing hours per resident by staff type, reported to CMS. Higher is generally better — compare this facility to state and national averages to see where staffing stands.

Hours per resident per day — compared to Maryland state averages

Total nursing care / resident Info Total adjusted nursing hours per resident per day, combining RN, LPN, and aide time. CMS adjusts this for case-mix so facilities can be fairly compared.
3h 7m per day
This facility Maryland avg (3h 46m per day)
vs Maryland avg
-18%

2 of 6 metrics below state avg

Standout metric LPN / LVN is +32% above state avg
Staff typeHours / Day / Residentvs state avg
Registered Nurse (RN) Info RNs hold the highest nursing license and can assess residents, interpret test results, and direct care plans. More RN hours per day often signals stronger clinical oversight and faster response to health changes. 51m per day ▲ 3% State avg: 49m per day · National avg: 41m per day
LPN / LVN Info Licensed Practical Nurses (LPNs) or Licensed Vocational Nurses (LVNs) deliver routine hands-on care — medication administration, wound dressing, and monitoring vital signs. They work under RN supervision and make up a large share of daily bedside care. 1h 12m per day ▲ 32% State avg: 55m per day · National avg: 52m per day
Nurse Aide Info Certified Nurse Aides (CNAs) provide the most direct day-to-day assistance: bathing, dressing, feeding, and mobility. Nurse aide hours are typically the largest staffing category and directly affect residents' quality of life. 1h 59m per day ▼ 7% State avg: 2h 8m per day · National avg: 2h 20m per day
Weekend Total Nursing Info Combined nursing hours (RN + LPN + Nurse Aide) per resident per day on weekends. Staffing often drops on weekends — this figure reveals whether the facility maintains adequate coverage outside of weekday hours. 3h 39m per day ▲ 4% State avg: 3h 31m per day · National avg: 3h 27m per day
Physical Therapist Info Hours per resident per day provided by licensed Physical Therapists (PTs) or PT Assistants. PT services help residents recover mobility after injury or illness and are especially important for post-acute (short-stay) rehabilitation. 3m per day ▼ 47% State avg: 6m per day · National avg: 4m per day
Weekend RN Info Registered nurse hours specifically on weekends. Facilities sometimes reduce RN presence on Saturdays and Sundays — a low weekend RN figure compared to weekday hours can indicate reduced clinical oversight when most administrative staff are absent. 41m per day ▲ 12% State avg: 37m per day · National avg: 29m per day

Capacity and availability

This home usually has limited availability

Higher occupancy than the Maryland average: 82.4%
Occupancy rate
89.7%
Avg. Length of Stay
69 days
Bed community size
118-bed community Rank #86 / 697Bed count — State benchmarkedThis home is ranked 86th out of 697 homes in Maryland. Shows this facility's certified or reported bed count compared to other Maryland facilities. Larger communities may offer more amenities, programs, and on-site services for residents and families.Rankings are based only on facilities in Maryland that report data for that category. Facilities without available data are excluded from the ranking.Click the rank badge to see the full State ranking.Click here to see the full State ranking.
A larger shared setting that may offer more common spaces and organized community services.
Walk Score
Walk Score: 59 / 100 Rank #327 / 985Walk Score — State benchmarkedThis home is ranked 327th out of 985 homes in Maryland. Shows how walkable this facility's neighborhood is compared to the average Walk Score across Maryland facilities. Higher scores benefit residents, families, and staff.Rankings are based only on facilities in Maryland that report data for that category. Facilities without available data are excluded from the ranking.Click the rank badge to see the full State ranking.Click here to see the full State ranking.
Moderately walkable. Some errands can be accomplished on foot, with a mix of nearby amenities.

Safety & Compliance

Hoyer Lift

Therapy & Rehabilitation

2 services
Rehabilitation Services
Respite Care

Staffing & Medical

1 service
24-Hour Staffing

Additional Policies & Features

Visitor PolicyFlexible visitation hours.

Amenities & Lifestyle

Gym
Barber
Restaurant
Courtyard
Concierge
Housekeeping
Laundry
Dining Services
Activities
Wellness Programtherapy gym, beauty/barber services
Branded ProgramsPathForward by Complete Care
Specific ProgramsVolunteer, Complete Care at Multi Medical Center, What to Expect

Dining & Nutrition

Food DescriptionThe dining program features restaurant-style, dietician-approved meals, with options for residents to eat in a communal dining room or in the privacy of their rooms.

Contact Complete Care at Multi-Medical Center

Staffing Data

Reporting period: October 1 – December 31, 2025 (Q4 2025). Source: CMS Payroll-Based Journal report.

Total staff 216
Employees 165
Contractors 51
Staff to resident ratio 1.95 : 1
7% more staff per resident than Maryland average
Maryland average ratio: 1.81 : 1 Maryland average ratio: 1.81 : 1See full Maryland ranking
Avg staff/day 64
Average shift 7.9 hours
0% compared with Maryland average
Maryland average: 8 hours Maryland average shift: 8 hoursSee full Maryland ranking
Total staff hours (quarter) 46,642

Nursing staff breakdown

Q4 2025 · Oct 1 – Dec 31 More info This data comes from the CMS Payroll-Based Journal report covering October 1 – December 31, 2025.
Registered Nurse

Manages medical care and health needs.

RN Staff Info 23 total: 21 full-time employees and 2 contractors. 23
Average shift length Info Average shift length. Calculated as total hours divided by days worked and average staff per day. 8.6 hours
Licensed Practical Nurse

Assists with medical care and medications.

LPN Staff Info 28 total: 23 full-time employees and 5 contractors. 28
Average shift length Info Average shift length. Calculated as total hours divided by days worked and average staff per day. 9.2 hours
Certified Nursing Assistant

Helps with daily care and mobility.

CNA Staff Info 102 total: 78 full-time employees and 24 contractors. 102
Average shift length Info Average shift length. Calculated as total hours divided by days worked and average staff per day. 7.1 hours

Contractor staffing

Q4 2025 · Oct 1 – Dec 31 More info This data comes from the CMS Payroll-Based Journal report covering October 1 – December 31, 2025.

Total hours from contractors

11.8%

5,501 contractor hours this quarter

Certified Nursing Assistant: 24 Licensed Practical Nurse: 5 Speech Language Pathologist: 4 Physical Therapy Assistant: 4 Qualified Social Worker: 4 Physical Therapy Aide: 4 Respiratory Therapy Technician: 3 Registered Nurse: 2 Clinical Nurse Specialist: 1

Staff by category

Q4 2025 · Oct 1 – Dec 31 More info This data comes from the CMS Payroll-Based Journal report covering October 1 – December 31, 2025.
Certified Nursing Assistant782410218,69492100%7.1
Licensed Practical Nurse235289,82692100%9.2
Registered Nurse212235,02892100%8.6
Clinical Nurse Specialist191202,8276975%7.9
RN Director of Nursing8081,9169098%8.8
Speech Language Pathologist0441,3436874%7.9
Physical Therapy Aide0441,0536571%7.5
Qualified Social Worker0449716975%7.8
Medication Aide/Technician2027977177%11.2
Dental Services Staff3037836470%7.3
Other Dietary Services Staff3036326773%8
Physical Therapy Assistant0445567582%7.4
Mental Health Service Worker2025386267%8
Respiratory Therapy Technician0335026672%7.4
Administrator1014886166%8
Nurse Practitioner1014405560%8
Other Social Services Staff202127910%8.4
Dietitian2021231112%7.2
102 Certified Nursing Assistant
% of Days 100%
28 Licensed Practical Nurse
% of Days 100%
23 Registered Nurse
% of Days 100%
20 Clinical Nurse Specialist
% of Days 75%
8 RN Director of Nursing
% of Days 98%
4 Speech Language Pathologist
% of Days 74%
4 Physical Therapy Aide
% of Days 71%
4 Qualified Social Worker
% of Days 75%
2 Medication Aide/Technician
% of Days 77%
3 Dental Services Staff
% of Days 70%
3 Other Dietary Services Staff
% of Days 73%
4 Physical Therapy Assistant
% of Days 82%
2 Mental Health Service Worker
% of Days 67%
3 Respiratory Therapy Technician
% of Days 72%
1 Administrator
% of Days 66%
1 Nurse Practitioner
% of Days 60%
2 Other Social Services Staff
% of Days 10%
2 Dietitian
% of Days 12%

Penalties and fines

Federal penalties imposed by CMS for regulatory violations, including civil money penalties (fines) and denials of payment for new Medicare/Medicaid admissions.

Source: CMS Penalties Database

No penalties in the past 3 years

No civil money penalties or payment denials were reported in the last 3 years.

Quality of care over time

These measures show how residents usually do over time at this home, based on health outcomes and preventive care.

High-risk clinical events score Info A composite score based on pressure ulcers, falls with injury, weight loss, walking ability decline, and activities of daily living decline. 10.9
16% better than Maryland average

Maryland average: 12.9

Functional decline score Info A composite score based on activities of daily living decline, walking ability decline, and incontinence. 17.3
33% better than Maryland average

Maryland average: 25.7

Long-stay resident measures
Need for Help with Daily Activities Increased Info Percent of long-stay residents whose need for help with daily activities has increased 13.7%
42% better than Maryland average

Maryland average: 23.7%

Walking Ability Worsened Info Percent of long-stay residents whose ability to move independently worsened 15.9%
43% better than Maryland average

Maryland average: 27.7%

Low Risk Residents with Bowel/Bladder Incontinence Info Percent of low risk long-stay residents who lose control of their bowels or bladder 22.2%
14% better than Maryland average

Maryland average: 25.9%

Falls with Major Injury Info Percent of long-stay residents experiencing one or more falls with major injury 3.7%
61% worse than Maryland average

Maryland average: 2.3%

High Risk Residents with Pressure Ulcers Info Percent of long-stay high risk residents with pressure ulcers 11.8%
81% worse than Maryland average

Maryland average: 6.5%

Urinary Tract Infection Info Percent of long-stay residents with a urinary tract infection 0.8%
53% better than Maryland average

Maryland average: 1.6%

Lost Too Much Weight Info Percent of long-stay residents who lose too much weight 9.4%
62% worse than Maryland average

Maryland average: 5.8%

Depressive Symptoms Info Percent of long-stay residents who have depressive symptoms 58.4%
189% worse than Maryland average

Maryland average: 20.2%

Antipsychotic Use Info Percent of long-stay residents who received an antipsychotic medication 6.7%
48% better than Maryland average

Maryland average: 12.9%

Pneumococcal Vaccine Info Percent of long-stay residents assessed and appropriately given the pneumococcal vaccine 99.3%
8% better than Maryland average

Maryland average: 92.0%

Influenza Vaccine Info Percent of long-stay residents assessed and appropriately given the seasonal influenza vaccine 98.7%
In line with Maryland average

Maryland average: 96.6%

Short-stay resident measures
Pneumococcal Vaccine Info Percent of short-stay residents assessed and appropriately given the pneumococcal vaccine 74.1%
6% worse than Maryland average

Maryland average: 78.4%

Antipsychotic medication increase Info Percent of short-stay residents who newly received an antipsychotic medication 1.1%
19% better than Maryland average

Maryland average: 1.4%

Influenza Vaccine Info Percent of short-stay residents assessed and appropriately given the seasonal influenza vaccine 87.6%
9% better than Maryland average

Maryland average: 80.6%

Breakdown by payment type

Medicare

74% of new residents, usually for short-term rehab.

Typical stay 1 months

Private pay

15% of new residents, often for short stays.

Typical stay 1 - 2 months

Medicaid

11% of new residents, often for long-term daily care.

Typical stay 11 - 12 months

Facility Characteristics

Source: CMS Long-Term Care Facility Characteristics (Data as of Jan 2026)

Total residents 111
Medicare
43
38.7% of residents
Medicaid
58
52.3% of residents
Private pay or other
10
9% of residents
Programs & Services
Residents Group

Residents meet regularly to discuss policies, care quality, and activities

Active Resident Council

Organized group of residents that meets regularly to discuss facility policies, quality of life, and activities.

Finances and operations

Based on CMS SNF Cost Report for fiscal year ending in 12/2023.

For-profit
Operated by a single business entity.
Net patient revenue Info Net patient revenue — what the home actually collects for resident care, after contractual allowances, bad debt and discounts are subtracted from its gross charges (CMS cost report, Worksheet G-3). It covers resident care only; money the home earns from other sources is shown separately as "Other income."
$19.9M
Net patient income Info Net patient income: net patient revenue minus the home's total operating expenses. A positive figure means it earns more from resident care than it spends to deliver it; a negative figure means the opposite. It excludes non-operating "other income."
$37.3K
For-profit Operated by a single business entity.
Net patient revenue Info Net patient revenue — what the home actually collects for resident care, after contractual allowances, bad debt and discounts are subtracted from its gross charges (CMS cost report, Worksheet G-3). It covers resident care only; money the home earns from other sources is shown separately as "Other income."
$19.9M
Net patient income Info Net patient income: net patient revenue minus the home's total operating expenses. A positive figure means it earns more from resident care than it spends to deliver it; a negative figure means the opposite. It excludes non-operating "other income."
$37.3K
Other income Info Money the home earns outside of resident care — such as investments, grants, rentals and other non-operating sources (CMS cost report, Worksheet G-3). It is tracked separately from net patient revenue: it is not part of that figure, and it is not included in net patient income.
$191.4K
Payroll costs Info Staff salaries plus wage-related costs — benefits such as payroll taxes, health insurance and retirement — from the home's own accounting records (CMS cost report, Worksheet A). Contract or agency labor is counted separately, under other operating costs.
$7.4M 37.2% of net patient revenue Info Payroll as a share of revenue: staff salaries and wage-related benefits divided by net patient revenue. A higher figure means more of each revenue dollar goes to staff pay. Rank #90 / 148Payroll % — State benchmarkedThis home is ranked 90th out of 148 homes in Maryland. Shows payroll as a percentage of revenue versus the Maryland average. Well-run Maryland facilities typically land around 49–57% — the top third Statewide. Below 25% may signal understaffing or heavy agency use — read with Staffing ratings.Rankings are based only on facilities in Maryland that report data for that category. Facilities without available data are excluded from the ranking.Click the rank badge to see the full State ranking.Click here to see the full State ranking.
Other operating costs Info Everything it costs to run the home apart from payroll — food, utilities, supplies, maintenance, contract labor and administration. Calculated as total operating expense minus payroll (staff salaries and wage-related benefits).
$12.5M
Total costs Info The home's total operating expense for the year — all the costs of running it, salaries included (CMS cost report, Worksheet G-3).
$19.9M

What does this home offer?

Building type icon
Building type icon

Building Type: 3-story

On-site medical care and health services icon

On-site Medical Care and Health Services

Rehabilitative support icon

Rehabilitative Support

Housekeeping icon
Housekeeping icon

Housekeeping Services

Social and recreational activities icon

Social and Recreational Activities

Who this home usually serves

TYPE OF STAY

Mostly short-term rehab stays

Most residents typically stay for a few weeks or months before returning home or moving on.

Most new residents arrive under Medicare (74% of admissions), and a typical Medicare stay runs around 1 months.

Admissions
562 total

Coverage residents most often arrive under.

Medicare 74%
Private pay 15%
Medicaid 11%
Discharges
558 total

Coverage residents most often leave under.

Medicare 63%
Private pay 19%
Medicaid 18%

Places of interest near Complete Care at Multi-Medical Center

Address 0.9 miles from city center Info Estimated distance in miles from Towson's city center to Complete Care at Multi-Medical Center's address, calculated via Google Maps.

Calculate Travel Distance to Complete Care at Multi-Medical Center

Add your location

Address

Compare Nursing Homes around Towson

The information below is reported by the Maryland Department of Health, Office of Health Care Quality.

4 facilities compared · CMS & MD Dept. of Health data

Edenwald Senior Living
NH
AL
IL
MC
NC
Towson (Southerly Road)
94
Facility 94
MD AVG 43
Rank #148 / 697
72.3% -12%5.28 +5%+40%$0
9
Facility 9
MD AVG 49.9
Rank #2 / 149
4.5-35A+
83
Facility 83
MD AVG 43
Rank #70 / 985
Mark Beggs$29.9M$16.0M
53.6%
Facility 53.6%
MD AVG 38.5%
Rank #77 / 148
215372
Blakehurst (Chestnut Green)
NH
AL
IL
MC
Towson
35
Facility 35
MD AVG 43
Rank #246 / 697
88.1% +7%5.25 -12%+39%$0
9
Facility 9
MD AVG 49.9
Rank #2 / 149
4.5-37-
10
Facility 10
MD AVG 43
Rank #837 / 985
The Chestnut Real Estate Partnership$4.7M$12.5M
262.4%
Facility 262.4%
MD AVG 38.5%
Rank #126 / 148
215255
Complete Care at Multi-Medical Center
NH
HC
PC
RC
Towson
118
Facility 118
MD AVG 43
Rank #86 / 697
89.7% +9%3.11 -23%-18%$0
29
Facility 29
MD AVG 49.9
Rank #31 / 149
9.7-106-
59
Facility 59
MD AVG 43
Rank #327 / 985
Pc MD Opcos LLC$19.9M$7.4M
37.2%
Facility 37.2%
MD AVG 38.5%
Rank #90 / 148
215096
Orchard Hill Rehabilitation & Healthcare Center
NH
HC
MC
NC
PC
RC
Towson (West Road)
139
Facility 139
MD AVG 43
Rank #56 / 697
78.8% -4%3.17 +43%-16%$50.1k
104
Facility 104
MD AVG 49.9
Rank #141 / 149
20.81120-
75
Facility 75
MD AVG 43
Rank #131 / 985
Quinto Guardian LLC$15.8M$6.9M
43.9%
Facility 43.9%
MD AVG 38.5%
Rank #40 / 148
215069

Financial Assistance for
Nursing Home in Maryland

Complete Care at Multi-Medical Center is located in Towson, Maryland.
Here are the financial assistance programs available to residents in Maryland.

Get Financial aid guidance

Community Options Waiver

Maryland Medicaid Community Options Waiver

Age 65+ or disabled
General Maryland resident, Medicaid- eligible, nursing home-level care need.
Income Limits (2025) ~$2,829/month 300% FBR, individual
Asset Limits $2,000 (individual), $3,000 (couple) (excludes home, car).
MD

High urban demand; rural outreach efforts.

Benefits
Personal care (5-7 hours/day, e.g., bathing, dressing) Respite care (up to 240 hours/year) Adult day care ($70/day) Home modifications ($1,500 avg.)

Senior Care Program

Maryland Senior Care

Age 65+
General Maryland resident, at risk of nursing home placement.
Income Limits ~$2,000/month individual, varies by county
Asset Limits $11,000 individual
MD

Limited funding; waitlists common in high-demand areas.

Benefits
In-home care (3-5 hours/week) Respite care (up to 10 days/year) Meals (~$6/meal) Transportation (~5 trips/month) Case management

Maryland Nursing Home Medicaid

Maryland Medical Assistance (Medicaid) Nursing Home Program

Age 65+
General Maryland resident, Medicaid-eligible, requires nursing home-level care.
Income Limits (2025) $943/month (individual); most income applied to care costs.
Asset Limits $2,500 (individual), $3,000 (couple); spousal protections up to $155,356.
MD

Home equity limit $636,000; estate recovery applies post-55.

Benefits
24/7 nursing care Meals Therapy Medications (unlimited per medical need)

Senior Assisted Living Subsidy Program

Maryland Senior Assisted Living Group Home Subsidy

Age 62+
General Maryland resident, in or moving to approved assisted living, low/moderate income.
Income Limits (2025) ~$34,000/year individual, varies by county
Asset Limits Not strict; prioritizes low-income.
MD

Not available statewide; facility must be licensed by MDH.

Benefits
Personal care Meals 24-hour supervision (up to $1,500/month subsidy typical)

Veterans Aid and Attendance (A&A) Benefit

Maryland VA Aid and Attendance

Age
General Wartime veteran/spouse, age 65+ or disabled, needs ADL help, Maryland resident.
Income Limits (2025) Net income minus medical expenses < $1,984/month individual with A&A
Asset Limits $155,356 net worth limit
MD

High veteran population in suburban/rural areas.

Benefits
Cash benefit ($1,478-$2,471/month, varies by status) for care costs

Senior Prescription Drug Assistance Program (SPDAP)

Maryland Senior Prescription Drug Assistance Program

Age 65+
General Maryland resident (6+ months), Medicare Part D enrolled.
Income Limits (2025) $48,560/year individual, 300% FPL
Asset Limits None specified.
MD

Supplements Medicare Part D; annual enrollment required.

Benefits
Up to $40/month premium subsidy Reducing drug costs

Medicare Savings Programs (MSP)

Maryland Medicare Savings Programs

Age 65+
General Maryland resident, Medicare Part A/B enrollee.
Income Limits (2025) $2,014/month (QMB), $2,706/month (SLMB/QI, individual).
Asset Limits $9,090 (individual), $13,630 (couple).
MD

Includes QMB, SLMB, QI categories.

Benefits
Covers premiums (up to $174.70/month Part B) Co-pays Deductibles

Community Personal Assistance Services (CPAS)

Maryland Medicaid Community Personal Assistance Services

Age 65+
General Maryland resident, Medicaid-eligible, needs ADL assistance.
Income Limits (2025) $943/month (individual); spend-down available.
Asset Limits $2,500 (individual), $3,000 (couple).
MD

Consumer-directed option allows hiring family caregivers.

Benefits
Personal care (hours vary, typically 20-30/week) Chores Nurse supervision

Frequently Asked Questions about Complete Care at Multi-Medical Center

Is Complete Care at Multi-Medical Center in a walkable area?

Complete Care at Multi-Medical Center has a walk score of 59. Moderately walkable. Some errands can be accomplished on foot, with a mix of nearby amenities.

What is the occupancy rate at Complete Care at Multi-Medical Center?

Complete Care at Multi-Medical Center's occupancy is 89.7%.

What is the best email address for Complete Care at Multi-Medical Center?

The team at Complete Care at Multi-Medical Center can be reached at [email protected].

Does Complete Care at Multi-Medical Center operate as a for-profit or non-profit?

Complete Care at Multi-Medical Center is registered as a for-profit.

Are there photos of Complete Care at Multi-Medical Center?

Yes — there are 6 photos of Complete Care at Multi-Medical Center in the photo gallery on this page.

What is the address of Complete Care at Multi-Medical Center?

Complete Care at Multi-Medical Center is located at 7700 York Rd, Towson, MD 21204.

What is the phone number of Complete Care at Multi-Medical Center?

(410) 821-5500 will put you in contact with the team at Complete Care at Multi-Medical Center.

Guides for Better Senior Living

Care Cost Calculator: See Prices in Your Area

Nursing Home Data Explorer

Don’t Wait Too Long: 7 Red Flag Signs Your Parent Needs Assisted Living Now

The True Cost of Assisted Living in 2025 – And How Families Are Paying For It

Understanding Senior Living Costs: Pricing Models, Discounts & Financial Assistance