Bloomington Rehabilitation and Health Care
Nursing Home, Assisted Living, Independent Living & Memory Care · Bloomington, IL

Bloomington Rehabilitation and Health Care

Nursing Home, Assisted Living, Independent Living & Memory Care · Bloomington, IL
Calculator: See prices in your area
Bloomington Rehabilitation and Health Care accepts Medicare, Medicaid, and private pay.

Overview of Bloomington Rehabilitation and Health Care

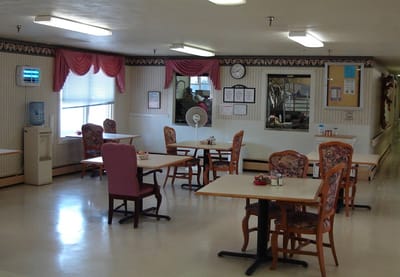
Based in the neighborhood of Bloomington, IL, Bloomington Rehabilitation and Health Care is a reliable senior care provider that offers memory care, skilled nursing care, and rehabilitation services. The community is purposely built to accommodate residents who need more extensive care services to maintain their well-being or regain their strength, mobility, and overall functionality. Dedicated to providing the highest quality of care for life’s many stages, the community features a team of excellent care professionals trained to offer various levels of care.

Apart from its round-the-clock services, the community offers a wide range of activities to keep residents’ entertained and stimulated. Residents’ nourishment is prioritized with tasty and nutritious meals served daily. Additional services like 24-hour laboratory, radiology and pharmacy services are also available to make sure residents have access to them should they need the said services.

(309) 829-4348

Capacity and availability

This home usually has availability

Lower occupancy than the Illinois average: 69.3%
Occupancy rate
61.6% Rank #152 / 204Occupancy rate — State benchmarkedThis home is ranked 152nd out of 204 homes in Illinois. Shows this facility's occupancy rate versus the Illinois average, with its Statewide rank out of 204. Higher occupancy signals strong local demand and financial stability.Ranking totals vary by category as each rank only includes facilities that report data for that metric. Homes missing that data point aren't included in the ranking.Click the rank badge to see the full State ranking.Click here to see the full State ranking.
Avg. Length of Stay
74 days
Bed community size
78-bed community Rank #188 / 426Bed count — State benchmarkedThis home is ranked 188th out of 426 homes in Illinois. Shows this facility's certified or reported bed count compared to other Illinois facilities. Larger communities may offer more amenities, programs, and on-site services for residents and families.Ranking totals vary by category as each rank only includes facilities that report data for that metric. Homes missing that data point aren't included in the ranking.Click the rank badge to see the full State ranking.Click here to see the full State ranking.
A larger shared setting that may offer more common spaces and organized community services.
Walk Score
Walk Score: 59 / 100 Rank #247 / 648Walk Score — State benchmarkedThis home is ranked 247th out of 648 homes in Illinois. Shows how walkable this facility's neighborhood is compared to the average Walk Score across Illinois facilities. Higher scores benefit residents, families, and staff.Ranking totals vary by category as each rank only includes facilities that report data for that metric. Homes missing that data point aren't included in the ranking.Click the rank badge to see the full State ranking.Click here to see the full State ranking.
Moderately walkable. Some errands can be accomplished on foot, with a mix of nearby amenities.

About this community

Therapy & Rehabilitation

1 service
Rehabilitation Services

Amenities & Lifestyle

Specific ProgramsInpatient Rehabilitation, Outpatient Services, Transitional Outcomes Program

Contact Bloomington Rehabilitation and Health Care

Staffing Data

Reporting period: April 1 – June 30, 2025 (Q2 2025). Source: CMS Payroll-Based Journal report.

Total staff 2
Employees 1
Contractors 1
Staff to resident ratio 0.05 : 1
97% fewer staff per resident than Illinois average
Illinois average ratio: 1.80 : 1 Illinois average ratio: 1.80 : 1See full Illinois ranking
Avg staff/day 1
Average shift 8 hours
5% better than Illinois average
Illinois average: 7.6 hours Illinois average shift: 7.6 hoursSee full Illinois ranking
Total staff hours (quarter) 520

Nursing staff breakdown

Q2 2025 · Apr 1 – Jun 30 More info This data comes from the CMS Payroll-Based Journal report covering April 1 – June 30, 2025.
Registered Nurse

Manages medical care and health needs.

RN Staff Info No RN Staff reported this quarter. 0
Average shift length Info Average shift length. Calculated as total hours divided by days worked and average staff per day.
Licensed Practical Nurse

Assists with medical care and medications.

LPN Staff Info No LPN Staff reported this quarter. 0
Average shift length Info Average shift length. Calculated as total hours divided by days worked and average staff per day.
Certified Nursing Assistant

Helps with daily care and mobility.

CNA Staff Info All 1 CNA Staff are contractors. 1
Average shift length Info Average shift length. Calculated as total hours divided by days worked and average staff per day. 7.5 hours

Contractor staffing

Q2 2025 · Apr 1 – Jun 30 More info This data comes from the CMS Payroll-Based Journal report covering April 1 – June 30, 2025.

Total hours from contractors

1.4%

8 contractor hours this quarter

Certified Nursing Assistant: 1

Staff by category

Q2 2025 · Apr 1 – Jun 30 More info This data comes from the CMS Payroll-Based Journal report covering April 1 – June 30, 2025.
Administrator1015126498%8
Certified Nursing Assistant011812%7.5
1 Administrator
% of Days 98%
1 Certified Nursing Assistant
% of Days 2%

Penalties and fines

Federal penalties imposed by CMS for regulatory violations, including civil money penalties (fines) and denials of payment for new Medicare/Medicaid admissions.

Source: CMS Penalties Database

No penalties in the past 3 years

No civil money penalties or payment denials were reported in the last 3 years.

Breakdown by payment type

Medicare

23% of new residents, usually for short-term rehab.

Typical stay 1 months

Private pay

30% of new residents, often for short stays.

Typical stay 2 months

Medicaid

47% of new residents, often for long-term daily care.

Typical stay 9 - 10 months

Facility Characteristics

Source: CMS Long-Term Care Facility Characteristics (Data as of Jan 2026)

Total residents 37
Medicare
1
2.7% of residents
Medicaid
30
81.1% of residents
Private pay or other
6
16.2% of residents
Programs & Services
Residents Group

Residents meet regularly to discuss policies, care quality, and activities

Active Resident Council

Organized group of residents that meets regularly to discuss facility policies, quality of life, and activities.

Finances and operations

Based on CMS SNF Cost Report for fiscal year ending in 12/2023.

Privately-owned community
Operated by a business corporation.
Net patient revenue Info Net patient revenue — what the home actually collects for resident care, after contractual allowances, bad debt and discounts are subtracted from its gross charges (CMS cost report, Worksheet G-3). It covers resident care only; money the home earns from other sources is shown separately as "Other income."
$4.1M
Net patient income Info Net patient income: net patient revenue minus the home's total operating expenses. A positive figure means it earns more from resident care than it spends to deliver it; a negative figure means the opposite. It excludes non-operating "other income."
-$557.5K
Privately-owned community Operated by a business corporation.
Net patient revenue Info Net patient revenue — what the home actually collects for resident care, after contractual allowances, bad debt and discounts are subtracted from its gross charges (CMS cost report, Worksheet G-3). It covers resident care only; money the home earns from other sources is shown separately as "Other income."
$4.1M Rank #169 / 171Revenue — State benchmarkedThis home is ranked 169th out of 171 homes in Illinois. Shows this facility's annual revenue compared to the Illinois average. Higher revenue generally means more resources for staffing and capital — read alongside Payroll %.Ranking totals vary by category as each rank only includes facilities that report data for that metric. Homes missing that data point aren't included in the ranking.Click the rank badge to see the full State ranking.Click here to see the full State ranking.
Net patient income Info Net patient income: net patient revenue minus the home's total operating expenses. A positive figure means it earns more from resident care than it spends to deliver it; a negative figure means the opposite. It excludes non-operating "other income."
-$557.5K
Other income Info Money the home earns outside of resident care — such as investments, grants, rentals and other non-operating sources (CMS cost report, Worksheet G-3). It is tracked separately from net patient revenue: it is not part of that figure, and it is not included in net patient income.
$113.7K
Payroll costs Info Staff salaries plus wage-related costs — benefits such as payroll taxes, health insurance and retirement — from the home's own accounting records (CMS cost report, Worksheet A). Contract or agency labor is counted separately, under other operating costs. Rank #170 / 171Payroll — State benchmarkedThis home is ranked 170th out of 171 homes in Illinois. Shows total annual staff payroll benchmarked to the Illinois average. Higher payroll investment relative to peers often signals better staffing and less reliance on cheaper contract labor.Ranking totals vary by category as each rank only includes facilities that report data for that metric. Homes missing that data point aren't included in the ranking.Click the rank badge to see the full State ranking.Click here to see the full State ranking.
$1.9M 46.2% of net patient revenue Info Payroll as a share of revenue: staff salaries and wage-related benefits divided by net patient revenue. A higher figure means more of each revenue dollar goes to staff pay. Rank #93 / 171Payroll % — State benchmarkedThis home is ranked 93rd out of 171 homes in Illinois. Shows payroll as a percentage of revenue versus the Illinois average. Well-run Illinois facilities typically land around 54–67% — the top third Statewide. Below 25% may signal understaffing or heavy agency use — read with Staffing ratings.Ranking totals vary by category as each rank only includes facilities that report data for that metric. Homes missing that data point aren't included in the ranking.Click the rank badge to see the full State ranking.Click here to see the full State ranking.
Other operating costs Info Everything it costs to run the home apart from payroll — food, utilities, supplies, maintenance, contract labor and administration. Calculated as total operating expense minus payroll (staff salaries and wage-related benefits).
$2.8M
Total costs Info The home's total operating expense for the year — all the costs of running it, salaries included (CMS cost report, Worksheet G-3).
$4.6M

What does this home offer?

Building type icon
Building type icon

Building Type: Single-story

Fitness and recreation icon

Fitness and Recreation

Who this home usually serves

TYPE OF STAY

Mostly long-term care residents

Most residents stay for extended periods and receive ongoing daily care.

New residents most often arrive under Medicaid (47% of admissions), and a typical Medicaid stay runs around 9 - 10 months.

Admissions
109 total

Coverage residents most often arrive under.

Medicare 23%
Private pay 30%
Medicaid 47%
Discharges
75 total

Coverage residents most often leave under.

Medicare 17%
Private pay 32%
Medicaid 51%

Places of interest near Bloomington Rehabilitation and Health Care

Address 2.2 miles from city center Info Estimated distance in miles from Bloomington's city center to Bloomington Rehabilitation and Health Care's address, calculated via Google Maps.

Calculate Travel Distance to Bloomington Rehabilitation and Health Care

Add your location

Address

Compare Nursing Home around Bloomington

The information below is reported by the Illinois Department of Public Health, Office of Health Care Regulation.

5 facilities compared · CMS & IL Dept. of Health data

Westminster Village Al
NH
AL
IL
MC
Bloomington
72
Facility 72
IL AVG 86
Rank #209 / 426
100.0%
Facility 100.0%
IL AVG 69.3%
Rank #1 / 204
+44%
4.84
Facility 4.84
IL AVG 3.10
Rank #20 / 172
+15%+56%
$12.1k
Facility $12.1k
IL AVG $151.3k
Rank #78 / 173
26
Facility 26
IL AVG 36.8
Rank #62 / 172
5.2
Facility 5.2
IL AVG 3.7
Rank #150 / 172
290-
84
Facility 84
IL AVG 51
Rank #80 / 648
Matthew Riehle
$17.5M
Facility $17.5M
IL AVG $12.2M
Rank #20 / 171
$14.6M
Facility $14.6M
IL AVG $4.8M
Rank #10 / 171
83.1%
Facility 83.1%
IL AVG 44.3%
Rank #87 / 171
145400
Luther Oaks
NH
AL
IL
MC
Bloomington (Lutz Road)
58
Facility 58
IL AVG 86
Rank #272 / 426
31.0%
Facility 31.0%
IL AVG 69.3%
Rank #193 / 204
-55%
5.01
Facility 5.01
IL AVG 3.10
Rank #18 / 172
+16%+61%
$10.0k
Facility $10.0k
IL AVG $151.3k
Rank #74 / 173
29
Facility 29
IL AVG 36.8
Rank #73 / 172
4.1
Facility 4.1
IL AVG 3.7
Rank #122 / 172
318-
3
Facility 3
IL AVG 51
Rank #624 / 648
Lutheran Life Communities
$12.6M
Facility $12.6M
IL AVG $12.2M
Rank #96 / 171
$4.9M
Facility $4.9M
IL AVG $4.8M
Rank #131 / 171
38.6%
Facility 38.6%
IL AVG 44.3%
Rank #130 / 171
146184
Arcadia Care Bloomington
NH
AL
MC
RC
Bloomington
115
Facility 115
IL AVG 86
Rank #95 / 426
70.1%
Facility 70.1%
IL AVG 69.3%
Rank #120 / 204
+1%
1.95
Facility 1.95
IL AVG 3.10
Rank #159 / 172
-64%-37%
$179.8k
Facility $179.8k
IL AVG $151.3k
Rank #146 / 173
58
Facility 58
IL AVG 36.8
Rank #142 / 172
3.1
Facility 3.1
IL AVG 3.7
Rank #58 / 172
1191-
36
Facility 36
IL AVG 51
Rank #448 / 648
Bm Equities LLC
$8.2M
Facility $8.2M
IL AVG $12.2M
Rank #115 / 171
$4.7M
Facility $4.7M
IL AVG $4.8M
Rank #134 / 171
57.2%
Facility 57.2%
IL AVG 44.3%
Rank #101 / 171
145371
Goldwater Care Bloomington
NH
HC
Bloomington
88
Facility 88
IL AVG 86
Rank #155 / 426
79.8%
Facility 79.8%
IL AVG 69.3%
Rank #81 / 204
+15%
2.43
Facility 2.43
IL AVG 3.10
Rank #137 / 172
-54%-22%
$234.6k
Facility $234.6k
IL AVG $151.3k
Rank #156 / 173
87
Facility 87
IL AVG 36.8
Rank #167 / 172
3.6
Facility 3.6
IL AVG 3.7
Rank #91 / 172
1376-
66
Facility 66
IL AVG 51
Rank #187 / 648
Meir Katzenstein
$4.3M
Facility $4.3M
IL AVG $12.2M
Rank #166 / 171
$2.3M
Facility $2.3M
IL AVG $4.8M
Rank #165 / 171
52.3%
Facility 52.3%
IL AVG 44.3%
Rank #42 / 171
145016
Bloomington Rehabilitation and Health Care -
NH
AL
IL
MC
Bloomington
78
Facility 78
IL AVG 86
Rank #188 / 426
61.6%
Facility 61.6%
IL AVG 69.3%
Rank #152 / 204
-11%-----100%-------
59
Facility 59
IL AVG 51
Rank #247 / 648
Janice Kindred
$4.1M
Facility $4.1M
IL AVG $12.2M
Rank #169 / 171
$1.9M
Facility $1.9M
IL AVG $4.8M
Rank #170 / 171
46.2%
Facility 46.2%
IL AVG 44.3%
Rank #93 / 171
145610

Financial Assistance for
Nursing Home in Illinois

Bloomington Rehabilitation and Health Care is located in Bloomington, Illinois.
Here are the financial assistance programs available to residents in Illinois.

Get Financial aid guidance

Community Care Program

Illinois CCP

Age 60+
General Illinois resident, at risk of nursing home placement.
Income Limits (2025) ~$1,215/month individual
Asset Limits $17,500 individual, excludes home, car
IL

High demand in urban areas; waitlists possible.

Benefits
In-home care (3-5 hours/day) Adult day services ($65/day) Emergency home response systems ($30/month)

Illinois Respite Program

IL Respite (via NFCSP)

Age Caregiver of someone 60+ (or with dementia)
General Illinois resident.
Income Limits No strict limit; prioritizes low-income.
Asset Limits Not applicable.
IL

Limited slots; urban/rural balance.

Benefits
In-home respite (4-6 hours/day) Adult day care (~$65/day) Short-term facility care (up to 5 days)

Supportive Living Program (SLP)

Illinois Medicaid Supportive Living Program

Age 65+ or 22-64 with disability
General Illinois resident, Medicaid-eligible, needs moderate assistance (not nursing home-level).
Income Limits (2025) ~$2,829/month (300% FBR, individual); QIT allowed.
Asset Limits $2,000 (individual), $3,000 (couple) (excludes home, car).
IL

~200 SLP sites statewide; room/board not covered.

Benefits
Personal care (5-7 hours/day, e.g., bathing, mobility) Meals Housekeeping Medication management Respite (~240 hours/year)

Persons Who Are Elderly Waiver

Illinois Medicaid Elderly Waiver

Age 65+
General Illinois resident, Medicaid-eligible, nursing home-level care need.
Income Limits (2025) ~$2,829/month 300% FBR, individual
Asset Limits $2,000 (individual), $3,000 (couple).
IL

Part of HealthChoice Illinois; consumer-directed options available.

Benefits
Personal care (5-7 hours/day, e.g., dressing, eating) Homemaker Adult day care (~$60/day) Respite (240 hours/year) Home mods ($1,000 avg.)

Medicare Savings Program (MSP)

Illinois Medicare Savings Program

Age 65+ or disabled
General Illinois resident, Medicare Part A/B.
Income Limits (2025) ~$2,510/month (QMB), ~$3,380/month (SLMB), ~$3,598/month (QI)—individual.
Asset Limits $9,430 (individual), $14,130 (couple).
IL

Three tiers; no waitlist.

Benefits
Covers Part B premiums ($174.70/month) Deductibles ($240/year) Copays (~20%)

Optional State Supplementation (OSS)

Illinois Optional State Supplementation

Age 65+ or disabled
General Illinois resident, in approved facility, SSI recipient or low-income.
Income Limits (2025) ~$1,004/month including SSI
Asset Limits $2,000 (individual), $3,000 (couple).
IL

~$50-$500/month based on facility type.

Benefits
Cash (~$50-$500/month) for room/board in personal care homes or SLFs

VA Aid and Attendance (A&A) and Housebound Benefits

Illinois VA Aid and Attendance/Housebound

Age 65+ or disabled veteran/spouse
General Illinois resident, wartime service, need for ADL help (A&A) or homebound.
Income Limits (2025) Net income < ~$1,984/month (veteran with dependent, A&A); pension offsets income.
Asset Limits ~$155,356 net worth limit
IL

High veteran demand in urban/rural areas.

Benefits
Cash (~$1,433-$2,642/month veteran, ~$951-$1,318 spouse) for care costs (e.g., in-home, assisted living)

Frequently Asked Questions about Bloomington Rehabilitation and Health Care

Is Bloomington Rehabilitation and Health Care in a walkable area?

Bloomington Rehabilitation and Health Care has a walk score of 59. Moderately walkable. Some errands can be accomplished on foot, with a mix of nearby amenities.

What is the occupancy rate at Bloomington Rehabilitation and Health Care?

Bloomington Rehabilitation and Health Care's occupancy is 61.6%.

Are there photos of Bloomington Rehabilitation and Health Care?

Yes — there are 4 photos of Bloomington Rehabilitation and Health Care in the photo gallery on this page.

What is the address of Bloomington Rehabilitation and Health Care?

Bloomington Rehabilitation and Health Care is located at 1925 S Main St, Bloomington, IL 61704.

What is the phone number of Bloomington Rehabilitation and Health Care?

(309) 829-4348 will put you in contact with the team at Bloomington Rehabilitation and Health Care.

Is Bloomington Rehabilitation and Health Care Medicare or Medicaid certified?

Yes — Bloomington Rehabilitation and Health Care is a CMS-certified provider of Medicare and Medicaid.

Guides for Better Senior Living

Care Cost Calculator: See Prices in Your Area

Nursing Home Data Explorer

Don’t Wait Too Long: 7 Red Flag Signs Your Parent Needs Assisted Living Now

The True Cost of Assisted Living in 2025 – And How Families Are Paying For It

Understanding Senior Living Costs: Pricing Models, Discounts & Financial Assistance