


Total staff
259
Employees
114
Contractors
145
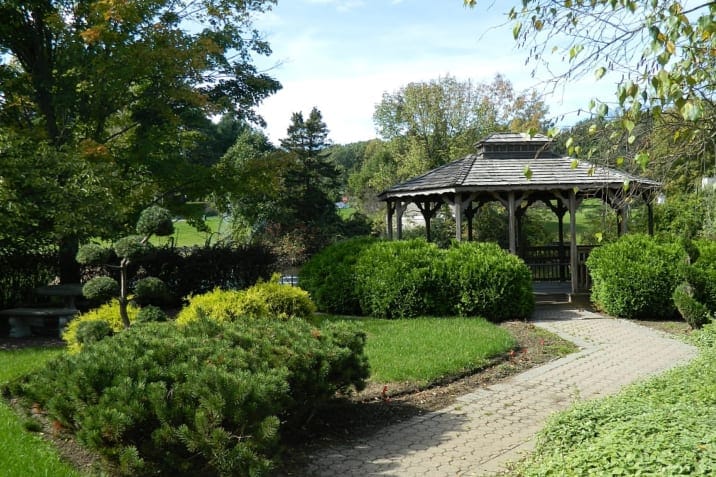


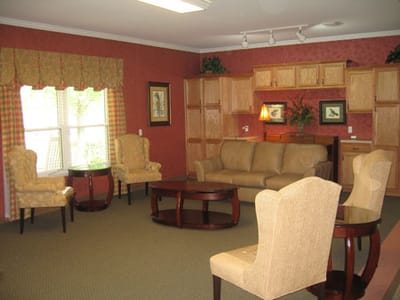
Bradford Village Assisted Living is a retirement home located in the heart of the Triad, just minutes from three major shopping areas and five large hospitals. The community is situated in Kernersville, a small, historic town that is a growing attraction for those who desire convenience and quality of life. Bradford Village offers a safe, comfortable, and secure home-like environment for residents and their families, with a mission to create a trusted care experience.
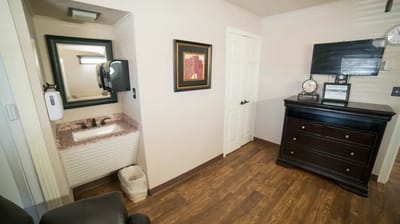
The retirement home provides a range of amenities and services, including 24-hour staffing, security, an emergency call system, companionship and conversation, medication dispensing, meal planning by a registered dietician, meal preparation and clean-up, assistance with walking, diet and eating monitoring, planned activities and games, entertainment, assistance with dressing and bathing, laundry service, housekeeping, escort to medical appointments, religious services, and utilities. Additional services such as a beauty shop, physical therapy, occupational therapy, speech therapy, physician and podiatry services, and pharmacy are available at an additional charge. Bradford Village Assisted Living offers a convenient location with nearby parks featuring paved walking paths, a lake, and picnic/recreation areas, providing residents with opportunities for outdoor activities and a high quality of life.
| Staff type | Hours / Day / Resident | vs state avg |
|---|---|---|
|
Registered Nurse (RN)
| 38m per day | |
|
LPN / LVN
| 54m per day | |
|
Nurse Aide
| 2h 29m per day | |
|
Weekend Total Nursing
| 3h 54m per day | |
|
Physical Therapist
| 1m per day | |
|
Weekend RN
| 22m per day |
Reporting period: October 1 – December 31, 2025 (Q4 2025). Source: CMS Payroll-Based Journal report.
State average ratio: 0 : 0
State average: 0 hours
Manages medical care and health needs.
Assists with medical care and medications.
Helps with daily care and mobility.
Total hours from contractors
10,024 contractor hours this quarter
| Certified Nursing Assistant | 53 | 95 | 148 | 17,905 | 92 | 100% | 7.7 |
| Licensed Practical Nurse | 13 | 22 | 35 | 6,745 | 92 | 100% | 8.4 |
| Registered Nurse | 7 | 15 | 22 | 2,678 | 92 | 100% | 9.2 |
| Clinical Nurse Specialist | 5 | 0 | 5 | 1,903 | 66 | 72% | 7.6 |
| Medication Aide/Technician | 8 | 6 | 14 | 1,859 | 89 | 97% | 9.2 |
| Physical Therapy Aide | 5 | 0 | 5 | 629 | 65 | 71% | 6.7 |
| Mental Health Service Worker | 1 | 0 | 1 | 537 | 64 | 70% | 8.4 |
| Speech Language Pathologist | 4 | 0 | 4 | 531 | 73 | 79% | 5.3 |
| Dietitian | 1 | 0 | 1 | 484 | 62 | 67% | 7.8 |
| Nurse Practitioner | 1 | 0 | 1 | 480 | 60 | 65% | 8 |
| Other Dietary Services Staff | 1 | 0 | 1 | 474 | 64 | 70% | 7.4 |
| Physical Therapy Assistant | 3 | 0 | 3 | 467 | 65 | 71% | 7 |
| Administrator | 1 | 0 | 1 | 448 | 56 | 61% | 8 |
| RN Director of Nursing | 1 | 0 | 1 | 432 | 62 | 67% | 7 |
| Qualified Social Worker | 5 | 0 | 5 | 366 | 69 | 75% | 3.2 |
| Respiratory Therapy Technician | 5 | 0 | 5 | 187 | 39 | 42% | 4.8 |
| Occupational Therapy Assistant | 0 | 3 | 3 | 65 | 9 | 10% | 5.9 |
| Occupational Therapy Aide | 0 | 2 | 2 | 63 | 21 | 23% | 3 |
| Medical Director | 0 | 2 | 2 | 30 | 21 | 23% | 1.4 |
Includes penalties issued in 2024
Federal penalties imposed by CMS for regulatory violations, including civil money penalties (fines) and denials of payment for new Medicare/Medicaid admissions.
Source: CMS Penalties Database (Data as of Jan 2026)
State average: $76K
State average: 2.3
State average: 0.4
Penalties are imposed by CMS for violations of federal nursing home regulations.
3 penalties in the past 3 years
Multiple penalties were reported in the last 3 years.
Last updated: Jan 2026
These measures show how residents usually do over time at this home, based on health outcomes and preventive care.
State average: 11.5
State average: 20.6
State average: 17.5%
State average: 23.3%
State average: 21.4%
State average: 3.6%
State average: 6.3%
State average: 2.6%
State average: 7.4%
State average: 4.4%
State average: 13.4%
State average: 91.6%
State average: 94.1%
State average: 79.9%
State average: 1.5%
State average: 78.1%
Quality measures are calculated from Minimum Data Set (MDS) assessments. For most measures, lower percentages indicate better care quality.
25% of new residents, usually for short-term rehab.
67% of new residents, often for short stays.
8% of new residents, often for long-term daily care.
Source: CMS Long-Term Care Facility Characteristics (Data as of Jan 2026)
Residents meet regularly to discuss policies, care quality, and activities
Organized group of residents that meets regularly to discuss facility policies, quality of life, and activities.
Data sourced from CMS Long-Term Care Facility Characteristics quarterly report. Payer mix reflects the current resident census by primary payment source.
Historical financial and operational data for Bradford Village Assisted Living from 2012–2023, based on CMS SNF Cost Reports.
Key figures below are for fiscal year ending in 09/2023.
Based on CMS SNF Cost Report for fiscal year ending in 09/2023.
Housing Options: Private / Semi-Private
Transportation Services
Residents typically stay for brief periods, with frequent admissions and discharges throughout the year.
Most new residents arrive under private pay (67% of admissions), and a typical private pay stay runs around 1 - 2 months.
Coverage residents most often arrive under.
Coverage residents most often leave under.
![]() 0.8 miles from city center
0.8 miles from city center
![]() Estimated distance in miles from Kernersville's city center to Bradford Village Assisted Living's address, calculated via Google Maps.
— 3.06 miles to nearest hospital (Novant Health Kernersville Medical Center)
Estimated distance in miles from Kernersville's city center to Bradford Village Assisted Living's address, calculated via Google Maps.
— 3.06 miles to nearest hospital (Novant Health Kernersville Medical Center)
Add your location
The information below is reported by the North Carolina Department of Health and Human Services, Division of Health Service Regulation.
| Carol Woods | NH AL IL SNF | Chapel Hill (Carol Woods) | - | 30 | - | 13 | Studio / 1 Bed / 2 Bed |
| Brookdale Carriage Club Providence | NH AL IL MC SNF | Charlotte (Olde Providence North) | - | 77 | A+ | 12 | Studio / 1 Bed / 2 Bed |
| Bradford Village Assisted Living | NH AL | Kernersville | - | 92 | - | 47 | Private / Semi-Private |
Bradford Village Assisted Living is in the Kernersville neighborhood.
Bradford Village Assisted Living has a walk score of 47. Somewhat walkable. A few nearby services may be reachable on foot, but most trips require transportation.
Bradford Village Assisted Living's occupancy is 87.1%.
Bradford Village Assisted Living is registered as a for-profit.
Yes — there are 7 photos of Bradford Village Assisted Living in the photo gallery on this page.
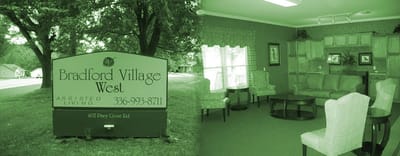
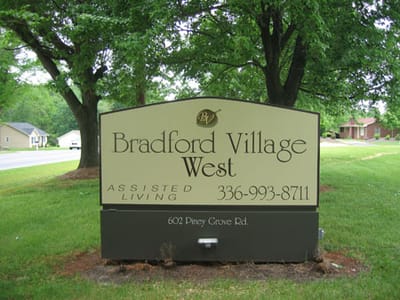
Bradford Village Assisted Living is located at 602 Piney Grv Rd, Kernersville, NC 27284.
(336) 993-8711 will put you in contact with the team at Bradford Village Assisted Living.
Care Cost Calculator: See Prices in Your Area
Nursing Home Data Explorer
Don’t Wait Too Long: 7 Red Flag Signs Your Parent Needs Assisted Living Now
The True Cost of Assisted Living in 2025 – And How Families Are Paying For It
Understanding Senior Living Costs: Pricing Models, Discounts & Financial Assistance


