


Total health inspections
3
Texas average 7.4
Last Health inspection on Nov 2025
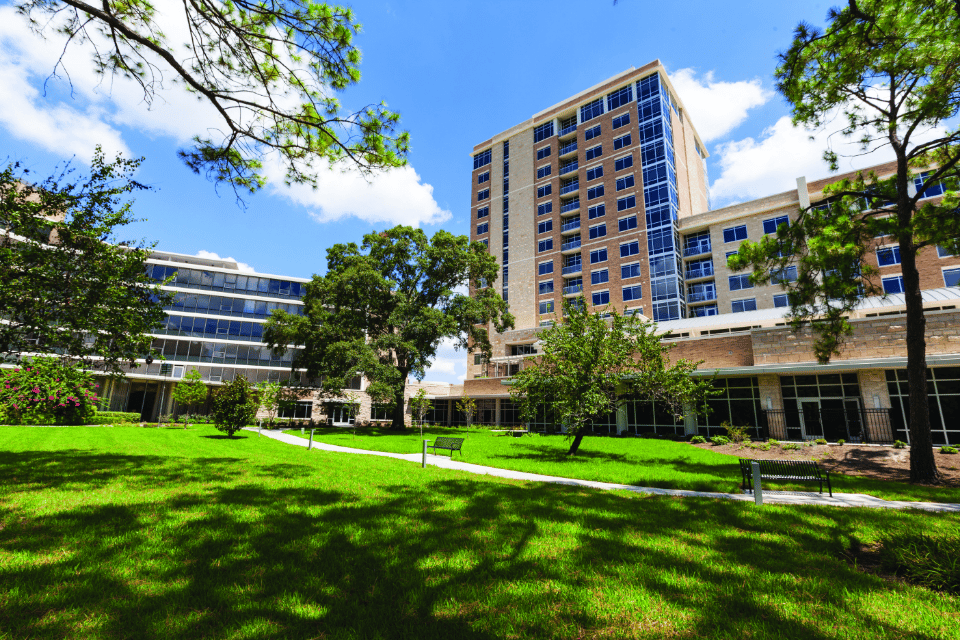


Located in Houston’s Braeswood neighborhood, Brazos Tower at Bayou Manor is a skilled nursing home. It’s a part of a Continuing Care Retirement Community campus that spans nursing home, assisted living, independent living, and memory care under one operator, Brazos Presbyterian Homes, Inc. The community holds 33 skilled nursing beds. It tends to run close to full, with an occupancy rate of about 80%. Residents accepted include those covered by Medicare and those paying privately, giving families multiple ways to arrange care.
Staffing is the home’s defining feature. Nursing staffing averages 5 hours and 47 minutes of direct care per resident daily, a figure that reflects meaningful hands-on attention for residents with more complex needs. Residents stay an average of 52 days, pointing to a strong focus on short-term, post-acute rehabilitation alongside longer-term nursing care. On-site rehabilitation services and respite care support residents recovering from a hospital stay or surgery. Residents also have access to 24-hour staffing.
For residents who need memory support, Brazos Tower holds an Alzheimer’s certification, which means it has additional training and programming for cognitive care needs. State inspection history for the community focuses on building and life-safety matters, such as fire drill documentation, emergency generator and alarm system upkeep, and door and extinguisher placement. These were not concerns tied to clinical or resident care.
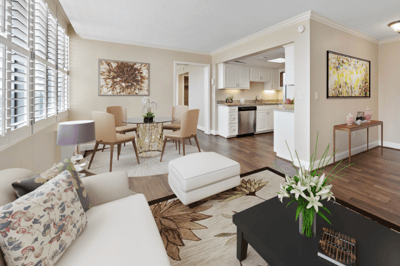
Amenities on-site include an indoor pool, a wellness and fitness center, a salon, and a massage and aerobics studio for residents who want to stay active. Social life centers on a 180-seat event and performance space and a bistro-style dining venue for casual, restaurant-quality meals. There’s also a meeting lounge and reserved parking available. It’s in a moderately walkable stretch of the Braeswood corridor; some errands can be handled on foot, with a mix of nearby amenities.
| Staff type | Hours / Day / Resident | vs state avg |
|---|---|---|
|
Registered Nurse (RN)
| 52m per day | ▲ 105% State avg: 25m per day · National avg: 41m per day |
|
LPN / LVN
| 1h 12m per day | ▲ 28% State avg: 57m per day · National avg: 52m per day |
|
Nurse Aide
| 4h 18m per day | ▲ 113% State avg: 2h 1m per day · National avg: 2h 20m per day |
|
Weekend Total Nursing
| 5h 53m per day | ▲ 96% State avg: 3h 0m per day · National avg: 3h 27m per day |
|
Physical Therapist
| 6m per day | ▲ 41% State avg: 4m per day · National avg: 4m per day |
|
Weekend RN
| 32m per day | ▲ 58% State avg: 20m per day · National avg: 29m per day |
Brazos Tower at Bayou Manor is legally operated by Brazos Presbyterian Homes, Inc.
In Texas, the Health and Human Services Commission (HHSC) is the primary regulatory body that conducts unannounced inspections and publishes quality reports for all long-term care homes.
Citations
| This Facility | TX Average | vs. TX Avg |
|---|---|---|---|
|
Total citations
| 6 | 6 | This facility has total citations in line with the Texas average (6 vs. TX avg 6).— At avg |
|
Life safety citations
| 6 | 6 | This facility has life safety citations in line with the Texas average (6 vs. TX avg 6).— At avg |
Inspections
| This Facility | TX Average | vs. TX Avg |
|---|---|---|---|
|
Inspections with citations
| 1 | 1 | This facility has inspections with citations in line with the Texas average (1 vs. TX avg 1).— At avg |
Texas average 7.4
Last Health inspection on Nov 2025
Texas average 25.9
Texas average 3.67
Health citations are formal notices following inspections when they fail to comply with safety and care standards.
4 of 5 citations resulted from standard inspections; and 1 of 5 resulted from complaint investigations.
Texas average: 2
Texas average: 0.4
Reporting period: October 1 – December 31, 2025 (Q4 2025). Source: CMS Payroll-Based Journal report.
Manages medical care and health needs.
Assists with medical care and medications.
Helps with daily care and mobility.
Total hours from contractors
2,585 contractor hours this quarter
| Certified Nursing Assistant | 22 | 6 | 28 | 8,115 | 92 | 100% | 7.7 |
| Licensed Practical Nurse | 8 | 2 | 10 | 3,137 | 92 | 100% | 10.1 |
| Medication Aide/Technician | 7 | 1 | 8 | 3,034 | 92 | 100% | 7.6 |
| Registered Nurse | 4 | 0 | 4 | 1,393 | 91 | 99% | 9.7 |
| Physical Therapy Aide | 0 | 4 | 4 | 984 | 70 | 76% | 6.7 |
| Dietitian | 1 | 0 | 1 | 512 | 61 | 66% | 8.4 |
| Nurse Practitioner | 1 | 0 | 1 | 504 | 63 | 68% | 8 |
| Speech Language Pathologist | 0 | 5 | 5 | 482 | 66 | 72% | 3.5 |
| Mental Health Service Worker | 1 | 0 | 1 | 456 | 57 | 62% | 8 |
| Qualified Social Worker | 0 | 1 | 1 | 413 | 62 | 67% | 6.7 |
| Clinical Nurse Specialist | 1 | 0 | 1 | 360 | 45 | 49% | 8 |
| Administrator | 2 | 0 | 2 | 312 | 39 | 42% | 8 |
| Respiratory Therapy Technician | 0 | 9 | 9 | 244 | 59 | 64% | 3.9 |
| Physical Therapy Assistant | 0 | 4 | 4 | 195 | 50 | 54% | 3.7 |
| Diagnostic X-ray Services Staff | 0 | 1 | 1 | 48 | 12 | 13% | 4 |
| Occupational Therapy Aide | 0 | 1 | 1 | 46 | 14 | 15% | 3.3 |
| Occupational Therapy Assistant | 0 | 1 | 1 | 18 | 3 | 3% | 6 |
| Medical Director | 0 | 1 | 1 | 12 | 12 | 13% | 1 |
Includes penalties issued in 2023
Federal penalties imposed by CMS for regulatory violations, including civil money penalties (fines) and denials of payment for new Medicare/Medicaid admissions.
Source: CMS Penalties Database (Data as of Jan 2026)
Texas average: $80K
Texas average: 2.5
Texas average: 0.2
Penalties are imposed by CMS for violations of federal nursing home regulations.
2 penalties in the past 3 years
Multiple penalties were reported in the last 3 years.
Last updated: Jan 2026
These measures show how residents usually do over time at this home, based on health outcomes and preventive care.
Texas average: 8.6
Texas average: 16.0
Texas average: 16.2%
Texas average: 15.7%
Texas average: 3.2%
Texas average: 4.4%
Texas average: 0.8%
Texas average: 3.5%
Texas average: 2.9%
Texas average: 7.9%
Texas average: 97.3%
Texas average: 97.9%
Texas average: 90.4%
Texas average: 1.4%
Texas average: 88.0%
Quality measures are calculated from Minimum Data Set (MDS) assessments. For most measures, lower percentages indicate better care quality.
72% of new residents, usually for short-term rehab.
28% of new residents, often for short stays.
Source: CMS Long-Term Care Facility Characteristics (Data as of Jan 2026)
Residents meet regularly to discuss policies, care quality, and activities
Part of a Continuing Care Retirement Community offering multiple care levels
Organized group of residents that meets regularly to discuss facility policies, quality of life, and activities.
Data sourced from CMS Long-Term Care Facility Characteristics quarterly report. Payer mix reflects the current resident census by primary payment source.
Historical financial and operational data for Brazos Tower at Bayou Manor from 2012–2023, based on CMS SNF Cost Reports.
Key figures below are for fiscal year ending in 12/2023.
Based on CMS SNF Cost Report for fiscal year ending in 12/2023.
Most residents typically stay for a few weeks or months before returning home or moving on.
Most new residents arrive under Medicare (72% of admissions), and a typical Medicare stay runs around 26 days.
Coverage residents most often arrive under.
Coverage residents most often leave under.
![]() 6.4 miles from city center
6.4 miles from city center
![]() Estimated distance in miles from Houston's city center to Brazos Tower at Bayou Manor's address, calculated via Google Maps.
Estimated distance in miles from Houston's city center to Brazos Tower at Bayou Manor's address, calculated via Google Maps.
Add your location
Info below is compiled from CMS reports & the TX Health & Human Services Commission (HHSC), senior community websites & trusted data sources such as Walk Score & BBB.
Communities are listed from highest to lowest based on our ranking methodology.
| Park Manor of CyFair | AL NH SNF | Houston (White Oak Bend) | 120
Facility
120
TX AVG
79
Rank
#204 / 972 |
89.2%
Facility
89.2%
TX AVG
67.3
Rank
#33 / 195 | +32% | 3.27
Facility
3.27
TX AVG
3.63
Rank
#158 / 239 | +82% | -10% | $0
Facility
$0
TX AVG
$81.8k
Rank
#1 / 244 | 7
Facility
7
TX AVG
25.9
Rank
#11 / 241 | 2.3
Facility
2.3
TX AVG
3.7
Rank
#39 / 241 | - | 107 | - |
55
Facility
55
TX AVG
41
Rank
#385 / 1389 | Hmg Park Manor Of Cyfair, L.l.c | $9.7MFiscal year ending 08/2024
Facility
$9.7MFiscal year ending 08/2024
TX AVG
$8.4M
Rank
#127 / 245 | $4.4MFiscal year ending 08/2024
Facility
$4.4MFiscal year ending 08/2024
TX AVG
$3.5M
Rank
#129 / 245 | 45.1%Fiscal year ending 08/2024
Facility
45.1%Fiscal year ending 08/2024
TX AVG
47%
Rank
#120 / 245 | 675818 | ||||
| Houston Transitional Care | AL HOS MC NH PC RC SNF | Houston (Braeburn) | 70
Facility
70
TX AVG
79
Rank
#503 / 972 |
96.0%
Facility
96.0%
TX AVG
67.3
Rank
#4 / 195 | +43% | 3.17
Facility
3.17
TX AVG
3.63
Rank
#181 / 239 | +22% | -13% | $0
Facility
$0
TX AVG
$81.8k
Rank
#1 / 244 | 16
Facility
16
TX AVG
25.9
Rank
#62 / 241 | 5.3
Facility
5.3
TX AVG
3.7
Rank
#222 / 241 | - | 67 | - |
75
Facility
75
TX AVG
41
Rank
#67 / 1389 | Ahmad El-Saadi | $12.3MFiscal year ending 12/2023
Facility
$12.3MFiscal year ending 12/2023
TX AVG
$8.4M
Rank
#30 / 245 | $5.1MFiscal year ending 12/2023
Facility
$5.1MFiscal year ending 12/2023
TX AVG
$3.5M
Rank
#116 / 245 | 41.4%Fiscal year ending 12/2023
Facility
41.4%Fiscal year ending 12/2023
TX AVG
47%
Rank
#240 / 245 | 676435 | ||||
| Caraday of Houston | AL MC NH RC SNF | Houston (Northside / Northline) | 150
Facility
150
TX AVG
79
Rank
#63 / 972 | - | - | 3.76
Facility
3.76
TX AVG
3.63
Rank
#77 / 239 | -32% | +4% | $0
Facility
$0
TX AVG
$81.8k
Rank
#1 / 244 | 15
Facility
15
TX AVG
25.9
Rank
#55 / 241 | 3.8
Facility
3.8
TX AVG
3.7
Rank
#167 / 241 | - | 12 | - |
41
Facility
41
TX AVG
41
Rank
#707 / 1389 | E&R Cunningham Investments, LP | $2.7MFiscal year ending 12/2023
Facility
$2.7MFiscal year ending 12/2023
TX AVG
$8.4M
Rank
#244 / 245 | $1.8MFiscal year ending 12/2023
Facility
$1.8MFiscal year ending 12/2023
TX AVG
$3.5M
Rank
#241 / 245 | 66.5%Fiscal year ending 12/2023
Facility
66.5%Fiscal year ending 12/2023
TX AVG
47%
Rank
#82 / 245 | 676470 | ||||
| Brazos Tower at Bayou Manor | AL IL MC NH SNF | Houston (Braeswood) | 33
Facility
33
TX AVG
79
Rank
#757 / 972 | - | - | 5.78
Facility
5.78
TX AVG
3.63
Rank
#5 / 239 | -37% | +59% | $46.6k
Facility
$46.6k
TX AVG
$81.8k
Rank
#169 / 244 | 5
Facility
5
TX AVG
25.9
Rank
#6 / 241 | 1.7
Facility
1.7
TX AVG
3.7
Rank
#8 / 241 | - | 28 | - |
64
Facility
64
TX AVG
41
Rank
#209 / 1389 | Sharon Darden | $4.7MFiscal year ending 12/2023
Facility
$4.7MFiscal year ending 12/2023
TX AVG
$8.4M
Rank
#25 / 245 | $7.0MFiscal year ending 12/2023
Facility
$7.0MFiscal year ending 12/2023
TX AVG
$3.5M
Rank
#49 / 245 | 151%Fiscal year ending 12/2023
Facility
151%Fiscal year ending 12/2023
TX AVG
47%
Rank
#233 / 245 | 676282 | ||||
| Capstone Healthcare Estates on Orem | AL HOS MC NH PC RC SNF | Houston (Central Southwest) | 120
Facility
120
TX AVG
79
Rank
#204 / 972 |
74.9%
Facility
74.9%
TX AVG
67.3
Rank
#84 / 195 | +11% | 3.69
Facility
3.69
TX AVG
3.63
Rank
#95 / 239 | -25% | +2% | $34.4k
Facility
$34.4k
TX AVG
$81.8k
Rank
#149 / 244 | 20
Facility
20
TX AVG
25.9
Rank
#113 / 241 | 2.9
Facility
2.9
TX AVG
3.7
Rank
#92 / 241 | 1 | 90 | - |
55
Facility
55
TX AVG
41
Rank
#385 / 1389 | - | $9.3MFiscal year ending 12/2023
Facility
$9.3MFiscal year ending 12/2023
TX AVG
$8.4M
Rank
#126 / 245 | $4.2MFiscal year ending 12/2023
Facility
$4.2MFiscal year ending 12/2023
TX AVG
$3.5M
Rank
#106 / 245 | 45.8%Fiscal year ending 12/2023
Facility
45.8%Fiscal year ending 12/2023
TX AVG
47%
Rank
#76 / 245 | 676314 |
Brazos Tower at Bayou Manor is located in HOUSTON, Texas.
Here are the financial assistance programs available to residents in Texas.
Brazos Tower at Bayou Manor is in the Braeswood neighborhood of HOUSTON.
Brazos Tower at Bayou Manor is legally operated by Brazos Presbyterian Homes, Inc.
Brazos Tower at Bayou Manor has a walk score of 64. Moderately walkable. Some errands can be accomplished on foot, with a mix of nearby amenities.
Brazos Tower at Bayou Manor's occupancy is 80.2%.
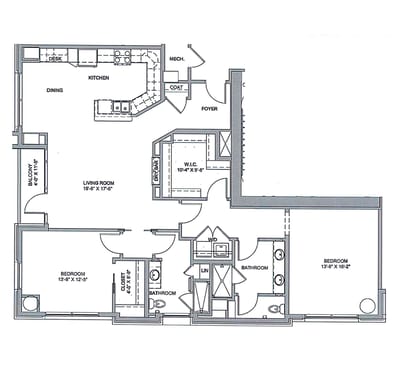
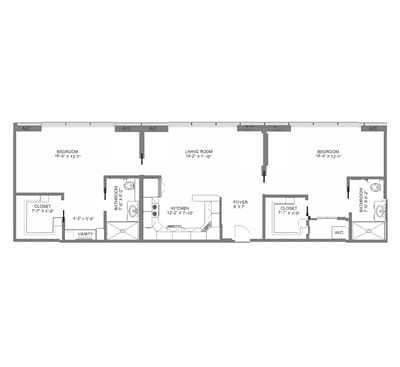
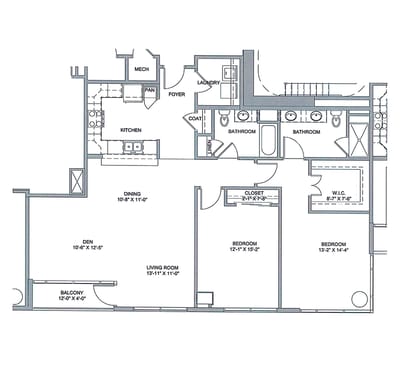
Yes — see the floorplan options available at Brazos Tower at Bayou Manor on this page.
No, Brazos Tower at Bayou Manor has a no-pet policy.
Brazos Tower at Bayou Manor is registered as a non-profit in TX.
Care Cost Calculator: See Prices in Your Area
Nursing Home Data Explorer
Don’t Wait Too Long: 7 Red Flag Signs Your Parent Needs Assisted Living Now
The True Cost of Assisted Living in 2025 – And How Families Are Paying For It
Understanding Senior Living Costs: Pricing Models, Discounts & Financial Assistance


