Thank you for your interest!
Our team will be in touch shortly to help with next steps.
Assisted Living in Columbia
Bredd Health Services II, LLC
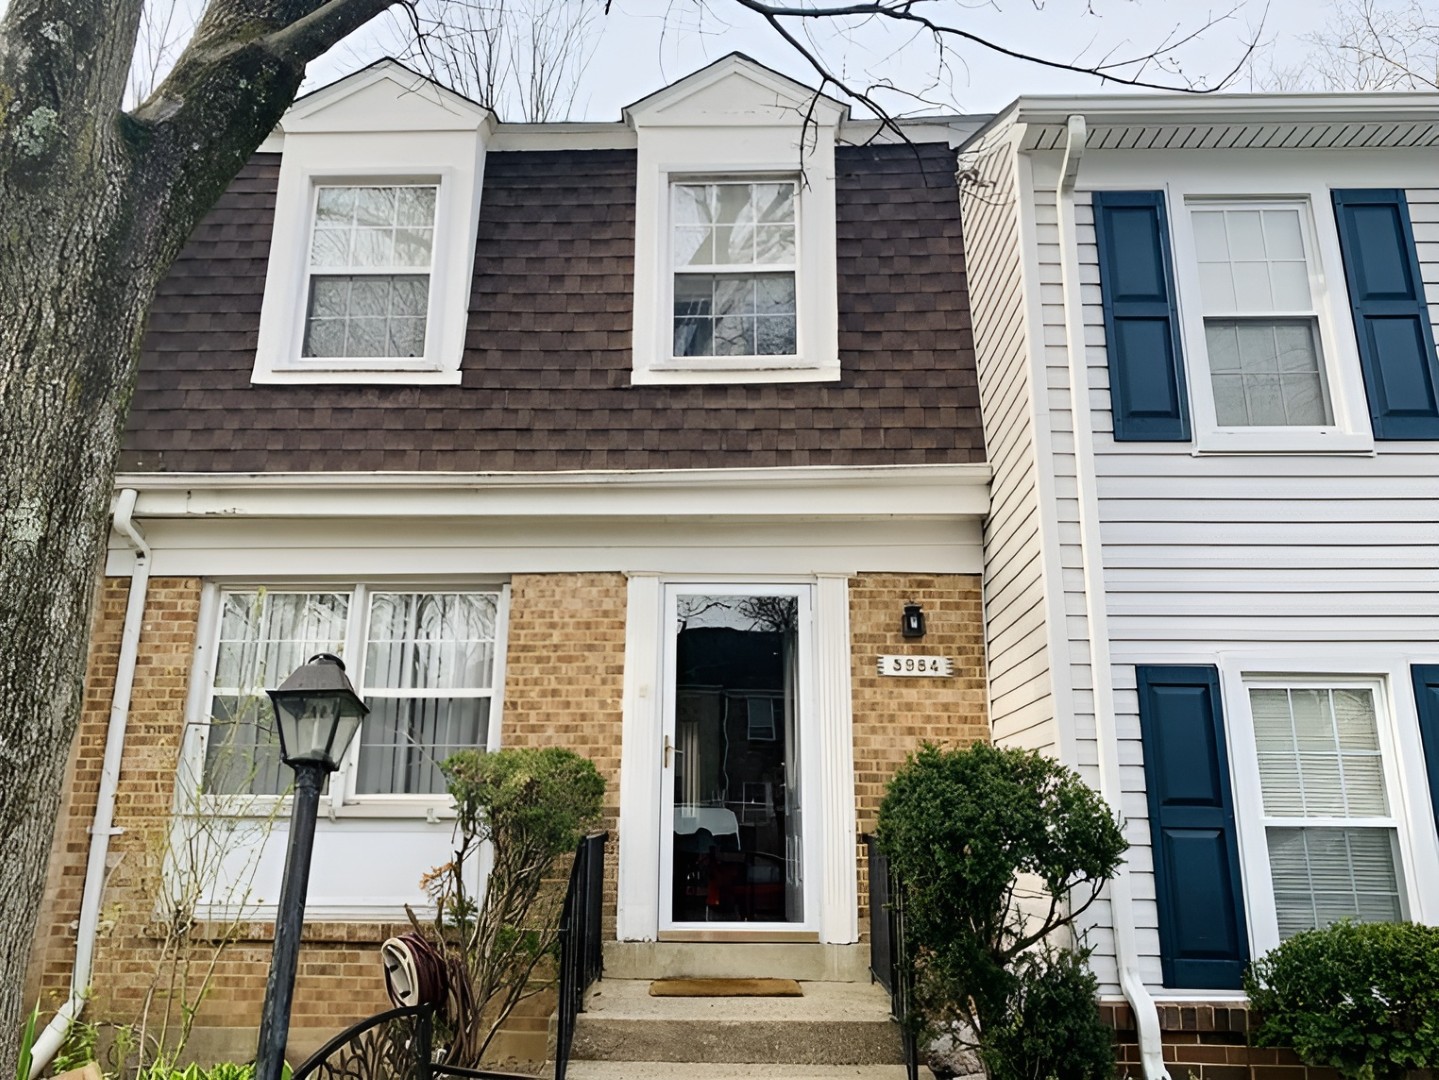
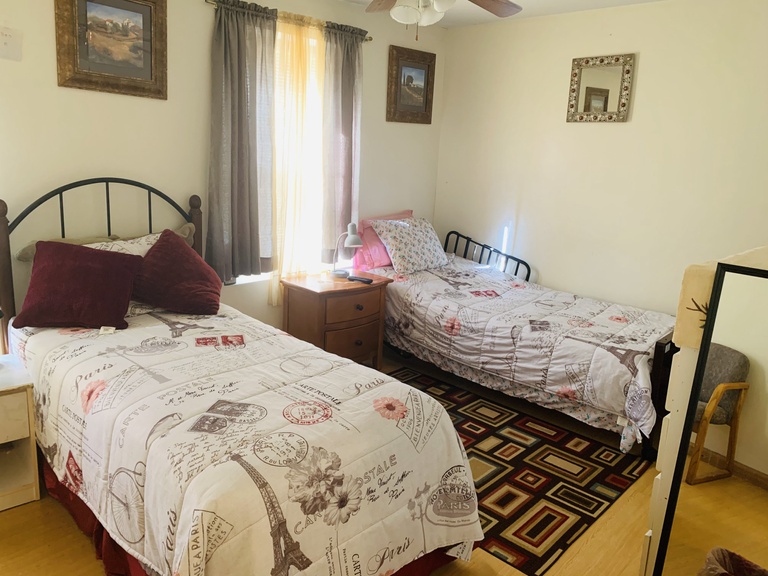
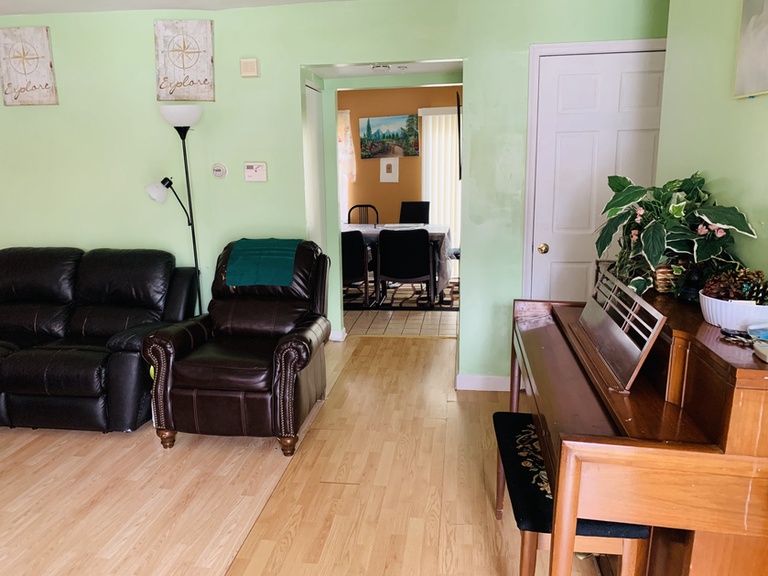
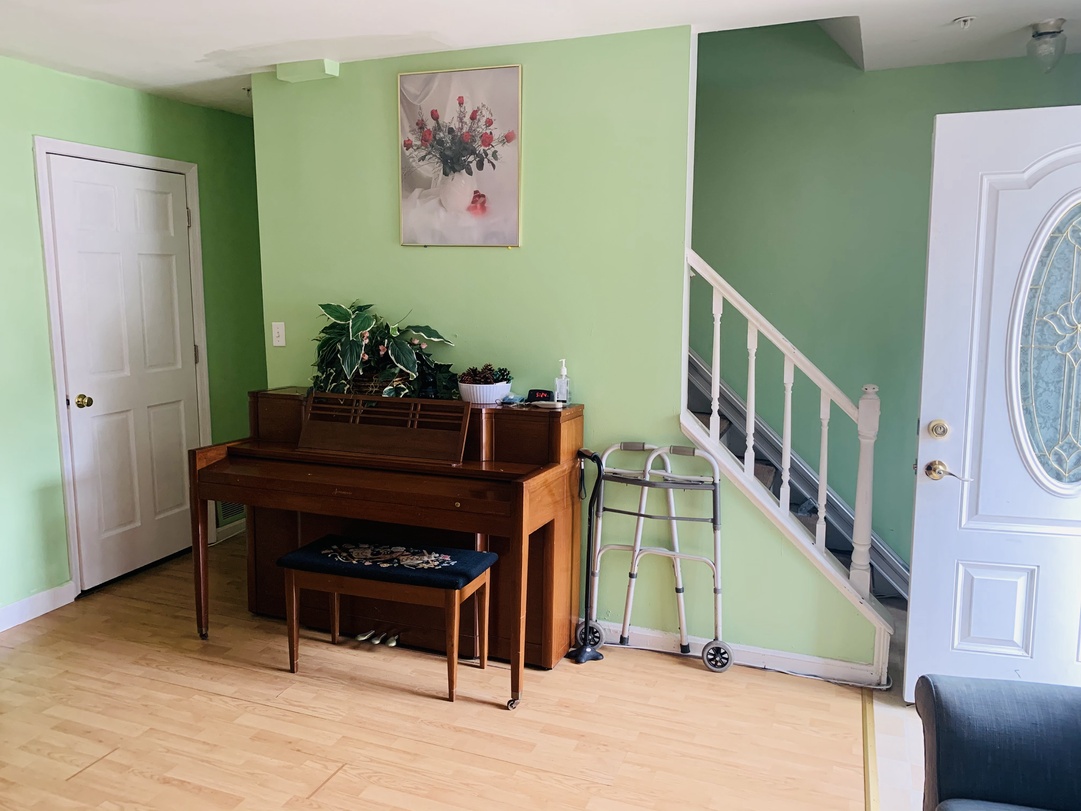
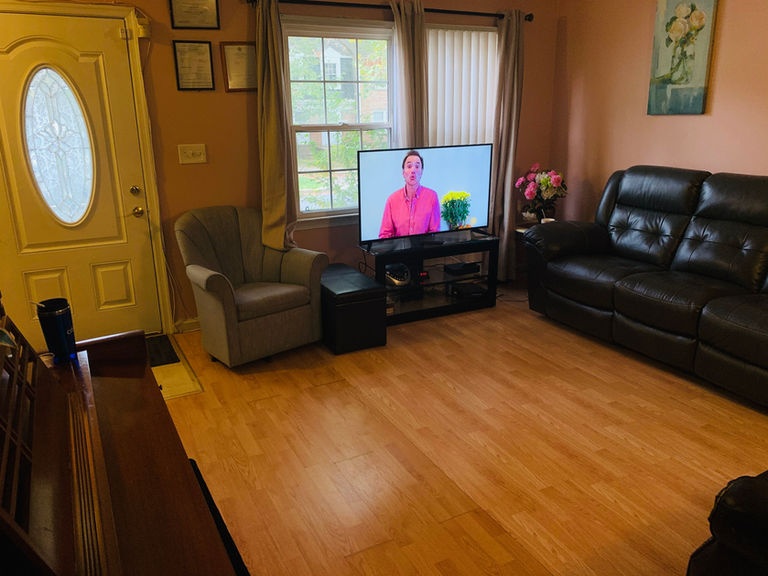
Bredd Health Services Ii, LLC is a women-owned assisted living community in Columbia, MD, offering personal care. Promoting a comfortable, home-like setting, the community ensures older adults are well-cared for. Medication monitoring, personalized meal plans, and household services are among the excellent services provided to enrich residents’ living experiences. Along with a well-trained care team, customized care plans are also provided to meet residents’ unique needs and preferences.
Social events, exercises, and games provide residents with more opportunities to explore hobbies and maintain their holistic well-being. With accessible amenities and spacious gathering areas, residents can rest and socialize. Situated in the quiet residential area of Columbia, the community guarantees a stress-free retirement. This assisted living community has exceptional services dedicated to older adults’ welfare, making it an ideal choice for senior living in Maryland.
What does this home offer?
Building Type: 2-story
Dining Services
Medication Management
Types of Care at Bredd Health Services II, LLC
Compare Assisted Living around Columbia The information below is reported by the Maryland Department of Health, Office of Health Care Quality.
| Brighton Gardens of Columbia |
AL Assisted Living A licensed, long-term care setting for seniors or individuals with disabilities who need help with daily activities — like bathing, dressing, and medication management — but not 24-hour skilled nursing. Offers housing, meals, and around-the-clock support while aiming to maximize resident independence.
MC Memory Care Secured, specialized care for people living with Alzheimer's or dementia. Staff trained in cognitive impairment, with higher staff-to-resident ratios and an environment designed to reduce confusion and wandering risk. | Columbia (Owen Brown) | 102 | Yes | 60 | - | 27 | - |
16% Male Residents — State Benchmarked 16% of residents are male, compared to the Maryland average of 31%. This facility caters to a majority female resident pool (84% female), consistent with the broader assisted living trend where women significantly outnumber men. |
84% Female Residents — State Benchmarked 84% of residents are female, compared to the Maryland average of 69%. Women comprise the large majority, consistent with national assisted living demographics where women live longer and enter care facilities at higher rates. |
83% White Residents — State Benchmarked 83% of residents are reported as White, compared to the Maryland average of 81%. Close to the average for this category among assisted living facilities in Maryland with reported race/ethnicity data. |
12% African American Residents — State Benchmarked 12% of residents are reported as African American or Black, compared to the Maryland average of 12%. In line with the Maryland average for African American residents among facilities reporting this breakdown. |
5% Other Ethnicity Residents — State Benchmarked 5% of residents fall into categories other than White or African American (combined), compared to the Maryland average of 7%. This column aggregates Hispanic, Asian, multiracial, and any other labeled groups that are not classified as White or African American. Reported subgroups in this total: Hispanic (4%), Asian (1%). |
13% Residents Age 65–74 — State Benchmarked 13% of residents are 65–74, compared to the Maryland average of 12%. In line with the statewide profile for this youngest senior bracket in assisted living. |
33% Residents Age 75–84 — State Benchmarked 33% of residents are 75–84, compared to the Maryland average of 31%. This is the second most common age bracket in assisted living, representing residents with moderate care needs. |
40% Residents Age 85–94 — State Benchmarked 40% of residents are 85–94, compared to the Maryland average of 44%. This is typically the most common age bracket in assisted living — this facility is in line with the statewide norm. |
9% Residents Age 95+ — State Benchmarked 9% of residents are 95 or older, compared to the Maryland average of 16%. Most residents here have not yet reached the oldest-old bracket, suggesting a younger overall community. |
| Sunrise of Columbia |
AL Assisted Living A licensed, long-term care setting for seniors or individuals with disabilities who need help with daily activities — like bathing, dressing, and medication management — but not 24-hour skilled nursing. Offers housing, meals, and around-the-clock support while aiming to maximize resident independence.
MC Memory Care Secured, specialized care for people living with Alzheimer's or dementia. Staff trained in cognitive impairment, with higher staff-to-resident ratios and an environment designed to reduce confusion and wandering risk. | Columbia (Hickory Ridge) | 96 | Yes | 53 | - | 29 | A- |
31% Male Residents — State Benchmarked 31% of residents are male, compared to the Maryland average of 31%. This facility caters to a majority female resident pool (69% female), consistent with the broader assisted living trend where women significantly outnumber men. |
69% Female Residents — State Benchmarked 69% of residents are female, compared to the Maryland average of 69%. Women comprise the large majority, consistent with national assisted living demographics where women live longer and enter care facilities at higher rates. |
88% White Residents — State Benchmarked 88% of residents are reported as White, compared to the Maryland average of 81%. Close to the average for this category among assisted living facilities in Maryland with reported race/ethnicity data. |
5% African American Residents — State Benchmarked 5% of residents are reported as African American or Black, compared to the Maryland average of 12%. In line with the Maryland average for African American residents among facilities reporting this breakdown. |
6% Other Ethnicity Residents — State Benchmarked 6% of residents fall into categories other than White or African American (combined), compared to the Maryland average of 7%. This column aggregates Hispanic, Asian, multiracial, and any other labeled groups that are not classified as White or African American. Reported subgroups in this total: Asian (4%), American Indian (1%), Hispanic (1%). |
6% Residents Age 65–74 — State Benchmarked 6% of residents are 65–74, compared to the Maryland average of 12%. Fewer younger seniors suggests the resident population skews older, likely requiring higher acuity care and more hands-on support. |
38% Residents Age 75–84 — State Benchmarked 38% of residents are 75–84, compared to the Maryland average of 31%. A high concentration in this mid-range bracket, where residents typically need moderate support with daily activities. |
36% Residents Age 85–94 — State Benchmarked 36% of residents are 85–94, compared to the Maryland average of 44%. The population here skews younger than the statewide norm, which may indicate a more active, lower-acuity community. |
19% Residents Age 95+ — State Benchmarked 19% of residents are 95 or older, compared to the Maryland average of 16%. In line with the statewide profile for the oldest resident bracket. |
| Family First Haven |
AL Assisted Living A licensed, long-term care setting for seniors or individuals with disabilities who need help with daily activities — like bathing, dressing, and medication management — but not 24-hour skilled nursing. Offers housing, meals, and around-the-clock support while aiming to maximize resident independence.
MC Memory Care Secured, specialized care for people living with Alzheimer's or dementia. Staff trained in cognitive impairment, with higher staff-to-resident ratios and an environment designed to reduce confusion and wandering risk. | Columbia | 8 | No | - | - | - | - | - | - | - | - | - | - | - | - | - |
| Columbia Care Home |
AL Assisted Living A licensed, long-term care setting for seniors or individuals with disabilities who need help with daily activities — like bathing, dressing, and medication management — but not 24-hour skilled nursing. Offers housing, meals, and around-the-clock support while aiming to maximize resident independence. | Columbia | 8 | No | - | - | - | - | - | - | - | - | - | - | - | - | - |
| Bredd Health Services II, LLC |
AL Assisted Living A licensed, long-term care setting for seniors or individuals with disabilities who need help with daily activities — like bathing, dressing, and medication management — but not 24-hour skilled nursing. Offers housing, meals, and around-the-clock support while aiming to maximize resident independence. | Columbia | - | No | - | - | - | - | - | - | - | - | - | - | - | - | - |
Places of interest near Bredd Health Services II, LLC
1.8 miles from city center
Estimated distance in miles from Columbia's city center to Bredd Health Services II, LLC's address, calculated via Google Maps.
Calculate Travel Distance to Bredd Health Services II, LLC
Add your location
Guides for Better Senior Living
Care Cost Calculator: See Prices in Your Area
Nursing Home Data Explorer
Don’t Wait Too Long: 7 Red Flag Signs Your Parent Needs Assisted Living Now
The True Cost of Assisted Living in 2025 – And How Families Are Paying For It
Understanding Senior Living Costs: Pricing Models, Discounts & Financial Assistance
Financial Aid for Maryland Seniors
Get financial aid guidanceTouring Checklist for Senior Living
Touring a community? Use this expert-backed checklist to stay organized, ask the right questions, and find the perfect fit.
Location
Community Spaces and Overall Environment
Services
Staffing
Accommodations
Finances
Other Notes
Send Checklist to Your Email
We'll send you a PDF version of the touring checklist.
Write a review for Bredd Health Services II, LLC
Rate your overall experience with this community
Need Help?
Let us help you or a loved one find the perfect senior home.


