BRIA of Geneva
Nursing Home & Memory Care · St. Charles, IL
CMS overall rating Info CMS (the Centers for Medicare & Medicaid Services) is the federal agency that rates nursing home quality. Its Overall Rating runs from 1 to 5 stars, combining health inspections, staffing, and quality measures, with inspections weighted most heavily.

BRIA of Geneva

Nursing Home & Memory Care · St. Charles, IL
CMS overall rating Info CMS (the Centers for Medicare & Medicaid Services) is the federal agency that rates nursing home quality. Its Overall Rating runs from 1 to 5 stars, combining health inspections, staffing, and quality measures, with inspections weighted most heavily.
Calculator: See prices in your area
BRIA of Geneva accepts Medicare, Medicaid, and private pay.

Overview of Bria of Geneva

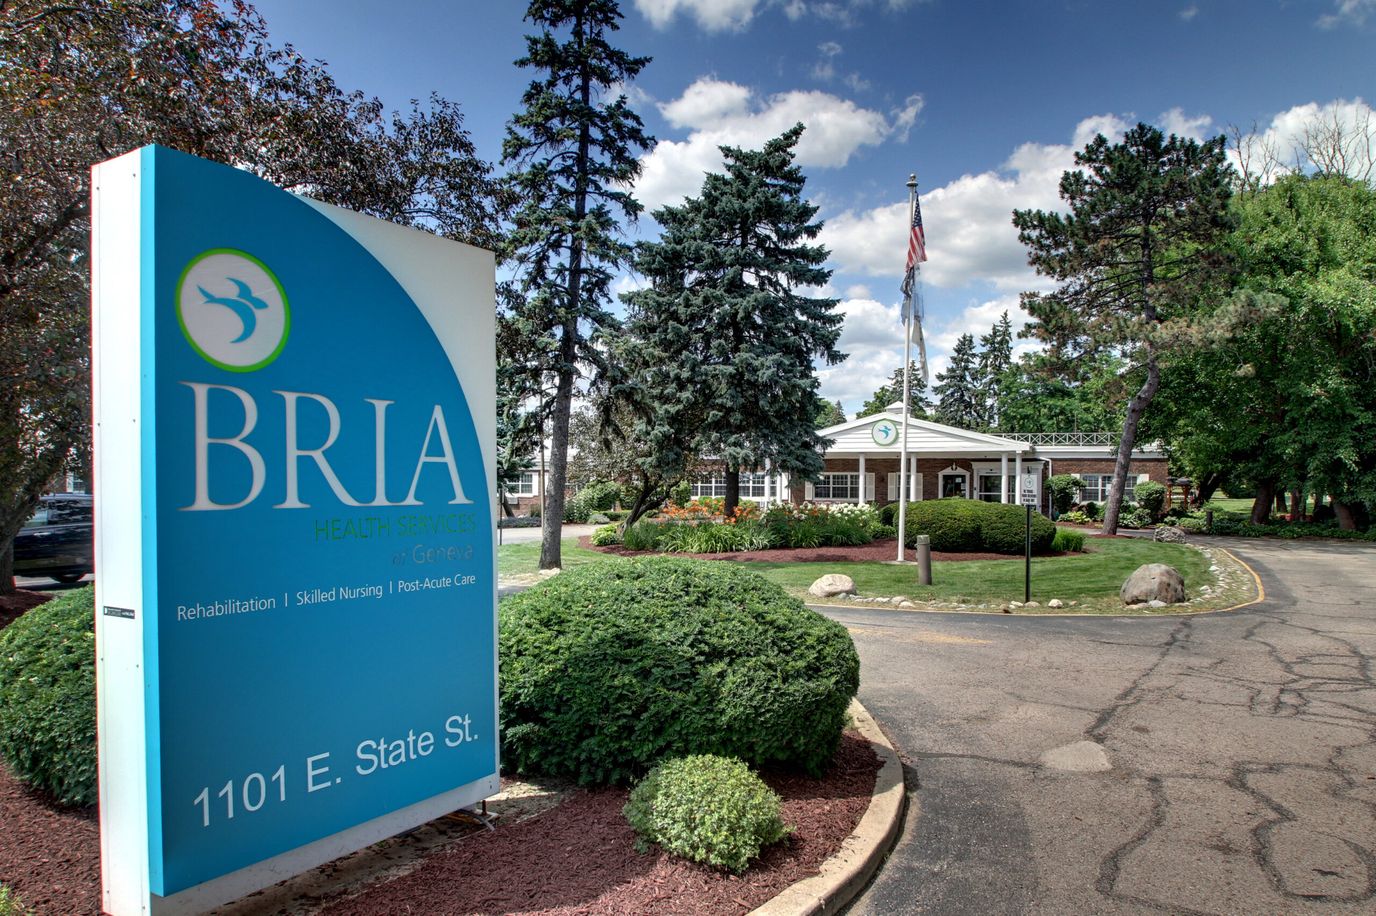
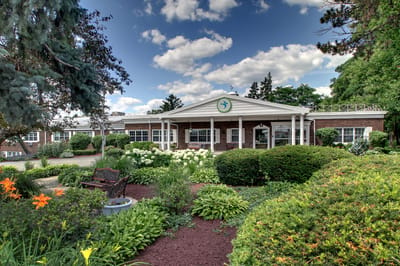
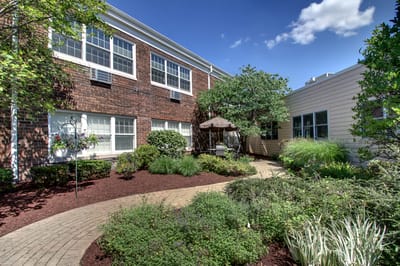
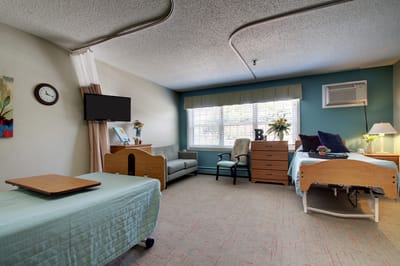
Bria of Geneva is a nursing home in Geneva, IL, offering memory care, rehabilitation, and skilled nursing. Promoting a compassionate and welcoming environment, the community ensures older adults are well-cared for. 24-hour care, restaurant-style dining, and therapies are also provided to enrich residents’ living experiences. The community also works closely with residents to provide the best possible care for their unique needs and preferences.

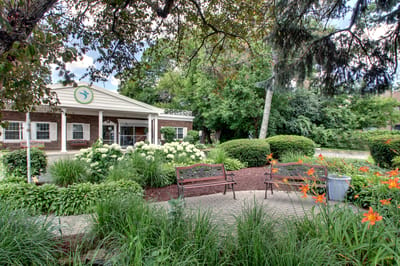
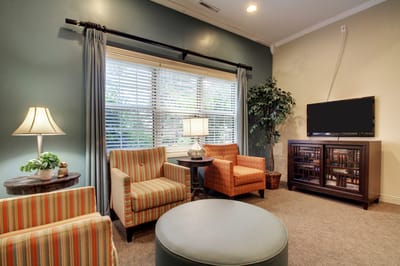
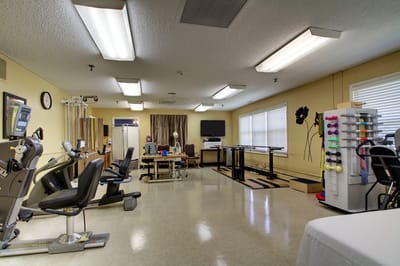
Fun events, light exercises, and various recreational opportunities encourage residents to stay active and have fun. Top-notch rehabilitation gyms and newly renovated amenities also ensure residents can rest and focus on their recovery. With its ideal location in the tree-lined neighborhood of Geneva, near restaurants and shops, the community guarantees accessibility and convenience. This nursing home also ensures residents can live to their potential in retirement, making it one of the best options for senior living in Illinois.

(630) 232-7544

Quality ratings

Measured by Centers for Medicare & Medicaid Services (CMS)

Overall rating Info The Overall CMS Rating combines results from health inspections, staffing levels and quality measures. Health inspections carry the most weight. Staffing and quality scores can increase or decrease the final rating based on performance compared to state and national standards.
▲ 19.0% Above IL avg. ▲ 19.0% Above IL avg.IL average: 2.5Click the badge to see the full State ranking.Click here to see the full State ranking.
Health Inspection Info Based on the results of the facility's three most recent standard inspections and any complaint investigations. CMS reviews the number, scope, and severity of deficiencies, with more recent findings weighted more heavily.
▲ 44.1% Above IL avg. ▲ 44.1% Above IL avg.IL average: 2.8Click the badge to see the full State ranking.Click here to see the full State ranking.
Staffing Info Measures average nursing staff hours per resident per day, including Registered Nurses (RNs) and total nursing staff. Ratings are adjusted based on the level of care residents require and are compared to state and national benchmarks.
▼ 53.2% Below IL avg. ▼ 53.2% Below IL avg.IL average: 2.1Click the badge to see the full State ranking.Click here to see the full State ranking.
Quality Measures Info Based on clinical and physical health indicators reported to CMS, such as hospital readmissions, falls, pressure ulcers, and improvements in mobility. These measures reflect how well residents' health needs are being managed.
▲ 6.6% Above IL avg. ▲ 6.6% Above IL avg.IL average: 2.8Click the badge to see the full State ranking.Click here to see the full State ranking.

Staffing hours breakdown

Info Daily nursing hours per resident by staff type, reported to CMS. Higher is generally better — compare this facility to state and national averages to see where staffing stands.

Hours per resident per day — compared to Illinois state averages

Total nursing care / resident Info This home is ranked 57th out of 172 homes in Illinois for nurse hours. Total adjusted nursing hours per resident per day, combining RN, LPN, and aide time. CMS adjusts this for case-mix so facilities can be fairly compared.
3h 24m per day
Rank #57 / 172Nurse hours — State benchmarkedThis home is ranked 57th out of 172 homes in Illinois. Shows adjusted nurse hours per resident per day benchmarked to the Illinois average, with a ranking across 172 Illinois facilities. More hours mean more direct care. The national average is about 3.5 hrs; below 3.0 is a red flag.Rankings are based only on facilities in Illinois that report data for that category. Facilities without available data are excluded from the ranking.Click the rank badge to see the full State ranking.Click here to see the full State ranking.
This facility Illinois avg (3h 6m per day)
vs Illinois avg
+9%

2 of 6 metrics below state avg

Standout metric Physical Therapist is +111% above state avg
Staff typeHours / Day / Residentvs state avg
Registered Nurse (RN) Info RNs hold the highest nursing license and can assess residents, interpret test results, and direct care plans. More RN hours per day often signals stronger clinical oversight and faster response to health changes. 32m per day ▼ 26% State avg: 43m per day · National avg: 41m per day
LPN / LVN Info Licensed Practical Nurses (LPNs) or Licensed Vocational Nurses (LVNs) deliver routine hands-on care — medication administration, wound dressing, and monitoring vital signs. They work under RN supervision and make up a large share of daily bedside care. 51m per day ▲ 31% State avg: 39m per day · National avg: 52m per day
Nurse Aide Info Certified Nurse Aides (CNAs) provide the most direct day-to-day assistance: bathing, dressing, feeding, and mobility. Nurse aide hours are typically the largest staffing category and directly affect residents' quality of life. 2h 25m per day ▲ 14% State avg: 2h 7m per day · National avg: 2h 20m per day
Weekend Total Nursing Info Combined nursing hours (RN + LPN + Nurse Aide) per resident per day on weekends. Staffing often drops on weekends — this figure reveals whether the facility maintains adequate coverage outside of weekday hours. 3h 2m per day ■ Avg State avg: 3h 6m per day · National avg: 3h 27m per day
Physical Therapist Info Hours per resident per day provided by licensed Physical Therapists (PTs) or PT Assistants. PT services help residents recover mobility after injury or illness and are especially important for post-acute (short-stay) rehabilitation. 6m per day ▲ 111% State avg: 3m per day · National avg: 4m per day
Weekend RN Info Registered nurse hours specifically on weekends. Facilities sometimes reduce RN presence on Saturdays and Sundays — a low weekend RN figure compared to weekday hours can indicate reduced clinical oversight when most administrative staff are absent. 31m per day ▼ 6% State avg: 33m per day · National avg: 29m per day

Capacity and availability

This home usually has availability

Higher occupancy than the Illinois average: 69.3%
Occupancy rate
83.3% Rank #68 / 204Occupancy rate — State benchmarkedThis home is ranked 68th out of 204 homes in Illinois. Shows this facility's occupancy rate versus the Illinois average, with its Statewide rank out of 204. Higher occupancy signals strong local demand and financial stability.Rankings are based only on facilities in Illinois that report data for that category. Facilities without available data are excluded from the ranking.Click the rank badge to see the full State ranking.Click here to see the full State ranking.
Avg. Length of Stay
493 days
Bed community size
107-bed community Rank #111 / 426Bed count — State benchmarkedThis home is ranked 111th out of 426 homes in Illinois. Shows this facility's certified or reported bed count compared to other Illinois facilities. Larger communities may offer more amenities, programs, and on-site services for residents and families.Rankings are based only on facilities in Illinois that report data for that category. Facilities without available data are excluded from the ranking.Click the rank badge to see the full State ranking.Click here to see the full State ranking.
A larger shared setting that may offer more common spaces and organized community services.
Walk Score
Walk Score: 61 / 100 Rank #223 / 648Walk Score — State benchmarkedThis home is ranked 223rd out of 648 homes in Illinois. Shows how walkable this facility's neighborhood is compared to the average Walk Score across Illinois facilities. Higher scores benefit residents, families, and staff.Rankings are based only on facilities in Illinois that report data for that category. Facilities without available data are excluded from the ranking.Click the rank badge to see the full State ranking.Click here to see the full State ranking.
Moderately walkable. Some errands can be accomplished on foot, with a mix of nearby amenities.

Contact BRIA of Geneva

Staffing Data

Reporting period: October 1 – December 31, 2025 (Q4 2025). Source: CMS Payroll-Based Journal report.

Total staff 158
Employees 135
Contractors 23
Staff to resident ratio 1.72 : 1
0% compared with Illinois average
Illinois average ratio: 1.80 : 1 Illinois average ratio: 1.80 : 1See full Illinois ranking
Avg staff/day 53
Average shift 7.8 hours
0% compared with Illinois average
Illinois average: 7.6 hours Illinois average shift: 7.6 hoursSee full Illinois ranking
Total staff hours (quarter) 38,276

Nursing staff breakdown

Q4 2025 · Oct 1 – Dec 31 More info This data comes from the CMS Payroll-Based Journal report covering October 1 – December 31, 2025.
Registered Nurse

Manages medical care and health needs.

RN Staff Info 21 total: 17 full-time employees and 4 contractors. 21
Average shift length Info Average shift length. Calculated as total hours divided by days worked and average staff per day. 9.6 hours
Licensed Practical Nurse

Assists with medical care and medications.

LPN Staff Info 26 total: 20 full-time employees and 6 contractors. 26
Average shift length Info Average shift length. Calculated as total hours divided by days worked and average staff per day. 9.4 hours
Certified Nursing Assistant

Helps with daily care and mobility.

CNA Staff Info 70 total: 69 full-time employees and 1 contractor. 70
Average shift length Info Average shift length. Calculated as total hours divided by days worked and average staff per day. 7.7 hours

Contractor staffing

Q4 2025 · Oct 1 – Dec 31 More info This data comes from the CMS Payroll-Based Journal report covering October 1 – December 31, 2025.

Total hours from contractors

2.1%

811 contractor hours this quarter

Feeding Assistant: 10 Licensed Practical Nurse: 6 Registered Nurse: 4 Other Physician: 2 Certified Nursing Assistant: 1

Staff by category

Q4 2025 · Oct 1 – Dec 31 More info This data comes from the CMS Payroll-Based Journal report covering October 1 – December 31, 2025.
Certified Nursing Assistant6917019,21192100%7.7
Licensed Practical Nurse206266,37192100%9.4
Registered Nurse174213,63892100%9.6
Nurse Aide in Training8081,8927480%7.4
RN Director of Nursing2021,0326571%8
Other Dietary Services Staff6069528188%6.4
Respiratory Therapy Technician2029376672%7.6
Feeding Assistant010106827177%6.6
Administrator1015126470%8
Mental Health Service Worker1015126470%8
Nurse Practitioner1015046470%7.9
Clinical Nurse Specialist1015046368%8
Physical Therapy Assistant2024686672%7
Speech Language Pathologist1014666470%7.3
Physical Therapy Aide2023827076%4.3
Qualified Social Worker2022015155%3.4
Other Physician0221322%6.5
70 Certified Nursing Assistant
% of Days 100%
26 Licensed Practical Nurse
% of Days 100%
21 Registered Nurse
% of Days 100%
8 Nurse Aide in Training
% of Days 80%
2 RN Director of Nursing
% of Days 71%
6 Other Dietary Services Staff
% of Days 88%
2 Respiratory Therapy Technician
% of Days 72%
10 Feeding Assistant
% of Days 77%
1 Administrator
% of Days 70%
1 Mental Health Service Worker
% of Days 70%
1 Nurse Practitioner
% of Days 70%
1 Clinical Nurse Specialist
% of Days 68%
2 Physical Therapy Assistant
% of Days 72%
1 Speech Language Pathologist
% of Days 70%
2 Physical Therapy Aide
% of Days 76%
2 Qualified Social Worker
% of Days 55%
2 Other Physician
% of Days 2%

Penalties and fines

Federal penalties imposed by CMS for regulatory violations, including civil money penalties (fines) and denials of payment for new Medicare/Medicaid admissions.

Source: CMS Penalties Database

No penalties in the past 3 years

No civil money penalties or payment denials were reported in the last 3 years.

Quality of care over time

These measures show how residents usually do over time at this home, based on health outcomes and preventive care.

High-risk clinical events score Info A composite score based on pressure ulcers, falls with injury, weight loss, walking ability decline, and activities of daily living decline. 5.5
44% better than Illinois average

Illinois average: 9.7

Functional decline score Info A composite score based on activities of daily living decline, walking ability decline, and incontinence. 12.9
31% better than Illinois average

Illinois average: 18.6

Long-stay resident measures
Need for Help with Daily Activities Increased Info Percent of long-stay residents whose need for help with daily activities has increased 4.8%
69% better than Illinois average

Illinois average: 15.5%

Walking Ability Worsened Info Percent of long-stay residents whose ability to move independently worsened 6.0%
67% better than Illinois average

Illinois average: 18.4%

Low Risk Residents with Bowel/Bladder Incontinence Info Percent of low risk long-stay residents who lose control of their bowels or bladder 27.9%
29% worse than Illinois average

Illinois average: 21.6%

Falls with Major Injury Info Percent of long-stay residents experiencing one or more falls with major injury 3.9%
15% worse than Illinois average

Illinois average: 3.4%

High Risk Residents with Pressure Ulcers Info Percent of long-stay high risk residents with pressure ulcers 6.4%
22% worse than Illinois average

Illinois average: 5.3%

Urinary Tract Infection Info Percent of long-stay residents with a urinary tract infection 0.0%
100% better than Illinois average

Illinois average: 1.8%

Lost Too Much Weight Info Percent of long-stay residents who lose too much weight 6.2%
5% better than Illinois average

Illinois average: 6.5%

Depressive Symptoms Info Percent of long-stay residents who have depressive symptoms 99.7%
107% worse than Illinois average

Illinois average: 48.1%

Antipsychotic Use Info Percent of long-stay residents who received an antipsychotic medication 32.9%
63% worse than Illinois average

Illinois average: 20.2%

Pneumococcal Vaccine Info Percent of long-stay residents assessed and appropriately given the pneumococcal vaccine 95.2%
7% better than Illinois average

Illinois average: 89.2%

Influenza Vaccine Info Percent of long-stay residents assessed and appropriately given the seasonal influenza vaccine 98.9%
8% better than Illinois average

Illinois average: 91.6%

Short-stay resident measures
Pneumococcal Vaccine Info Percent of short-stay residents assessed and appropriately given the pneumococcal vaccine 61.6%
10% worse than Illinois average

Illinois average: 68.3%

Antipsychotic medication increase Info Percent of short-stay residents who newly received an antipsychotic medication 0.9%
60% better than Illinois average

Illinois average: 2.3%

Influenza Vaccine Info Percent of short-stay residents assessed and appropriately given the seasonal influenza vaccine 72.9%
16% better than Illinois average

Illinois average: 63.0%

Breakdown by payment type

Medicare

91% of new residents, usually for short-term rehab.

Typical stay 1 - 2 months

Private pay

1% of new residents, often for short stays.

Typical stay 42 years

Medicaid

7% of new residents, often for long-term daily care.

Typical stay 11 years

Facility Characteristics

Source: CMS Long-Term Care Facility Characteristics (Data as of Jan 2026)

Total residents 92
Medicare
8
8.7% of residents
Medicaid
72
78.3% of residents
Private pay or other
12
13% of residents
Programs & Services
Residents Group

Residents meet regularly to discuss policies, care quality, and activities

Active Resident Council

Organized group of residents that meets regularly to discuss facility policies, quality of life, and activities.

Finances and operations

Based on CMS SNF Cost Report for fiscal year ending in 12/2023.

Privately-owned community
Operated by a single business entity.
Net patient revenue Info Net patient revenue — what the home actually collects for resident care, after contractual allowances, bad debt and discounts are subtracted from its gross charges (CMS cost report, Worksheet G-3). It covers resident care only; money the home earns from other sources is shown separately as "Other income."
$10.2M
Net patient income Info Net patient income: net patient revenue minus the home's total operating expenses. A positive figure means it earns more from resident care than it spends to deliver it; a negative figure means the opposite. It excludes non-operating "other income."
-$1.4M
Privately-owned community Operated by a single business entity.
Net patient revenue Info Net patient revenue — what the home actually collects for resident care, after contractual allowances, bad debt and discounts are subtracted from its gross charges (CMS cost report, Worksheet G-3). It covers resident care only; money the home earns from other sources is shown separately as "Other income."
$10.2M Rank #77 / 171Revenue — State benchmarkedThis home is ranked 77th out of 171 homes in Illinois. Shows this facility's annual revenue compared to the Illinois average. Higher revenue generally means more resources for staffing and capital — read alongside Payroll %.Rankings are based only on facilities in Illinois that report data for that category. Facilities without available data are excluded from the ranking.Click the rank badge to see the full State ranking.Click here to see the full State ranking.
Net patient income Info Net patient income: net patient revenue minus the home's total operating expenses. A positive figure means it earns more from resident care than it spends to deliver it; a negative figure means the opposite. It excludes non-operating "other income."
-$1.4M
Other income Info Money the home earns outside of resident care — such as investments, grants, rentals and other non-operating sources (CMS cost report, Worksheet G-3). It is tracked separately from net patient revenue: it is not part of that figure, and it is not included in net patient income.
$404.5K
Payroll costs Info Staff salaries plus wage-related costs — benefits such as payroll taxes, health insurance and retirement — from the home's own accounting records (CMS cost report, Worksheet A). Contract or agency labor is counted separately, under other operating costs. Rank #128 / 171Payroll — State benchmarkedThis home is ranked 128th out of 171 homes in Illinois. Shows total annual staff payroll benchmarked to the Illinois average. Higher payroll investment relative to peers often signals better staffing and less reliance on cheaper contract labor.Rankings are based only on facilities in Illinois that report data for that category. Facilities without available data are excluded from the ranking.Click the rank badge to see the full State ranking.Click here to see the full State ranking.
$5.4M 52.7% of net patient revenue Info Payroll as a share of revenue: staff salaries and wage-related benefits divided by net patient revenue. A higher figure means more of each revenue dollar goes to staff pay. Rank #151 / 171Payroll % — State benchmarkedThis home is ranked 151st out of 171 homes in Illinois. Shows payroll as a percentage of revenue versus the Illinois average. Well-run Illinois facilities typically land around 54–67% — the top third Statewide. Below 25% may signal understaffing or heavy agency use — read with Staffing ratings.Rankings are based only on facilities in Illinois that report data for that category. Facilities without available data are excluded from the ranking.Click the rank badge to see the full State ranking.Click here to see the full State ranking.
Other operating costs Info Everything it costs to run the home apart from payroll — food, utilities, supplies, maintenance, contract labor and administration. Calculated as total operating expense minus payroll (staff salaries and wage-related benefits).
$6.3M
Total costs Info The home's total operating expense for the year — all the costs of running it, salaries included (CMS cost report, Worksheet G-3).
$11.6M

What does this home offer?

Housing options icon

Housing Options: Private/Semi-Private Rooms

Building type icon
Building type icon

Building Type: 2-story

On-site medical care and health services icon

On-site Medical Care and Health Services

Rehabilitative support icon

Rehabilitative Support

Social and recreational activities icon

Social and Recreational Activities

Who this home usually serves

TYPE OF STAY

Mostly short-term rehab stays

Most residents typically stay for a few weeks or months before returning home or moving on.

Most new residents arrive under Medicare (91% of admissions), and a typical Medicare stay runs around 1 - 2 months.

Admissions
67 total

Coverage residents most often arrive under.

Medicare 91%
Private pay 1%
Medicaid 7%
Discharges
66 total

Coverage residents most often leave under.

Medicare 77%
Private pay 2%
Medicaid 21%

Places of interest near BRIA of Geneva

Address 2.5 miles from city center Info Estimated distance in miles from Geneva's city center to BRIA of Geneva's address, calculated via Google Maps.

Calculate Travel Distance to BRIA of Geneva

Add your location

Address

Compare Nursing Homes around St Charles

The information below is reported by the Illinois Department of Public Health, Office of Health Care Regulation.

3 facilities compared · CMS & IL Dept. of Health data

BRIA of Geneva
NH
MC
Geneva
107
Facility 107
IL AVG 86
Rank #111 / 426
83.3%
Facility 83.3%
IL AVG 69.3%
Rank #68 / 204
+20%
3.40
Facility 3.40
IL AVG 3.10
Rank #57 / 172
-6%+9%
$0
Facility $0
IL AVG $151.3k
Rank #1 / 173
36
Facility 36
IL AVG 36.8
Rank #102 / 172
3.0
Facility 3.0
IL AVG 3.7
Rank #45 / 172
195-
61
Facility 61
IL AVG 51
Rank #223 / 648
-
$10.2M
Facility $10.2M
IL AVG $12.2M
Rank #77 / 171
$5.4M
Facility $5.4M
IL AVG $4.8M
Rank #128 / 171
52.7%
Facility 52.7%
IL AVG 44.3%
Rank #151 / 171
146067
The Grove St. Charles
NH
St. Charles
120
Facility 120
IL AVG 86
Rank #80 / 426
71.3%
Facility 71.3%
IL AVG 69.3%
Rank #117 / 204
+3%
2.65
Facility 2.65
IL AVG 3.10
Rank #103 / 172
+80%-14%
$0
Facility $0
IL AVG $151.3k
Rank #1 / 173
32
Facility 32
IL AVG 36.8
Rank #91 / 172
4.6
Facility 4.6
IL AVG 3.7
Rank #140 / 172
185-
24
Facility 24
IL AVG 51
Rank #535 / 648
Jaclyn Kepka
$9.7M
Facility $9.7M
IL AVG $12.2M
Rank #85 / 171
$3.7M
Facility $3.7M
IL AVG $4.8M
Rank #115 / 171
38.5%
Facility 38.5%
IL AVG 44.3%
Rank #124 / 171
145433
The Pearl of St Charles
NH
MC
RC
St. Charles
109
Facility 109
IL AVG 86
Rank #108 / 426
84.5%
Facility 84.5%
IL AVG 69.3%
Rank #61 / 204
+22%
3.26
Facility 3.26
IL AVG 3.10
Rank #61 / 172
+2%+5%
$39.8k
Facility $39.8k
IL AVG $151.3k
Rank #103 / 173
57
Facility 57
IL AVG 36.8
Rank #141 / 172
4.1
Facility 4.1
IL AVG 3.7
Rank #122 / 172
590-
58
Facility 58
IL AVG 51
Rank #253 / 648
Phc St Charles Holdings LLC
$4.3M
Facility $4.3M
IL AVG $12.2M
Rank #99 / 171
$2.3M
Facility $2.3M
IL AVG $4.8M
Rank #78 / 171
54.5%
Facility 54.5%
IL AVG 44.3%
Rank #46 / 171
145980

Financial Assistance for
Nursing Home in Illinois

BRIA of Geneva is located in Geneva, Illinois.
Here are the financial assistance programs available to residents in Illinois.

Get Financial aid guidance

Community Care Program

Illinois CCP

Age 60+
General Illinois resident, at risk of nursing home placement.
Income Limits (2025) ~$1,215/month individual
Asset Limits $17,500 individual, excludes home, car
IL

High demand in urban areas; waitlists possible.

Benefits
In-home care (3-5 hours/day) Adult day services ($65/day) Emergency home response systems ($30/month)

Illinois Respite Program

IL Respite (via NFCSP)

Age Caregiver of someone 60+ (or with dementia)
General Illinois resident.
Income Limits No strict limit; prioritizes low-income.
Asset Limits Not applicable.
IL

Limited slots; urban/rural balance.

Benefits
In-home respite (4-6 hours/day) Adult day care (~$65/day) Short-term facility care (up to 5 days)

Supportive Living Program (SLP)

Illinois Medicaid Supportive Living Program

Age 65+ or 22-64 with disability
General Illinois resident, Medicaid-eligible, needs moderate assistance (not nursing home-level).
Income Limits (2025) ~$2,829/month (300% FBR, individual); QIT allowed.
Asset Limits $2,000 (individual), $3,000 (couple) (excludes home, car).
IL

~200 SLP sites statewide; room/board not covered.

Benefits
Personal care (5-7 hours/day, e.g., bathing, mobility) Meals Housekeeping Medication management Respite (~240 hours/year)

Persons Who Are Elderly Waiver

Illinois Medicaid Elderly Waiver

Age 65+
General Illinois resident, Medicaid-eligible, nursing home-level care need.
Income Limits (2025) ~$2,829/month 300% FBR, individual
Asset Limits $2,000 (individual), $3,000 (couple).
IL

Part of HealthChoice Illinois; consumer-directed options available.

Benefits
Personal care (5-7 hours/day, e.g., dressing, eating) Homemaker Adult day care (~$60/day) Respite (240 hours/year) Home mods ($1,000 avg.)

Medicare Savings Program (MSP)

Illinois Medicare Savings Program

Age 65+ or disabled
General Illinois resident, Medicare Part A/B.
Income Limits (2025) ~$2,510/month (QMB), ~$3,380/month (SLMB), ~$3,598/month (QI)—individual.
Asset Limits $9,430 (individual), $14,130 (couple).
IL

Three tiers; no waitlist.

Benefits
Covers Part B premiums ($174.70/month) Deductibles ($240/year) Copays (~20%)

Optional State Supplementation (OSS)

Illinois Optional State Supplementation

Age 65+ or disabled
General Illinois resident, in approved facility, SSI recipient or low-income.
Income Limits (2025) ~$1,004/month including SSI
Asset Limits $2,000 (individual), $3,000 (couple).
IL

~$50-$500/month based on facility type.

Benefits
Cash (~$50-$500/month) for room/board in personal care homes or SLFs

VA Aid and Attendance (A&A) and Housebound Benefits

Illinois VA Aid and Attendance/Housebound

Age 65+ or disabled veteran/spouse
General Illinois resident, wartime service, need for ADL help (A&A) or homebound.
Income Limits (2025) Net income < ~$1,984/month (veteran with dependent, A&A); pension offsets income.
Asset Limits ~$155,356 net worth limit
IL

High veteran demand in urban/rural areas.

Benefits
Cash (~$1,433-$2,642/month veteran, ~$951-$1,318 spouse) for care costs (e.g., in-home, assisted living)

Frequently Asked Questions about BRIA of Geneva

Is BRIA of Geneva in a walkable area?

BRIA of Geneva has a walk score of 61. Moderately walkable. Some errands can be accomplished on foot, with a mix of nearby amenities.

What is the occupancy rate at BRIA of Geneva?

BRIA of Geneva's occupancy is 83.3%.

Are there photos of BRIA of Geneva?

Yes — there are 7 photos of BRIA of Geneva in the photo gallery on this page.

What is the address of BRIA of Geneva?

BRIA of Geneva is located at 1101 E State St, Geneva, IL 60134.

What is the phone number of BRIA of Geneva?

(630) 232-7544 will put you in contact with the team at BRIA of Geneva.

Is BRIA of Geneva Medicare or Medicaid certified?

Yes — BRIA of Geneva is a CMS-certified provider of Medicare and Medicaid.

Guides for Better Senior Living

Care Cost Calculator: See Prices in Your Area

Nursing Home Data Explorer

Don’t Wait Too Long: 7 Red Flag Signs Your Parent Needs Assisted Living Now

The True Cost of Assisted Living in 2025 – And How Families Are Paying For It

Understanding Senior Living Costs: Pricing Models, Discounts & Financial Assistance