The Pearl of St Charles
Nursing Home & Respite Care · St. Charles, IL
CMS overall rating Info The Overall CMS Rating is scored from 1 to 5 stars and combines results from health inspections, staffing levels, and quality measures. Health inspections carry the most weight. Staffing and quality scores can increase or decrease the final rating based on performance compared to state and national standards.

The Pearl of St Charles

Nursing Home & Respite Care · St. Charles, IL
CMS overall rating Info The Overall CMS Rating is scored from 1 to 5 stars and combines results from health inspections, staffing levels, and quality measures. Health inspections carry the most weight. Staffing and quality scores can increase or decrease the final rating based on performance compared to state and national standards.
Calculator: See prices in your area
The Pearl of St Charles accepts Medicare, Medicaid, and private pay.

Overview of The Pearl of St Charles

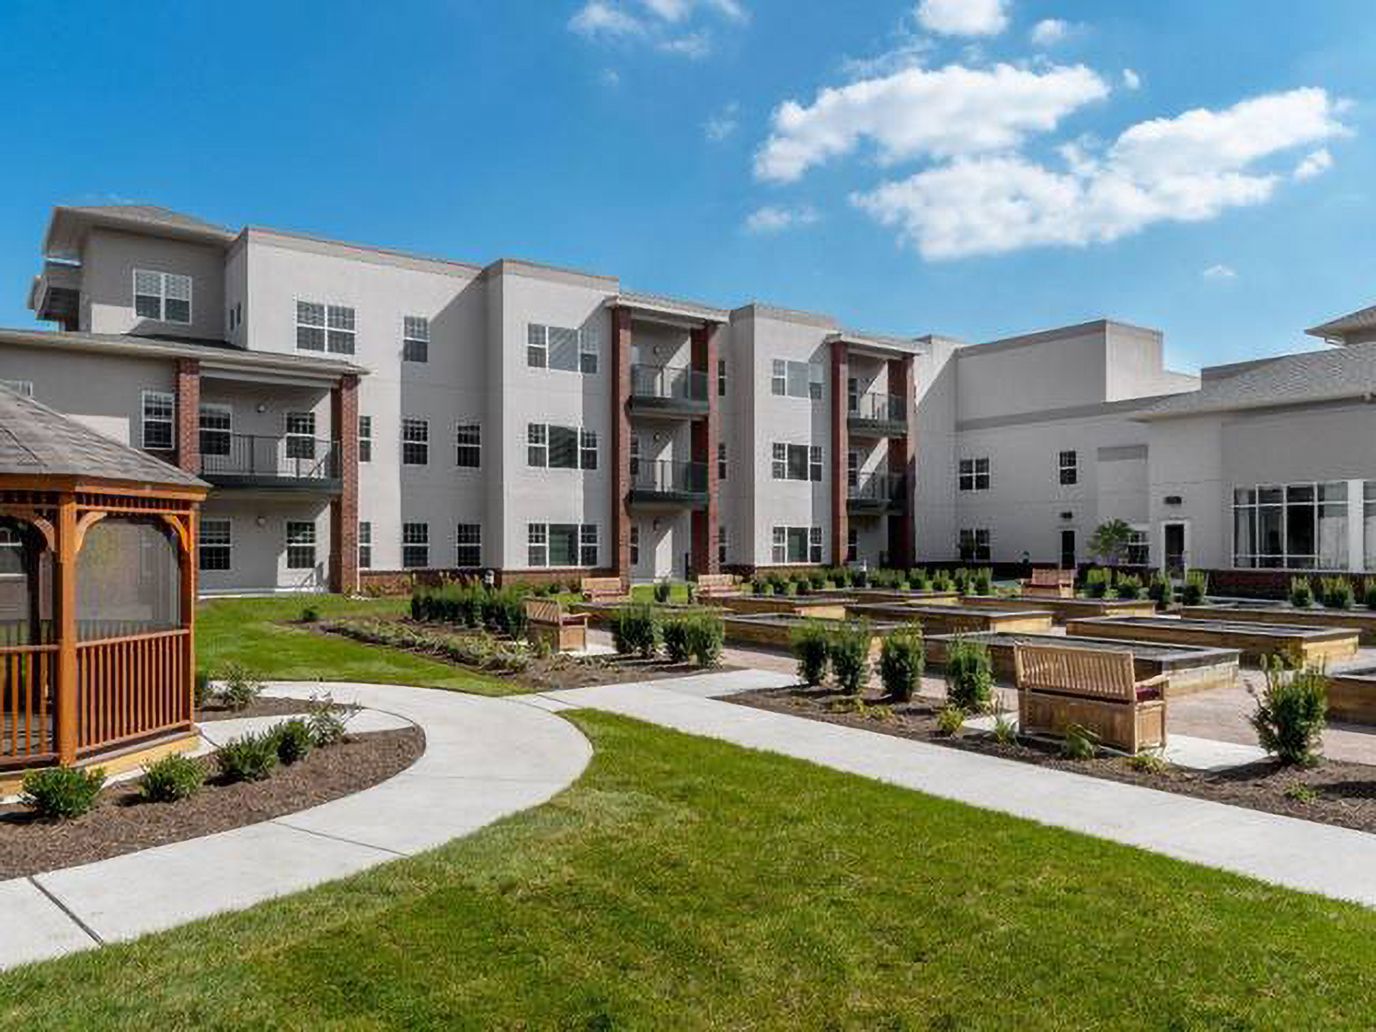
The Pearl of St. Charles is a highly rated nursing home in St. Charles, IL, offering long-term care, post-hospital care, respite care, and rehabilitation. The community also promotes a warm and welcoming environment, ensuring older adults are well-cared for during their stay. With 24-hour care, restaurant-style dining, housekeeping, and laundry, residents can maintain their independence with ease. Through individualized care plans, residents receive the best possible care tailored to their unique needs and habits.

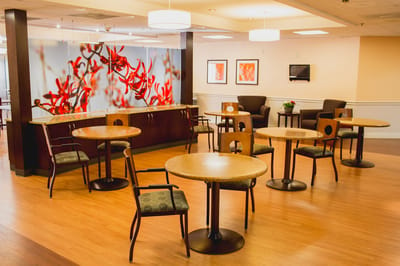
Social events, exercises, and various recreational opportunities ensure residents can freely interact with friends and have fun. With upscale rehabilitation equipment and lively gathering areas, residents can focus on their recovery and relaxation. Located near Norris Cultural Arts Center, healthcare providers, shops, and restaurants in St. Charles, the community is easily accessible for families and visitors. This nursing home is a great choice for senior living in Illinois, especially with its exceptional standards of care.

Quality ratings

Measured by Centers for Medicare & Medicaid Services (CMS)

Overall rating Info The Overall CMS Rating combines results from health inspections, staffing levels and quality measures. Health inspections carry the most weight. Staffing and quality scores can increase or decrease the final rating based on performance compared to state and national standards.
▼ 20.6% Below IL avg.
Health Inspection Info Based on the results of the facility's three most recent standard inspections and any complaint investigations. CMS reviews the number, scope, and severity of deficiencies, with more recent findings weighted more heavily.
▼ 28.0% Below IL avg.
Staffing Info Measures average nursing staff hours per resident per day, including Registered Nurses (RNs) and total nursing staff. Ratings are adjusted based on the level of care residents require and are compared to state and national benchmarks.
▼ 6.4% Below IL avg.
Quality Measures Info Based on clinical and physical health indicators reported to CMS, such as hospital readmissions, falls, pressure ulcers, and improvements in mobility. These measures reflect how well residents' health needs are being managed.
▲ 6.6% Above IL avg.

Staffing hours breakdown

Info Daily nursing hours per resident by staff type, reported to CMS. Higher is generally better — compare this facility to state and national averages to see where staffing stands.

Hours per resident per day — compared to Illinois state averages

Total nursing care / resident Info Total adjusted nursing hours per resident per day, combining RN, LPN, and aide time. CMS adjusts this for case-mix so facilities can be fairly compared.
3h 16m per day
This facility Illinois avg (3h 6m per day)
vs Illinois avg
+5%
Staff typeHours / dayvs state avg
Total Nursing (Weekend) Info Combined nursing hours (RN + LPN + Nurse Aide) per resident per day on weekends. Staffing often drops on weekends — this figure reveals whether the facility maintains adequate coverage outside of weekday hours. 2h 59m per day

Capacity and availability

This home usually has availability

Occupancy lower than 85% suggests more openings may be available.

Higher occupancy than the Illinois average: 69.3%
Occupancy rate 84.5%
Avg. Length of Stay 129 days
Occupancy rate
84.5%
Avg. Length of Stay
129 days

Who this home usually serves

TYPE OF STAY

Mostly short-term rehab stays

Most residents typically stay for a few weeks or months before returning home or moving on.

Breakdown by payment type

Medicare

45% of new residents, usually for short-term rehab.

Typical stay 1 months

Private pay

35% of new residents, often for short stays.

Typical stay 3 - 4 months

Medicaid

20% of new residents, often for long-term daily care.

Typical stay 1 years

Finances and operations

Voluntary non-profit community
Home revenue
$13.3M
Operating deficit
-$688.8K
Voluntary non-profit community
Home revenue
$13.3M
Operating deficit
-$688.8K
Payroll costs Info The portion of the home's budget spent on staff, including nurses, caregivers, and other employees who support care and operations.
$7.6M
57.2% of revenue
Other operating costs Info All remaining costs needed to run the home, such as food, utilities, building maintenance, supplies and administrative expenses.
-$1.7M
Total costs $5.9M
Walk Score
Walk Score: 58 / 100
Moderately walkable. Some errands can be accomplished on foot, with a mix of nearby amenities.

What does this home offer?

Building type icon
Building type icon

Building Type: Single-story

On-site medical care and health services icon

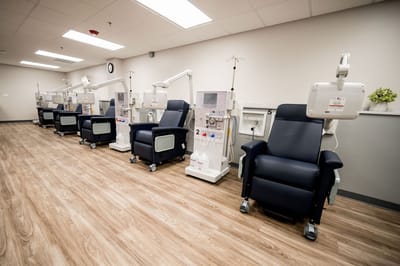
On-site Medical Care and Health Services

Rehabilitative support icon

Rehabilitative Support

Types of Care at The Pearl of St Charles

Nursing Home Respite Care

Contact The Pearl of St Charles

Health Inspection History

Inspections
Total health inspections 14

Illinois average 10.4


Last Health inspection on Feb 2025

Total health citations
57

Illinois average 36.8

Citations per inspection
4.07

Illinois average 3.68


Health citations are formal notices following inspections when they fail to comply with safety and care standards.

33 of 57 citations resulted from standard inspections; and 24 of 57 resulted from complaint investigations.

Breakdown of citation severity (last 3 years)
Critical Health citations More info
1
43% worse than Illinois average

Illinois average: 0.7


Serious Health citations More info 4
11% worse than Illinois average

Illinois average: 3.6

1 critical citation More info Illinois average: 0.7

4 serious citations More info Illinois average: 3.6

52 moderate citations More info Illinois average: 32

0 minor citations More info Illinois average: 0.5
Citations history (last 3 years)
Infection Control moderate citation Info Issues related to preventing and controlling infections, including hygiene practices and safety protocols. Feb 27, 2025
Corrected

Infection Control moderate citation Info Issues related to preventing and controlling infections, including hygiene practices and safety protocols. Feb 27, 2025
Corrected

Infection Control moderate citation Info Issues related to preventing and controlling infections, including hygiene practices and safety protocols. Feb 27, 2025
Corrected

Nutrition moderate citation Info Issues related to food quality, meal service, and resident's nutritional needs. Feb 27, 2025
Corrected

Financial Assistance for
Nursing Home in Illinois

The Pearl of St Charles is located in St. Charles, Illinois.
Here are the financial assistance programs available to residents in Illinois.

Get Financial aid guidance

Community Care Program

Illinois CCP

Age 60+
General Illinois resident, at risk of nursing home placement.
Income Limits (2025) ~$1,215/month individual
Asset Limits $17,500 individual, excludes home, car
IL

High demand in urban areas; waitlists possible.

Benefits
In-home care (3-5 hours/day) Adult day services ($65/day) Emergency home response systems ($30/month)

Illinois Respite Program

IL Respite (via NFCSP)

Age Caregiver of someone 60+ (or with dementia)
General Illinois resident.
Income Limits No strict limit; prioritizes low-income.
Asset Limits Not applicable.
IL

Limited slots; urban/rural balance.

Benefits
In-home respite (4-6 hours/day) Adult day care (~$65/day) Short-term facility care (up to 5 days)

Supportive Living Program (SLP)

Illinois Medicaid Supportive Living Program

Age 65+ or 22-64 with disability
General Illinois resident, Medicaid-eligible, needs moderate assistance (not nursing home-level).
Income Limits (2025) ~$2,829/month (300% FBR, individual); QIT allowed.
Asset Limits $2,000 (individual), $3,000 (couple) (excludes home, car).
IL

~200 SLP sites statewide; room/board not covered.

Benefits
Personal care (5-7 hours/day, e.g., bathing, mobility) Meals Housekeeping Medication management Respite (~240 hours/year)

Persons Who Are Elderly Waiver

Illinois Medicaid Elderly Waiver

Age 65+
General Illinois resident, Medicaid-eligible, nursing home-level care need.
Income Limits (2025) ~$2,829/month 300% FBR, individual
Asset Limits $2,000 (individual), $3,000 (couple).
IL

Part of HealthChoice Illinois; consumer-directed options available.

Benefits
Personal care (5-7 hours/day, e.g., dressing, eating) Homemaker Adult day care (~$60/day) Respite (240 hours/year) Home mods ($1,000 avg.)

Medicare Savings Program (MSP)

Illinois Medicare Savings Program

Age 65+ or disabled
General Illinois resident, Medicare Part A/B.
Income Limits (2025) ~$2,510/month (QMB), ~$3,380/month (SLMB), ~$3,598/month (QI)—individual.
Asset Limits $9,430 (individual), $14,130 (couple).
IL

Three tiers; no waitlist.

Benefits
Covers Part B premiums ($174.70/month) Deductibles ($240/year) Copays (~20%)

Optional State Supplementation (OSS)

Illinois Optional State Supplementation

Age 65+ or disabled
General Illinois resident, in approved facility, SSI recipient or low-income.
Income Limits (2025) ~$1,004/month including SSI
Asset Limits $2,000 (individual), $3,000 (couple).
IL

~$50-$500/month based on facility type.

Benefits
Cash (~$50-$500/month) for room/board in personal care homes or SLFs

VA Aid and Attendance (A&A) and Housebound Benefits

Illinois VA Aid and Attendance/Housebound

Age 65+ or disabled veteran/spouse
General Illinois resident, wartime service, need for ADL help (A&A) or homebound.
Income Limits (2025) Net income < ~$1,984/month (veteran with dependent, A&A); pension offsets income.
Asset Limits ~$155,356 net worth limit
IL

High veteran demand in urban/rural areas.

Benefits
Cash (~$1,433-$2,642/month veteran, ~$951-$1,318 spouse) for care costs (e.g., in-home, assisted living)

Places of interest near The Pearl of St Charles

Address 1.7 miles from city center Info Estimated distance in miles from St. Charles's city center to The Pearl of St Charles's address, calculated via Google Maps.

Calculate Travel Distance to The Pearl of St Charles

Add your location

Address

Staffing Data (Q2 2025)

This data corresponds to Q2 2025 and is based on CMS Payroll-Based Journal.

Total staff 266
Employees 95
Contractors 171
Staff to resident ratio 3.50:1
84% better than Illinois average

Illinois average ratio: 1.90:1

Avg staff/day 40
Average shift 7.4 hours
0% compared with Illinois average

Illinois average: 7.6 hours

Total staff hours (quarter) 26,907

Nursing staff breakdown

Registered Nurse

Manages medical care and health needs.

Total count 51
Average shift length Info Average shift length. Calculated as total hours divided by days worked and average staff per day. 8.9 hours

This role is partially covered by contractors.

Licensed Practical Nurse

Assists with medical care and medications.

Total count 49
Average shift length Info Average shift length. Calculated as total hours divided by days worked and average staff per day. 8.2 hours

This role is partially covered by contractors.

Certified Nursing Assistant

Helps with daily care and mobility.

Total count 117
Average shift length Info Average shift length. Calculated as total hours divided by days worked and average staff per day. 6.9 hours

This role is partially covered by contractors.

Contractor staffing

Total hours from contractors

19.2%

5,160 contractor hours this quarter

Certified Nursing Assistant: 58 Licensed Practical Nurse: 38 Registered Nurse: 37 Physical Therapy Assistant: 12 Physical Therapy Aide: 7 Respiratory Therapy Technician: 7 Speech Language Pathologist: 4 Qualified Social Worker: 4 Clinical Nurse Specialist: 2 Nurse Practitioner: 1 Occupational Therapy Aide: 1

Staff by category

Certified Nursing Assistant595811713,10091100%6.9
Registered Nurse1437514,53291100%8.9
Licensed Practical Nurse1138494,29791100%8.2
Clinical Nurse Specialist1236086470%7.5
Nurse Practitioner1125526066%7.5
Physical Therapy Assistant012125026571%5.9
Dietitian1014736369%7.5
Speech Language Pathologist0444426470%6.7
Physical Therapy Aide0774406369%5.6
Mental Health Service Worker3034056774%6
Administrator1013454651%7.5
RN Director of Nursing2023424549%7.6
Respiratory Therapy Technician0772875358%5.3
Qualified Activities Professional1012633538%7.5
Qualified Social Worker0442343741%6.3
Occupational Therapy Aide011852123%4
Other Dietary Services Staff101311%3.2
117 Certified Nursing Assistant
% of Days 100%
51 Registered Nurse
% of Days 100%
49 Licensed Practical Nurse
% of Days 100%
3 Clinical Nurse Specialist
% of Days 70%
2 Nurse Practitioner
% of Days 66%
12 Physical Therapy Assistant
% of Days 71%
1 Dietitian
% of Days 69%
4 Speech Language Pathologist
% of Days 70%
7 Physical Therapy Aide
% of Days 69%
3 Mental Health Service Worker
% of Days 74%
1 Administrator
% of Days 51%
2 RN Director of Nursing
% of Days 49%
7 Respiratory Therapy Technician
% of Days 58%
1 Qualified Activities Professional
% of Days 38%
4 Qualified Social Worker
% of Days 41%
1 Occupational Therapy Aide
% of Days 23%
1 Other Dietary Services Staff
% of Days 1%

Facility Characteristics

Source: CMS Long-Term Care Facility Characteristics (Data as of Jan 2026)

Total residents 76
Medicare
10
13.2% of residents
Medicaid
66
86.8% of residents
Programs & Services
Residents Group

Residents meet regularly to discuss policies, care quality, and activities

Active Resident Council

Organized group of residents that meets regularly to discuss facility policies, quality of life, and activities.

Quality of care over time

These measures show how residents usually do over time at this home, based on health outcomes and preventive care.

High-risk clinical events score Info A composite score based on pressure ulcers, falls with injury, weight loss, walking ability decline, and activities of daily living decline. 7.9
19% better than Illinois average

Illinois average: 9.7

Functional decline score Info A composite score based on activities of daily living decline, walking ability decline, and incontinence. 13.4
28% better than Illinois average

Illinois average: 18.6

Long-stay resident measures
Need for Help with Daily Activities Increased Info Percent of long-stay residents whose need for help with daily activities has increased 14.1%
9% better than Illinois average

Illinois average: 15.5%

Walking Ability Worsened Info Percent of long-stay residents whose ability to move independently worsened 15.3%
17% better than Illinois average

Illinois average: 18.4%

Low Risk Residents with Bowel/Bladder Incontinence Info Percent of low risk long-stay residents who lose control of their bowels or bladder 10.7%
50% better than Illinois average

Illinois average: 21.6%

Falls with Major Injury Info Percent of long-stay residents experiencing one or more falls with major injury 3.8%
12% worse than Illinois average

Illinois average: 3.4%

High Risk Residents with Pressure Ulcers Info Percent of long-stay high risk residents with pressure ulcers 6.3%
19% worse than Illinois average

Illinois average: 5.3%

Urinary Tract Infection Info Percent of long-stay residents with a urinary tract infection 0.0%
100% better than Illinois average

Illinois average: 1.8%

Lost Too Much Weight Info Percent of long-stay residents who lose too much weight 0.0%
100% better than Illinois average

Illinois average: 6.5%

Depressive Symptoms Info Percent of long-stay residents who have depressive symptoms 96.3%
100% worse than Illinois average

Illinois average: 48.1%

Antipsychotic Use Info Percent of long-stay residents who received an antipsychotic medication 15.7%
22% better than Illinois average

Illinois average: 20.2%

Pneumococcal Vaccine Info Percent of long-stay residents assessed and appropriately given the pneumococcal vaccine 100.0%
12% better than Illinois average

Illinois average: 89.2%

Influenza Vaccine Info Percent of long-stay residents assessed and appropriately given the seasonal influenza vaccine 100.0%
9% better than Illinois average

Illinois average: 91.6%

Short-stay resident measures
Pneumococcal Vaccine Info Percent of short-stay residents assessed and appropriately given the pneumococcal vaccine 99.8%
46% better than Illinois average

Illinois average: 68.3%

Antipsychotic medication increase Info Percent of short-stay residents who newly received an antipsychotic medication 1.5%
36% better than Illinois average

Illinois average: 2.3%

Influenza Vaccine Info Percent of short-stay residents assessed and appropriately given the seasonal influenza vaccine 100.0%
59% better than Illinois average

Illinois average: 63.0%

Penalties and fines

Federal penalties imposed by CMS for regulatory violations, including civil money penalties (fines) and denials of payment for new Medicare/Medicaid admissions.

Source: CMS Penalties Database (Data as of Jan 2026)

Total fines amount $71K
50% lower than Illinois average

Illinois average: $143K

Number of fines 4
35% more fines than Illinois average

Illinois average: 3.0

Payment Denials Info Serious action where Medicare and/or Medicaid temporarily stops payments for new residents until issues are fixed. 0
100% fewer payment denials than Illinois average

Illinois average: 1.1

Fines amount comparison
This facility $71K
Illinois average $143K
Penalty History

Penalties are imposed by CMS for violations of federal nursing home regulations.

3 penalties in the past 3 years

Multiple penalties were reported in the last 3 years.

Civil Money Penalty Info Fines imposed for noncompliance, which can be assessed per day or per instance of violation. Dec 13, 2024
$16K
Civil Money Penalty Info Fines imposed for noncompliance, which can be assessed per day or per instance of violation. Aug 28, 2024
$16K
Civil Money Penalty Info Fines imposed for noncompliance, which can be assessed per day or per instance of violation. Nov 1, 2023
$14K

Last updated: Jan 2026

Guides for Better Senior Living

Care Cost Calculator: See Prices in Your Area

Nursing Home Data Explorer

Don’t Wait Too Long: 7 Red Flag Signs Your Parent Needs Assisted Living Now

The True Cost of Assisted Living in 2025 – And How Families Are Paying For It

Understanding Senior Living Costs: Pricing Models, Discounts & Financial Assistance

Frequently Asked Questions about The Pearl of St Charles

Is The Pearl of St Charles in a walkable area?

The Pearl of St Charles has a walk score of 58. Moderately walkable. Some errands can be accomplished on foot, with a mix of nearby amenities.

What is the best email address for The Pearl of St Charles?

The team at The Pearl of St Charles can be reached at [email protected].

What is the address of The Pearl of St Charles?

The Pearl of St Charles is located at 850 Dunham Rd, St. Charles, IL 60174.

What is the phone number of The Pearl of St Charles?

(630) 443-6146 will put you in contact with the team at The Pearl of St Charles.

Is The Pearl of St Charles Medicare or Medicaid certified?

Yes — The Pearl of St Charles is a CMS-certified provider of Medicare and Medicaid.

Explore Open Rooms
1 Contact details
2 What type of senior care service are you looking for?
3 What budget do you have in mind for senior care?
4 How soon do you need to find care?
5 Additional details

Thank you for your interest!

Our team will be in touch shortly to help with next steps.