


Total staff
193
Employees
172
Contractors
21
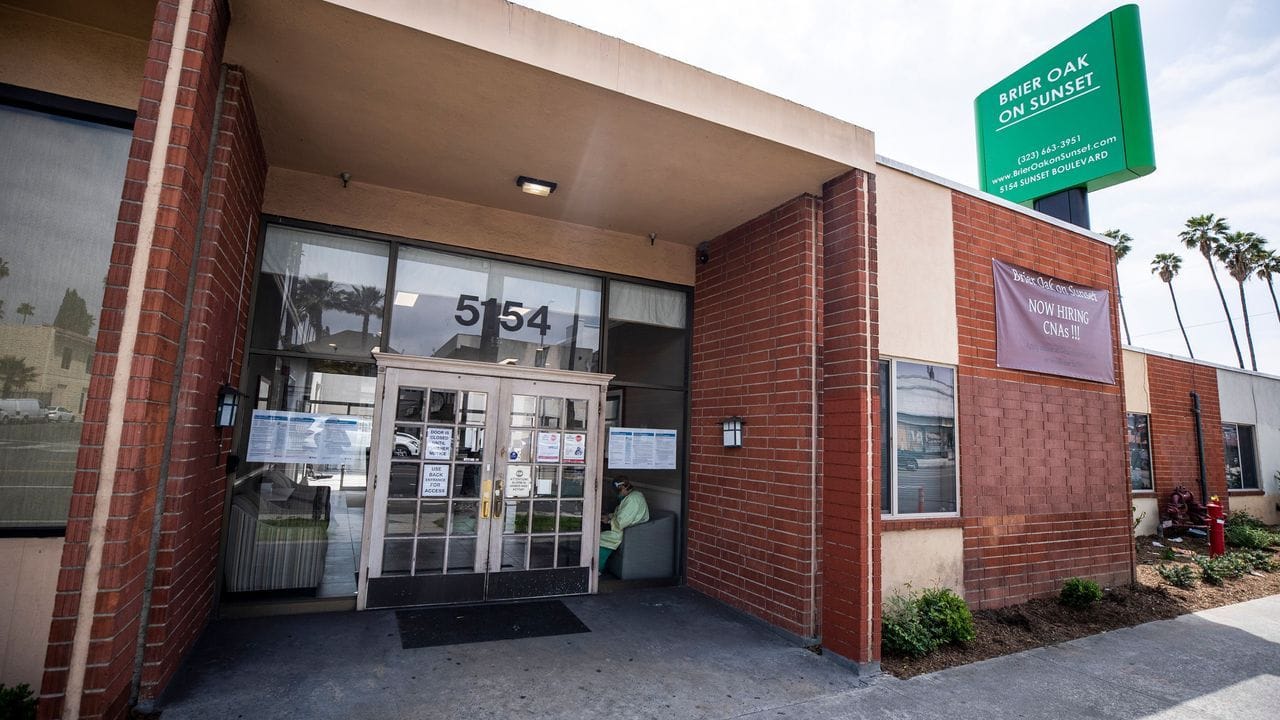
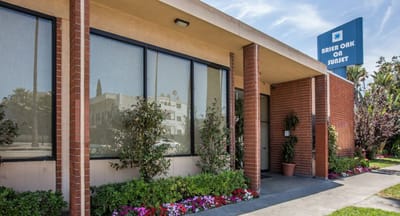
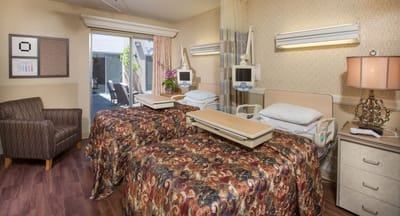
Situated on the renowned Sunset Boulevard, Brier Oak on Sunset is recognized for its expertise in offering both short-term and long-term care to its patients. It recently underwent a complete renovation, resulting in an interior that is cozy and welcoming, providing patients with a homely atmosphere. Their staff is committed to utilizing the most effective methods to accelerate the recovery of their patients. They also feature exceptional psycho-social support, and a recreation specialist is available to develop and implement meaningful programs that can benefit the patients in a multitude of ways.
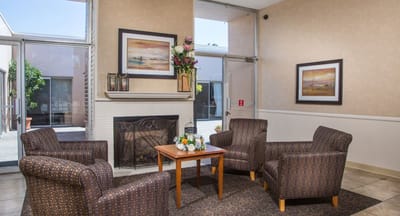
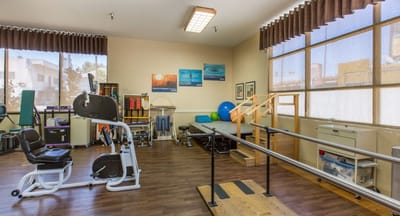
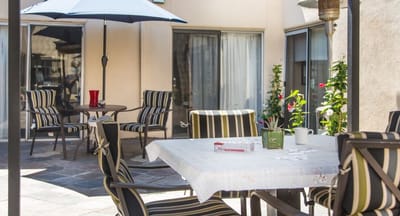
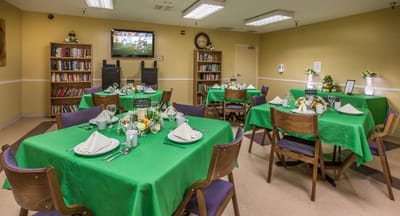
Brier Oak on Sunset offers a range of top-class amenities to ensure that the patients’ needs are met. Fully air-conditioned rooms, lounge areas, private dining rooms for family events, a garden, courtyard, salon, and barber services, housekeeping and laundry facilities, and pharmaceutical delivery services are all available on-site. At Brier Oak on Sunset, patients can expect to receive the highest level of care from the dedicated healthcare professionals on staff. They are passionate about providing an environment that promotes healing and encourages patients to engage in their recovery actively.
Staffing hours
![]() Daily nursing hours per resident by staff type, reported to CMS. Higher is generally better — compare this facility to state and national averages to see where staffing stands.
Daily nursing hours per resident by staff type, reported to CMS. Higher is generally better — compare this facility to state and national averages to see where staffing stands.
Hours per resident per day vs California averages
Total nursing care
![]() This home is ranked 151st out of 289 homes in California for nurse hours. Total adjusted nursing hours per resident per day, combining RN, LPN, and aide time. CMS adjusts this for case-mix so facilities can be fairly compared.
This home is ranked 151st out of 289 homes in California for nurse hours. Total adjusted nursing hours per resident per day, combining RN, LPN, and aide time. CMS adjusts this for case-mix so facilities can be fairly compared.
4h 3m
4% below state avgAll 6 underlying metrics fall below the state average
Reporting period: October 1 – December 31, 2025 (Q4 2025). Source: CMS Payroll-Based Journal report.
Manages medical care and health needs.
Assists with medical care and medications.
Helps with daily care and mobility.
Total hours from contractors
473 contractor hours this quarter
| Certified Nursing Assistant | 78 | 0 | 78 | 28,829 | 92 | 100% | 7.8 |
| Licensed Practical Nurse | 31 | 16 | 47 | 9,613 | 92 | 100% | 7.8 |
| Registered Nurse | 14 | 5 | 19 | 3,282 | 92 | 100% | 7.7 |
| Mental Health Service Worker | 5 | 0 | 5 | 1,638 | 80 | 87% | 7.9 |
| RN Director of Nursing | 6 | 0 | 6 | 1,527 | 65 | 71% | 8 |
| Clinical Nurse Specialist | 3 | 0 | 3 | 802 | 65 | 71% | 8.3 |
| Other Dietary Services Staff | 3 | 0 | 3 | 785 | 71 | 77% | 7.8 |
| Physical Therapy Aide | 4 | 0 | 4 | 724 | 76 | 83% | 6.8 |
| Administrator | 2 | 0 | 2 | 416 | 31 | 34% | 8 |
| Speech Language Pathologist | 4 | 0 | 4 | 395 | 60 | 65% | 5.6 |
| Occupational Therapy Aide | 1 | 0 | 1 | 275 | 53 | 58% | 5.2 |
| Dental Services Staff | 1 | 0 | 1 | 240 | 30 | 33% | 8 |
| Other Social Services Staff | 1 | 0 | 1 | 237 | 29 | 32% | 8.2 |
| Respiratory Therapy Technician | 7 | 0 | 7 | 225 | 60 | 65% | 3.6 |
| Nurse Practitioner | 1 | 0 | 1 | 216 | 27 | 29% | 8 |
| Qualified Social Worker | 5 | 0 | 5 | 179 | 52 | 57% | 3.2 |
| Physical Therapy Assistant | 6 | 0 | 6 | 131 | 42 | 46% | 2.8 |
Includes penalties issued in 2024
Federal penalties imposed by CMS for regulatory violations, including civil money penalties (fines) and denials of payment for new Medicare/Medicaid admissions.
Source: CMS Penalties Database (Data as of Jan 2026)
California average: $55K
California average: 2.4
California average: 0.5
Penalties are imposed by CMS for violations of federal nursing home regulations.
1 penalty in the past 3 years
Aug 9, 2024 · $22K
Last updated: Jan 2026
These measures show how residents usually do over time at this home, based on health outcomes and preventive care.
California average: 6.6
California average: 11.3
California average: 11.1%
California average: 12.0%
California average: 11.3%
California average: 1.7%
California average: 5.0%
California average: 1.2%
California average: 4.2%
California average: 6.7%
California average: 10.1%
California average: 98.5%
California average: 98.2%
California average: 2.25
California average: 1.59
California average: 94.0%
California average: 1.5%
California average: 93.2%
California average: 23.2%
California average: 11.2%
California average: 0.8%
California average: 50.6%
Quality measures are calculated from Minimum Data Set (MDS) assessments. For most measures, lower percentages indicate better care quality.
11% of new residents, usually for short-term rehab.
36% of new residents, often for short stays.
53% of new residents, often for long-term daily care.
Source: CMS Long-Term Care Facility Characteristics (Data as of Jan 2026)
Residents meet regularly to discuss policies, care quality, and activities
State-approved Nurse Aide Training and Competency Evaluation Program on-site
Organized group of residents that meets regularly to discuss facility policies, quality of life, and activities.
Data sourced from CMS Long-Term Care Facility Characteristics quarterly report. Payer mix reflects the current resident census by primary payment source.
Historical financial and operational data for Brier Oak on Sunset from 2011–2023, based on CMS SNF Cost Reports.
Key figures below are for fiscal year ending in 12/2023.
Based on CMS SNF Cost Report for fiscal year ending in 12/2023.
Housing Options: Private / Semi-Private Rooms
Building Type: Single-story
Most residents stay for extended periods and receive ongoing daily care.
Most new residents arrive under Medicaid (53% of admissions), and a typical Medicaid stay runs around 7 - 8 months.
Coverage residents most often arrive under.
Coverage residents most often leave under.
![]() 4.5 miles from city center
4.5 miles from city center
![]() Estimated distance in miles from Los Angeles's city center to Brier Oak on Sunset's address, calculated via Google Maps.
— 0.68 miles to nearest hospital (Hollywood Presbyterian Medical Center)
Estimated distance in miles from Los Angeles's city center to Brier Oak on Sunset's address, calculated via Google Maps.
— 0.68 miles to nearest hospital (Hollywood Presbyterian Medical Center)
Add your location
Info below is compiled from CMS reports & the CA Dept. of Social Services (CDSS), senior community websites & trusted data sources such as Walk Score & BBB.
Communities are listed from highest to lowest based on our ranking methodology.
| Angels Nursing Center | NH SNF | Los Angeles (Westlake) | 41
Facility
41
CA AVG
104
Rank
#1196 / 1646 |
90.2%
Facility
90.2%
CA AVG
73.9
Rank
#338 / 1492 | +22% | 4.73
Facility
4.73
CA AVG
4.22
Rank
#53 / 289 | -54% | +12% | $71.6k
Facility
$71.6k
CA AVG
$56.5k
Rank
#267 / 294 | 60
Facility
60
CA AVG
81
Rank
#1332 / 1475 | 42
Facility
42
CA AVG
50.2
Rank
#151 / 291 | 3.8
Facility
3.8
CA AVG
4.6
Rank
#129 / 291 | 4 | 37 | A+ |
92
Facility
92
CA AVG
59
Rank
#137 / 2058 | Aret Akian | $5.8MFiscal year ending 12/2023
Facility
$5.8MFiscal year ending 12/2023
CA AVG
$15.7M
Rank
#251 / 260 | $3.8MFiscal year ending 12/2023
Facility
$3.8MFiscal year ending 12/2023
CA AVG
$8.9M
Rank
#246 / 260 | 65.6%Fiscal year ending 12/2023
Facility
65.6%Fiscal year ending 12/2023
CA AVG
61.1%
Rank
#44 / 260 | 55704 | ||||
| Palazzo Post Acute | NH SNF | Los Angeles (East Hollywood) | 99
Facility
99
CA AVG
104
Rank
#725 / 1646 |
94.0%
Facility
94.0%
CA AVG
73.9
Rank
#237 / 1492 | +27% | 4.46
Facility
4.46
CA AVG
4.22
Rank
#73 / 289 | -25% | +6% | $0
Facility
$0
CA AVG
$56.5k
Rank
#1 / 294 | 62
Facility
62
CA AVG
81
Rank
#1297 / 1475 | 47
Facility
47
CA AVG
50.2
Rank
#173 / 291 | 2.5
Facility
2.5
CA AVG
4.6
Rank
#29 / 291 | 1 | 93 | A+ |
91
Facility
91
CA AVG
59
Rank
#155 / 2058 | Serrano Licensee 1 LLC | $13.0MFiscal year ending 12/2023
Facility
$13.0MFiscal year ending 12/2023
CA AVG
$15.7M
Rank
#147 / 260 | $8.5MFiscal year ending 12/2023
Facility
$8.5MFiscal year ending 12/2023
CA AVG
$8.9M
Rank
#125 / 260 | 65.1%Fiscal year ending 12/2023
Facility
65.1%Fiscal year ending 12/2023
CA AVG
61.1%
Rank
#46 / 260 | 56456 | ||||
| Hollenbeck Palms | NH AL IL MC SNF | Los Angeles (Central La) | 185
Facility
185
CA AVG
104
Rank
#196 / 1646 |
85.4%
Facility
85.4%
CA AVG
73.9
Rank
#443 / 1492 | +16% | 4.84
Facility
4.84
CA AVG
4.22
Rank
#44 / 289 | -11% | +15% | $0
Facility
$0
CA AVG
$56.5k
Rank
#1 / 294 | 89
Facility
89
CA AVG
81
Rank
#521 / 1475 | 39
Facility
39
CA AVG
50.2
Rank
#137 / 291 | 6.5
Facility
6.5
CA AVG
4.6
Rank
#256 / 291 | 1 | 158 | - | 62 | Casey Adams | $21.4MFiscal year ending 06/2024
Facility
$21.4MFiscal year ending 06/2024
CA AVG
$15.7M
Rank
#55 / 260 | $15.8MFiscal year ending 06/2024
Facility
$15.8MFiscal year ending 06/2024
CA AVG
$8.9M
Rank
#21 / 260 | 73.6%Fiscal year ending 06/2024
Facility
73.6%Fiscal year ending 06/2024
CA AVG
61.1%
Rank
#25 / 260 | 55115 | ||||
| Fountainview at Eisenberg Village | NH AL IL SNF | Reseda | 216
Facility
216
CA AVG
104
Rank
#127 / 1646 |
48.1%
Facility
48.1%
CA AVG
73.9
Rank
#1350 / 1492 | -35% | 2.96
Facility
2.96
CA AVG
4.22
Rank
#287 / 289 | +1% | -30% | $0
Facility
$0
CA AVG
$56.5k
Rank
#1 / 294 | 89
Facility
89
CA AVG
81
Rank
#521 / 1475 | 66
Facility
66
CA AVG
50.2
Rank
#236 / 291 | 3.9
Facility
3.9
CA AVG
4.6
Rank
#136 / 291 | - | 104 | - | 49 | Karen Pham | $16.7MFiscal year ending 12/2023
Facility
$16.7MFiscal year ending 12/2023
CA AVG
$15.7M
Rank
#96 / 260 | $8.5MFiscal year ending 12/2023
Facility
$8.5MFiscal year ending 12/2023
CA AVG
$8.9M
Rank
#126 / 260 | 50.6%Fiscal year ending 12/2023
Facility
50.6%Fiscal year ending 12/2023
CA AVG
61.1%
Rank
#176 / 260 | 555716 | ||||
| Brier Oak on Sunset | NH AL IL MC | Los Angeles (East Hollywood) | 159
Facility
159
CA AVG
104
Rank
#308 / 1646 |
76.9%
Facility
76.9%
CA AVG
73.9
Rank
#750 / 1492 | +4% | 4.04
Facility
4.04
CA AVG
4.22
Rank
#151 / 289 | +10% | -4% | $21.7k
Facility
$21.7k
CA AVG
$56.5k
Rank
#220 / 294 | - | 93
Facility
93
CA AVG
50.2
Rank
#265 / 291 | 3.9
Facility
3.9
CA AVG
4.6
Rank
#136 / 291 | 3 | 122 | - |
93
Facility
93
CA AVG
59
Rank
#111 / 2058 | - | $15.5MFiscal year ending 12/2023
Facility
$15.5MFiscal year ending 12/2023
CA AVG
$15.7M
Rank
#113 / 260 | $9.6MFiscal year ending 12/2023
Facility
$9.6MFiscal year ending 12/2023
CA AVG
$8.9M
Rank
#95 / 260 | 62.1%Fiscal year ending 12/2023
Facility
62.1%Fiscal year ending 12/2023
CA AVG
61.1%
Rank
#59 / 260 | 56056 |
Brier Oak on Sunset is located in Los Angeles, California.
Here are the financial assistance programs available to residents in California.
Brier Oak on Sunset is in the East Hollywood neighborhood.
Brier Oak on Sunset has a walk score of 93. Walker's paradise. Daily errands do not require a car, with many shops and services nearby.
Brier Oak on Sunset's occupancy is 75.7%.
No, Brier Oak on Sunset has a no-pet policy.
Brier Oak on Sunset is registered as a for-profit.
Yes — there are 7 photos of Brier Oak on Sunset in the photo gallery on this page.
Brier Oak on Sunset is located at 5154 Sunset Blvd, Los Angeles, CA 90027.
Care Cost Calculator: See Prices in Your Area
Nursing Home Data Explorer
Don’t Wait Too Long: 7 Red Flag Signs Your Parent Needs Assisted Living Now
The True Cost of Assisted Living in 2025 – And How Families Are Paying For It
Understanding Senior Living Costs: Pricing Models, Discounts & Financial Assistance


