


Brightview Avondell
Independent Living, Assisted Living & Memory Care · Baltimore, MD
Brightview Avondell
Independent Living, Assisted Living & Memory Care · Baltimore, MD
Overview of Brightview Avondell
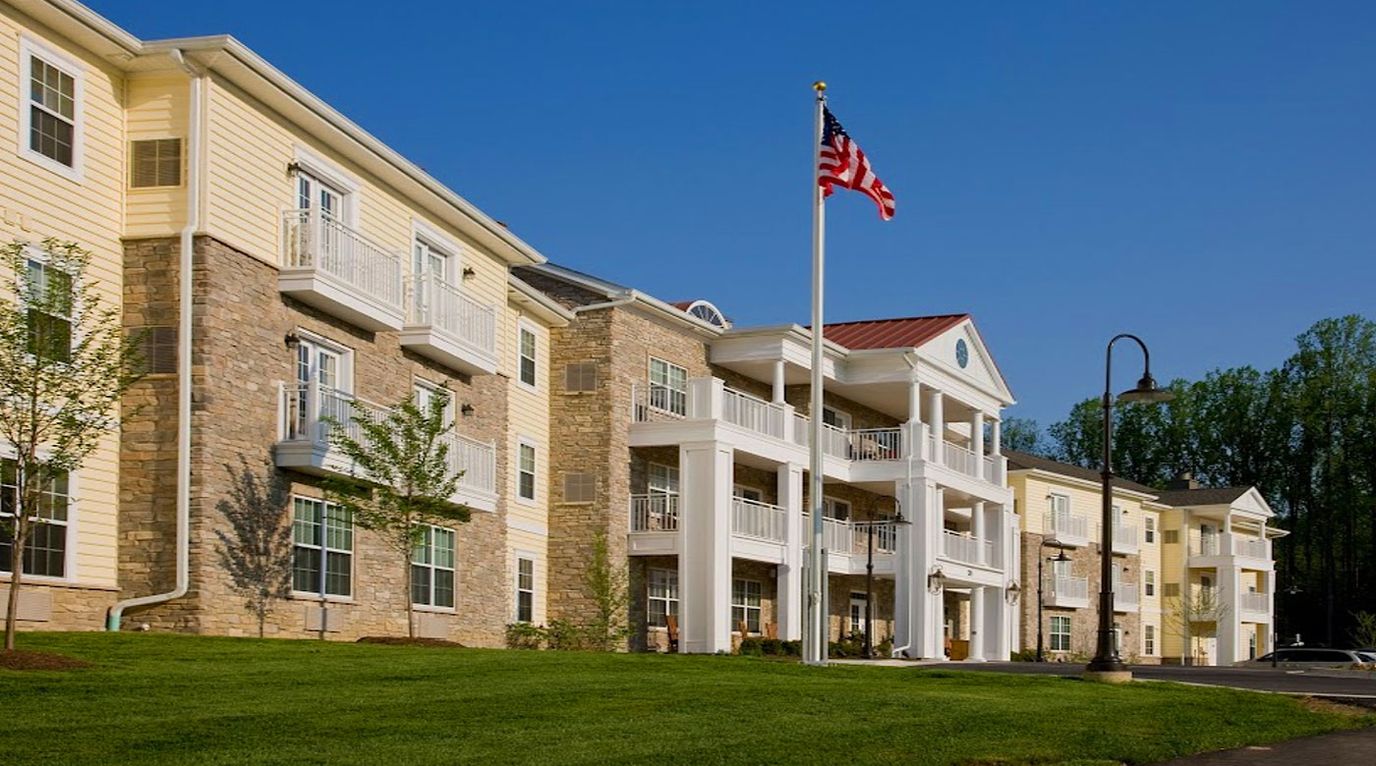
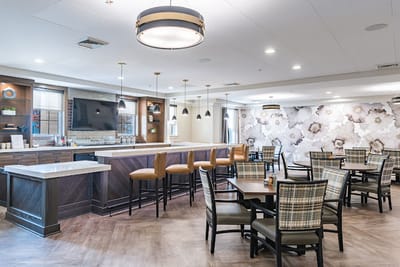
Brightview Avondell undoubtedly provides the highest care for independent living, assisted living, and memory care support in Bel Air South in Maryland. Management makes it a point that seniors are given the freedom and choice given to each resident and ensures that they attend to the unique needs of each individual with kindness and compassion. The premier retirement community strives to satisfy the holistic wellness of its residents in a cozy, nurturing, and fun-filled environment.
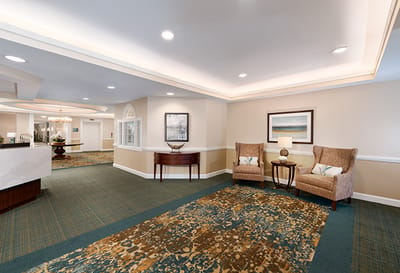
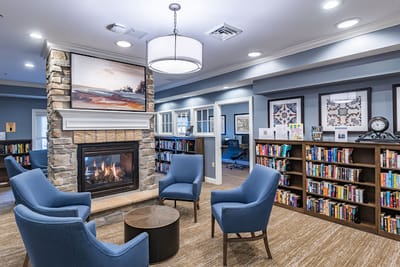
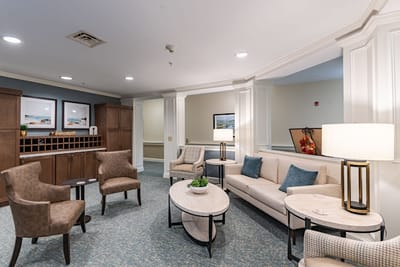
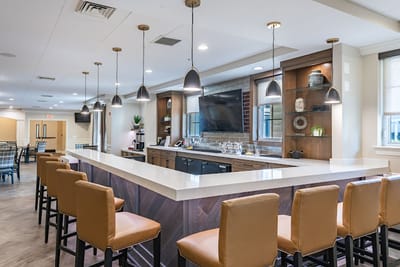
Brightview Avondell’s residential lifestyle encourages its seniors to live a fulfilling everyday life through the community’s extensive services. Some all-inclusive features include ALDs, medication management, specialized memory care programs, housekeeping, and laundry services tailored to their unique needs. Other amenities include a library, full baths, a cafe, a fitness center, and a multi-purpose room– to name a few of what the home offers.
36-bed community Rank #244 / 697Bed count — State benchmarkedThis home is ranked 244th out of 697 homes in Maryland. Shows this facility's certified or reported bed count compared to other Maryland facilities. Larger communities may offer more amenities, programs, and on-site services for residents and families.Click the rank badge to see the full State ranking.Click here to see the full State ranking.
A moderately sized community that may balance personal attention with shared amenities and social activities.
19 years in operation Rank #116 / 208Years in operation — State benchmarkedThis home is ranked 116th out of 208 homes in Maryland. Shows how long this facility has been in operation compared to other Maryland facilities. Longer operating histories may benefit residents, families, and staff.Click the rank badge to see the full State ranking.Click here to see the full State ranking.
A longer operating history, which may indicate experience navigating regulations and delivering ongoing care.
Walk Score: 19 / 100 Rank #746 / 985Walk Score — State benchmarkedThis home is ranked 746th out of 985 homes in Maryland. Shows how walkable this facility's neighborhood is compared to the average Walk Score across Maryland facilities. Higher scores benefit residents, families, and staff.Click the rank badge to see the full State ranking.Click here to see the full State ranking.
Car-dependent. Most errands require a car, with limited nearby walkable options.
About this community
AwardsRanked as one of Fortune's Top 100 Best Companies to Work® For in 2025
Facility TypeAl
CountyHarford
Profit StatusTrue
Private Room
$315 - $380 per day
Emergency Systems24-hour emergency call system
Safety FeaturesSecurity-controlled entrances
Hospice Affiliations
Staffing
Key information about the people who lead and staff this community.
No CNA training program
ContactMs. Eileen Adams, Executive Director
Licensed Nurses/CNAs
24-Hour Staffing
Mild Alzheimer's Level
No moderate Alzheimer's level
No severe Alzheimer's level
Indoor Pool
Hot Tub
Chef-Prepared Meals
Sewing Room
Art Studio
Woodshop
Movie Theater
Putting Green
Community Walking Path
Pond
Fire Pits
Fitness Center
Beauty/Barber Shop
Library
Café
Games Area
Multipurpose Great Room
Resident Parking
ActivitiesDaily program calendar to help residents stay active and engaged.
Specific ProgramsEnhanced Care, Daily programs, Culinary Experiences, Bright Minds Program
Food DescriptionChef-prepared meals served daily in a restaurant-style dining setting.
Demographics
Resident demographic information for this facility.
Gender
- Female 69.2%
- Male 30.8%
Age Distribution
- 85-94 76.9%
- 75-84 11.5%
- 95+ 11.5%
Ethnicity
- White 96.2%
- Asian 3.9%
What does this home offer?
Pets Allowed
Housing Options: Studio / 1 Bed / 2 Bed
Building Type: Mid-rise
Fitness and Recreation
Over 10 years of experience
Katie A. brings over 10 years of experience at Brightview, starting as a concierge and advancing through various community director roles. She now serves as the Community Executive Director at Brightview Avondell, leading the community with dedication and a deep understanding of senior living operations.
Living Spaces & Floor Plans for Brightview Avondell
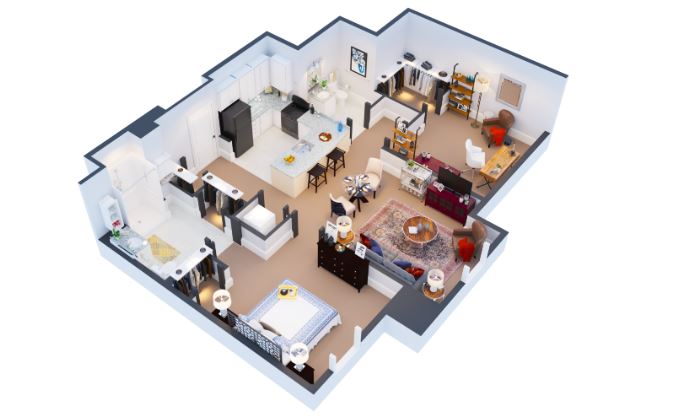
Brightview Avondell Plan 3
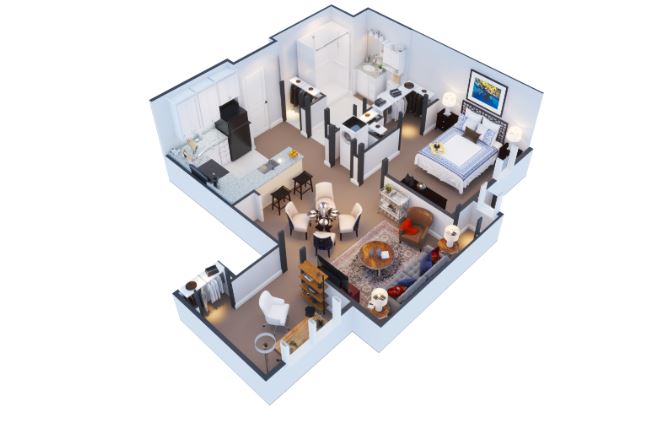
Brightview Avondell Plan 2
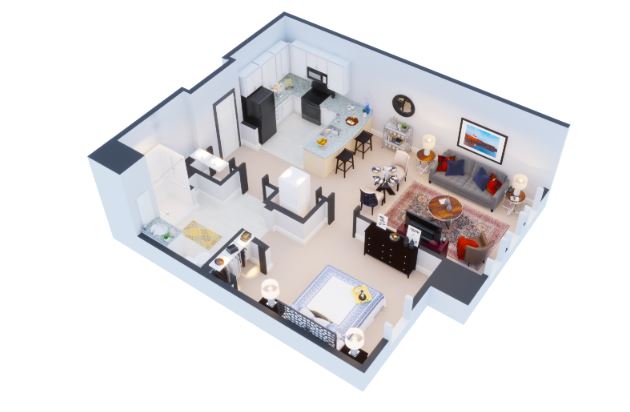
Brightview Avondell Plan 1
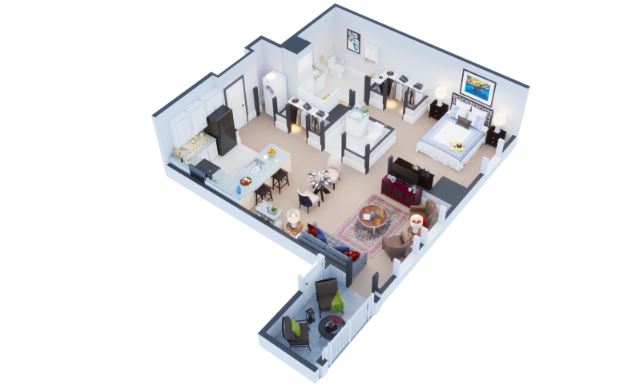
Brightview Avondell Plan 4
Places of interest near Brightview Avondell
![]() 30.6 miles from city center
30.6 miles from city center
![]() Estimated distance in miles from Bel Air's city center to Brightview Avondell's address, calculated via Google Maps.
— 13.41 miles to nearest hospital (MedStar Franklin Square Medical Center)
Estimated distance in miles from Bel Air's city center to Brightview Avondell's address, calculated via Google Maps.
— 13.41 miles to nearest hospital (MedStar Franklin Square Medical Center)
Calculate Travel Distance to Brightview Avondell
Add your location
Financial Assistance for
Independent Living in Maryland
Brightview Avondell is located in Bel Air, Maryland.
Here are the financial assistance programs available to residents in Maryland.
Compare Independent Living around Baltimore
| Heritage at Augsburg Independent Living |
IL Independent Living Lifestyle-focused communities for older adults offering dining, activities, and transportation with minimal personal care. Best for active, independent seniors who want community without medical support.
NH Nursing Home Licensed facility providing 24/7 skilled nursing care for residents with complex, ongoing medical needs. Staffed by RNs, LPNs, and CNAs. Inspected and star-rated annually by CMS. Accepts Medicare (short-term rehab) and Medicaid (long-term care). | Baltimore (Gwynn Oak) | 131
Facility
131
MD AVG
43
Rank
#64 / 697 | No |
16
Facility
16
MD AVG
43
Rank
#772 / 985 | Studio / 1 Bed / 2 Bed | - | - | - | - | - | - | - | - | - | - |
| Spring Arbor of Crofton |
IL Independent Living Lifestyle-focused communities for older adults offering dining, activities, and transportation with minimal personal care. Best for active, independent seniors who want community without medical support.
AL Assisted Living A licensed, long-term care setting for seniors or individuals with disabilities who need help with daily activities — like bathing, dressing, and medication management — but not 24-hour skilled nursing. Offers housing, meals, and around-the-clock support while aiming to maximize resident independence.
MC Memory Care Secured, specialized care for people living with Alzheimer's or dementia. Staff trained in cognitive impairment, with higher staff-to-resident ratios and an environment designed to reduce confusion and wandering risk. | Crofton (Crofton Mews) | 93
Facility
93
MD AVG
43
Rank
#151 / 697 | Yes |
19
Facility
19
MD AVG
43
Rank
#746 / 985 | Studio / 1 Bed / 2 Bed | 7
Facility
7
MD AVG
21
Rank
#172 / 208 |
21% Male Residents — State Benchmarked 21% of residents are male, compared to the Maryland average of 31%. This facility caters to a majority female resident pool (79% female), consistent with the broader assisted living trend where women significantly outnumber men. |
79% Female Residents — State Benchmarked 79% of residents are female, compared to the Maryland average of 69%. Women comprise the large majority, consistent with national assisted living demographics where women live longer and enter care facilities at higher rates. |
90% White Residents — State Benchmarked 90% of residents are reported as White, compared to the Maryland average of 81%. A higher White share than is typical for assisted living in Maryland in this dataset — compare with peer facilities for local context. |
8% African American Residents — State Benchmarked 8% of residents are reported as African American or Black, compared to the Maryland average of 13%. In line with the Maryland average for African American residents among facilities reporting this breakdown. |
2% Other Ethnicity Residents — State Benchmarked 2% of residents fall into categories other than White or African American (combined), compared to the Maryland average of 6%. This column aggregates Hispanic, Asian, multiracial, and any other labeled groups that are not classified as White or African American. Reported subgroups in this total: Asian (2%). |
3% Residents Age 65–74 — State Benchmarked 3% of residents are 65–74, compared to the Maryland average of 13%. Fewer younger seniors suggests the resident population skews older, likely requiring higher acuity care and more hands-on support. |
5% Residents Age 75–84 — State Benchmarked 5% of residents are 75–84, compared to the Maryland average of 31%. Below the state norm — the resident mix may skew either younger or older than this typical middle bracket. |
88% Residents Age 85–94 — State Benchmarked 88% of residents are 85–94, compared to the Maryland average of 44%. A high concentration of very elderly residents signals a higher-acuity facility with experience caring for advanced age-related needs. |
3% Residents Age 95+ — State Benchmarked 3% of residents are 95 or older, compared to the Maryland average of 16%. Most residents here have not yet reached the oldest-old bracket, suggesting a younger overall community. |
| Brightview Westminster Ridge |
IL Independent Living Lifestyle-focused communities for older adults offering dining, activities, and transportation with minimal personal care. Best for active, independent seniors who want community without medical support.
AL Assisted Living A licensed, long-term care setting for seniors or individuals with disabilities who need help with daily activities — like bathing, dressing, and medication management — but not 24-hour skilled nursing. Offers housing, meals, and around-the-clock support while aiming to maximize resident independence.
MC Memory Care Secured, specialized care for people living with Alzheimer's or dementia. Staff trained in cognitive impairment, with higher staff-to-resident ratios and an environment designed to reduce confusion and wandering risk. | Westminster (Brightview Westminster Ridge) | 75
Facility
75
MD AVG
43
Rank
#186 / 697 | No |
30
Facility
30
MD AVG
43
Rank
#627 / 985 | Studio / 1 Bed / 2 Bed | 20
Facility
20
MD AVG
21
Rank
#111 / 208 |
17% Male Residents — State Benchmarked 17% of residents are male, compared to the Maryland average of 31%. This facility caters to a majority female resident pool (83% female), consistent with the broader assisted living trend where women significantly outnumber men. |
83% Female Residents — State Benchmarked 83% of residents are female, compared to the Maryland average of 69%. Women comprise the large majority, consistent with national assisted living demographics where women live longer and enter care facilities at higher rates. |
98% White Residents — State Benchmarked 98% of residents are reported as White, compared to the Maryland average of 81%. A higher White share than is typical for assisted living in Maryland in this dataset — compare with peer facilities for local context. |
0% African American Residents — State Benchmarked 0% of residents are reported as African American or Black, compared to the Maryland average of 13%. A lower African American share than is typical in Maryland; local markets still vary widely. |
2% Other Ethnicity Residents — State Benchmarked 2% of residents fall into categories other than White or African American (combined), compared to the Maryland average of 6%. This column aggregates Hispanic, Asian, multiracial, and any other labeled groups that are not classified as White or African American. Reported subgroups in this total: Other (2%). |
3% Residents Age 65–74 — State Benchmarked 3% of residents are 65–74, compared to the Maryland average of 13%. Fewer younger seniors suggests the resident population skews older, likely requiring higher acuity care and more hands-on support. |
17% Residents Age 75–84 — State Benchmarked 17% of residents are 75–84, compared to the Maryland average of 31%. Below the state norm — the resident mix may skew either younger or older than this typical middle bracket. |
67% Residents Age 85–94 — State Benchmarked 67% of residents are 85–94, compared to the Maryland average of 44%. A high concentration of very elderly residents signals a higher-acuity facility with experience caring for advanced age-related needs. |
10% Residents Age 95+ — State Benchmarked 10% of residents are 95 or older, compared to the Maryland average of 16%. Most residents here have not yet reached the oldest-old bracket, suggesting a younger overall community. |
| Brightview Avondell |
IL Independent Living Lifestyle-focused communities for older adults offering dining, activities, and transportation with minimal personal care. Best for active, independent seniors who want community without medical support.
AL Assisted Living A licensed, long-term care setting for seniors or individuals with disabilities who need help with daily activities — like bathing, dressing, and medication management — but not 24-hour skilled nursing. Offers housing, meals, and around-the-clock support while aiming to maximize resident independence.
MC Memory Care Secured, specialized care for people living with Alzheimer's or dementia. Staff trained in cognitive impairment, with higher staff-to-resident ratios and an environment designed to reduce confusion and wandering risk. | Bel Air (West Ring Factory Road) | 36
Facility
36
MD AVG
43
Rank
#244 / 697 | Yes |
19
Facility
19
MD AVG
43
Rank
#746 / 985 | Studio / 1 Bed / 2 Bed | 19
Facility
19
MD AVG
21
Rank
#116 / 208 |
31% Male Residents — State Benchmarked 31% of residents are male, compared to the Maryland average of 31%. This facility caters to a majority female resident pool (69% female), consistent with the broader assisted living trend where women significantly outnumber men. |
69% Female Residents — State Benchmarked 69% of residents are female, compared to the Maryland average of 69%. Women comprise the large majority, consistent with national assisted living demographics where women live longer and enter care facilities at higher rates. |
96% White Residents — State Benchmarked 96% of residents are reported as White, compared to the Maryland average of 81%. A higher White share than is typical for assisted living in Maryland in this dataset — compare with peer facilities for local context. |
0% African American Residents — State Benchmarked 0% of residents are reported as African American or Black, compared to the Maryland average of 13%. A lower African American share than is typical in Maryland; local markets still vary widely. |
4% Other Ethnicity Residents — State Benchmarked 4% of residents fall into categories other than White or African American (combined), compared to the Maryland average of 6%. This column aggregates Hispanic, Asian, multiracial, and any other labeled groups that are not classified as White or African American. Reported subgroups in this total: Asian (4%). | - |
12% Residents Age 75–84 — State Benchmarked 12% of residents are 75–84, compared to the Maryland average of 31%. Below the state norm — the resident mix may skew either younger or older than this typical middle bracket. |
77% Residents Age 85–94 — State Benchmarked 77% of residents are 85–94, compared to the Maryland average of 44%. A high concentration of very elderly residents signals a higher-acuity facility with experience caring for advanced age-related needs. |
12% Residents Age 95+ — State Benchmarked 12% of residents are 95 or older, compared to the Maryland average of 16%. In line with the statewide profile for the oldest resident bracket. |
| Mabel‘s House |
IL Independent Living Lifestyle-focused communities for older adults offering dining, activities, and transportation with minimal personal care. Best for active, independent seniors who want community without medical support.
AL Assisted Living A licensed, long-term care setting for seniors or individuals with disabilities who need help with daily activities — like bathing, dressing, and medication management — but not 24-hour skilled nursing. Offers housing, meals, and around-the-clock support while aiming to maximize resident independence. | Gwynn Oak (Central Forest Park) | 5
Facility
5
MD AVG
43
Rank
#436 / 697 | No |
70
Facility
70
MD AVG
43
Rank
#184 / 985 | Studio / 1 Bed / 2 Bed | - | - | - | - | - | - | - | - | - | - |
Frequently Asked Questions about Brightview Avondell
What neighborhood is Brightview Avondell in?
Brightview Avondell is in the West Ring Factory Road neighborhood of Bel Air.
Is Brightview Avondell in a walkable area?
Brightview Avondell has a walk score of 19. Car-dependent. Most errands require a car, with limited nearby walkable options.
How many beds does Brightview Avondell have?
Brightview Avondell has 36 beds.
Are there photos of Brightview Avondell?
Yes — there are 6 photos of Brightview Avondell in the photo gallery on this page.
What is the phone number of Brightview Avondell?
(410) 849-6462 will put you in contact with the team at Brightview Avondell.
What county is Brightview Avondell located in?
Brightview Avondell is in Harford County.
Is Brightview Avondell Medicare or Medicaid certified?
Brightview Avondell is not currently listed as a CMS-certified provider of Medicare or Medicaid.
Guides for Better Senior Living
Care Cost Calculator: See Prices in Your Area
Nursing Home Data Explorer
Don’t Wait Too Long: 7 Red Flag Signs Your Parent Needs Assisted Living Now
The True Cost of Assisted Living in 2025 – And How Families Are Paying For It
Understanding Senior Living Costs: Pricing Models, Discounts & Financial Assistance
Contact Us

Published on
Updated on
Feedback
Write a review for Brightview Avondell
Rate your overall experience with this community
Explore Open Rooms
1
Contact details
2
What type of senior care service are you looking for?
3
What budget do you have in mind for senior care?
4
How soon do you need to find care?
5
Additional details
Thank you for your interest!
Our team will be in touch shortly to help with next steps.
Need Help?
Let us help you or a loved one find the perfect senior home.
