


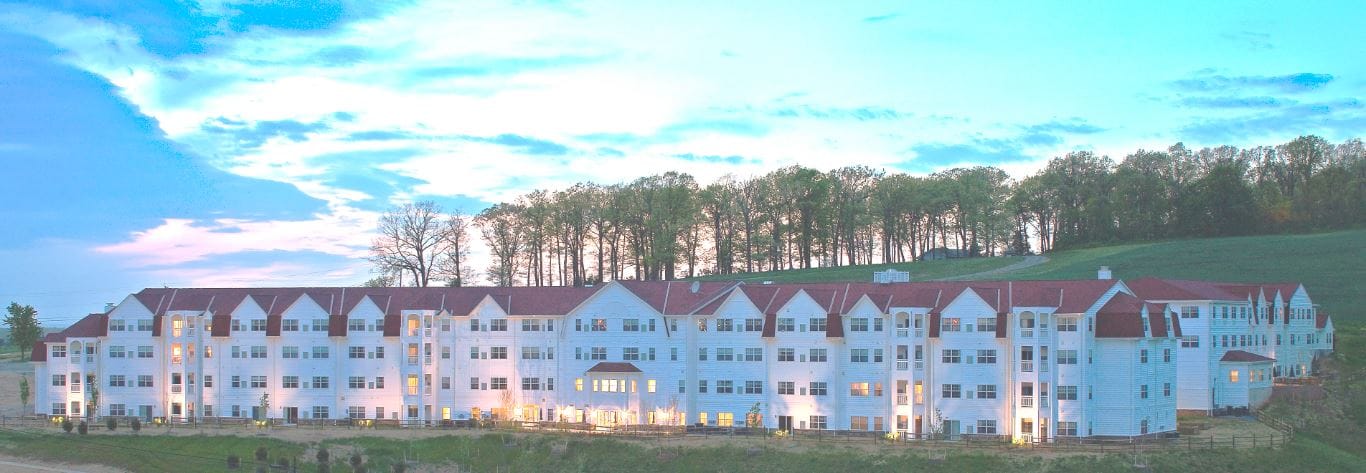
Brightview Westminster Ridge
Independent Living, Assisted Living & Memory Care · Baltimore, MD
Brightview Westminster Ridge
Independent Living, Assisted Living & Memory Care · Baltimore, MD
Overview of Brightview Westminster Ridge
Discover a new way of living in comfort at Brightview Westminster Ridge, a blissful senior living community in Westminster, MD, offering independent living, assisted living, and memory care options. Residents enjoy a restful retirement at the comfort of their well-designed accommodations with access to full-kitchen, individually controlled heating and cooling, and security-controlled entrances. With services like regular housekeeping, transportation services, and on-site maintenance, residents live conveniently and and comfortably
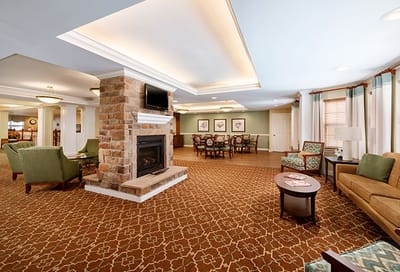
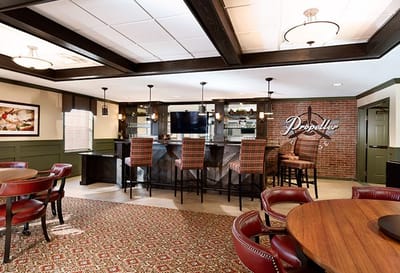
Residents find plenty of ways to fill their days with a vibrant calendar of activities and interesting amenities. Residents can gather to play cards, watch movies together, enjoy a game of bingo in the game area or just connect with each other. Services like housekeeping, transportation services, and maintenance, helps residents live conveniently, with more time for participating in engaging events or connecting with friends and family.
75-bed community Rank #186 / 697Bed count — State benchmarkedThis home is ranked 186th out of 697 homes in Maryland. Shows this facility's certified or reported bed count compared to other Maryland facilities. Larger communities may offer more amenities, programs, and on-site services for residents and families.Click the rank badge to see the full State ranking.Click here to see the full State ranking.
A moderately sized community that may balance personal attention with shared amenities and social activities.
20 years in operation Rank #111 / 208Years in operation — State benchmarkedThis home is ranked 111th out of 208 homes in Maryland. Shows how long this facility has been in operation compared to other Maryland facilities. Longer operating histories may benefit residents, families, and staff.Click the rank badge to see the full State ranking.Click here to see the full State ranking.
A longer operating history, which may indicate experience navigating regulations and delivering ongoing care.
Walk Score: 30 / 100 Rank #627 / 985Walk Score — State benchmarkedThis home is ranked 627th out of 985 homes in Maryland. Shows how walkable this facility's neighborhood is compared to the average Walk Score across Maryland facilities. Higher scores benefit residents, families, and staff.Click the rank badge to see the full State ranking.Click here to see the full State ranking.
Somewhat walkable. A few nearby services may be reachable on foot, but most trips require transportation.
About this community
AwardsBrightview 2022 Community of the Year, Ranked by FORTUNE Magazine for seven consecutive years (2019 - 2025)
Facility TypeAl
CountyCarroll
AccreditationsBrightview 2022 Community of the Year, Ranked by FORTUNE Magazine for seven consecutive years (2019 - 2025)
Profit StatusTrue
Private Room
$206 - $339 per day
Semi-Private Room
$195 - $242 per day
Hospice Affiliations
Staffing
Key information about the people who lead and staff this community.
No CNA training program
ContactDeanna Lawrence, Executive Director
Respite Care
Licensed Nurses/CNAs
Dedicated Alzheimer's Unit
Mild Alzheimer's Level
Moderate Alzheimer's Level
Severe Alzheimer's Level
Library
Fitness Center
Salon And Spa
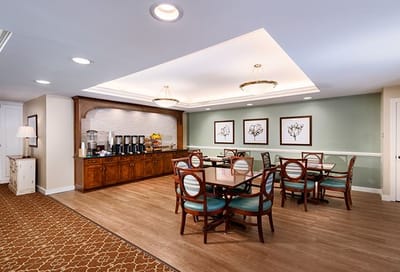
Chef-Prepared Meals
Daily Programs
Safety And Security
ActivitiesDaily programs to stay active and social.
Specific ProgramsVibrant Living programs
Food DescriptionDelicious, chef-prepared meals are served in Brightview Westminster Ridge's lovely dining room.
Demographics
Resident demographic information for this facility.
Gender
- Female 82.8%
- Male 17.2%
Age Distribution
- 85-94 67.2%
- 75-84 17.2%
- 95+ 10.3%
- 65-74 3.5%
- ≤64 1.7%
Ethnicity
- White 98.3%
- Other 1.7%
What does this home offer?
Housing Options: 1 Bed / 2 Bed
Building Type: Mid-rise
Transportation Services
Fitness and Recreation
Places of interest near Brightview Westminster Ridge
![]() 35.1 miles from city center
35.1 miles from city center
![]() Estimated distance in miles from Westminster's city center to Brightview Westminster Ridge's address, calculated via Google Maps.
Estimated distance in miles from Westminster's city center to Brightview Westminster Ridge's address, calculated via Google Maps.
Calculate Travel Distance to Brightview Westminster Ridge
Add your location
Financial Assistance for
Independent Living in Maryland
Brightview Westminster Ridge is located in Westminster, Maryland.
Here are the financial assistance programs available to residents in Maryland.
Compare Independent Living around Baltimore
| Heritage at Augsburg Independent Living |
IL Independent Living Lifestyle-focused communities for older adults offering dining, activities, and transportation with minimal personal care. Best for active, independent seniors who want community without medical support.
NH Nursing Home Licensed facility providing 24/7 skilled nursing care for residents with complex, ongoing medical needs. Staffed by RNs, LPNs, and CNAs. Inspected and star-rated annually by CMS. Accepts Medicare (short-term rehab) and Medicaid (long-term care). | Baltimore (Gwynn Oak) | 131
Facility
131
MD AVG
43
Rank
#64 / 697 | No |
16
Facility
16
MD AVG
43
Rank
#772 / 985 | 1 Bed / 2 Bed | - | - | - | - | - | - | - | - | - | - |
| Spring Arbor of Crofton |
IL Independent Living Lifestyle-focused communities for older adults offering dining, activities, and transportation with minimal personal care. Best for active, independent seniors who want community without medical support.
AL Assisted Living A licensed, long-term care setting for seniors or individuals with disabilities who need help with daily activities — like bathing, dressing, and medication management — but not 24-hour skilled nursing. Offers housing, meals, and around-the-clock support while aiming to maximize resident independence.
MC Memory Care Secured, specialized care for people living with Alzheimer's or dementia. Staff trained in cognitive impairment, with higher staff-to-resident ratios and an environment designed to reduce confusion and wandering risk. | Crofton (Crofton Mews) | 93
Facility
93
MD AVG
43
Rank
#151 / 697 | Yes |
19
Facility
19
MD AVG
43
Rank
#746 / 985 | 1 Bed / 2 Bed | 7
Facility
7
MD AVG
21
Rank
#172 / 208 |
21% Male Residents — State Benchmarked 21% of residents are male, compared to the Maryland average of 31%. This facility caters to a majority female resident pool (79% female), consistent with the broader assisted living trend where women significantly outnumber men. |
79% Female Residents — State Benchmarked 79% of residents are female, compared to the Maryland average of 69%. Women comprise the large majority, consistent with national assisted living demographics where women live longer and enter care facilities at higher rates. |
90% White Residents — State Benchmarked 90% of residents are reported as White, compared to the Maryland average of 81%. A higher White share than is typical for assisted living in Maryland in this dataset — compare with peer facilities for local context. |
8% African American Residents — State Benchmarked 8% of residents are reported as African American or Black, compared to the Maryland average of 13%. In line with the Maryland average for African American residents among facilities reporting this breakdown. |
2% Other Ethnicity Residents — State Benchmarked 2% of residents fall into categories other than White or African American (combined), compared to the Maryland average of 6%. This column aggregates Hispanic, Asian, multiracial, and any other labeled groups that are not classified as White or African American. Reported subgroups in this total: Asian (2%). |
3% Residents Age 65–74 — State Benchmarked 3% of residents are 65–74, compared to the Maryland average of 13%. Fewer younger seniors suggests the resident population skews older, likely requiring higher acuity care and more hands-on support. |
5% Residents Age 75–84 — State Benchmarked 5% of residents are 75–84, compared to the Maryland average of 31%. Below the state norm — the resident mix may skew either younger or older than this typical middle bracket. |
88% Residents Age 85–94 — State Benchmarked 88% of residents are 85–94, compared to the Maryland average of 44%. A high concentration of very elderly residents signals a higher-acuity facility with experience caring for advanced age-related needs. |
3% Residents Age 95+ — State Benchmarked 3% of residents are 95 or older, compared to the Maryland average of 16%. Most residents here have not yet reached the oldest-old bracket, suggesting a younger overall community. |
| Brightview Westminster Ridge |
IL Independent Living Lifestyle-focused communities for older adults offering dining, activities, and transportation with minimal personal care. Best for active, independent seniors who want community without medical support.
AL Assisted Living A licensed, long-term care setting for seniors or individuals with disabilities who need help with daily activities — like bathing, dressing, and medication management — but not 24-hour skilled nursing. Offers housing, meals, and around-the-clock support while aiming to maximize resident independence.
MC Memory Care Secured, specialized care for people living with Alzheimer's or dementia. Staff trained in cognitive impairment, with higher staff-to-resident ratios and an environment designed to reduce confusion and wandering risk. | Westminster (Brightview Westminster Ridge) | 75
Facility
75
MD AVG
43
Rank
#186 / 697 | No |
30
Facility
30
MD AVG
43
Rank
#627 / 985 | 1 Bed / 2 Bed | 20
Facility
20
MD AVG
21
Rank
#111 / 208 |
17% Male Residents — State Benchmarked 17% of residents are male, compared to the Maryland average of 31%. This facility caters to a majority female resident pool (83% female), consistent with the broader assisted living trend where women significantly outnumber men. |
83% Female Residents — State Benchmarked 83% of residents are female, compared to the Maryland average of 69%. Women comprise the large majority, consistent with national assisted living demographics where women live longer and enter care facilities at higher rates. |
98% White Residents — State Benchmarked 98% of residents are reported as White, compared to the Maryland average of 81%. A higher White share than is typical for assisted living in Maryland in this dataset — compare with peer facilities for local context. |
0% African American Residents — State Benchmarked 0% of residents are reported as African American or Black, compared to the Maryland average of 13%. A lower African American share than is typical in Maryland; local markets still vary widely. |
2% Other Ethnicity Residents — State Benchmarked 2% of residents fall into categories other than White or African American (combined), compared to the Maryland average of 6%. This column aggregates Hispanic, Asian, multiracial, and any other labeled groups that are not classified as White or African American. Reported subgroups in this total: Other (2%). |
3% Residents Age 65–74 — State Benchmarked 3% of residents are 65–74, compared to the Maryland average of 13%. Fewer younger seniors suggests the resident population skews older, likely requiring higher acuity care and more hands-on support. |
17% Residents Age 75–84 — State Benchmarked 17% of residents are 75–84, compared to the Maryland average of 31%. Below the state norm — the resident mix may skew either younger or older than this typical middle bracket. |
67% Residents Age 85–94 — State Benchmarked 67% of residents are 85–94, compared to the Maryland average of 44%. A high concentration of very elderly residents signals a higher-acuity facility with experience caring for advanced age-related needs. |
10% Residents Age 95+ — State Benchmarked 10% of residents are 95 or older, compared to the Maryland average of 16%. Most residents here have not yet reached the oldest-old bracket, suggesting a younger overall community. |
| Brightview Avondell |
IL Independent Living Lifestyle-focused communities for older adults offering dining, activities, and transportation with minimal personal care. Best for active, independent seniors who want community without medical support.
AL Assisted Living A licensed, long-term care setting for seniors or individuals with disabilities who need help with daily activities — like bathing, dressing, and medication management — but not 24-hour skilled nursing. Offers housing, meals, and around-the-clock support while aiming to maximize resident independence.
MC Memory Care Secured, specialized care for people living with Alzheimer's or dementia. Staff trained in cognitive impairment, with higher staff-to-resident ratios and an environment designed to reduce confusion and wandering risk. | Bel Air (West Ring Factory Road) | 36
Facility
36
MD AVG
43
Rank
#244 / 697 | Yes |
19
Facility
19
MD AVG
43
Rank
#746 / 985 | 1 Bed / 2 Bed | 19
Facility
19
MD AVG
21
Rank
#116 / 208 |
31% Male Residents — State Benchmarked 31% of residents are male, compared to the Maryland average of 31%. This facility caters to a majority female resident pool (69% female), consistent with the broader assisted living trend where women significantly outnumber men. |
69% Female Residents — State Benchmarked 69% of residents are female, compared to the Maryland average of 69%. Women comprise the large majority, consistent with national assisted living demographics where women live longer and enter care facilities at higher rates. |
96% White Residents — State Benchmarked 96% of residents are reported as White, compared to the Maryland average of 81%. A higher White share than is typical for assisted living in Maryland in this dataset — compare with peer facilities for local context. |
0% African American Residents — State Benchmarked 0% of residents are reported as African American or Black, compared to the Maryland average of 13%. A lower African American share than is typical in Maryland; local markets still vary widely. |
4% Other Ethnicity Residents — State Benchmarked 4% of residents fall into categories other than White or African American (combined), compared to the Maryland average of 6%. This column aggregates Hispanic, Asian, multiracial, and any other labeled groups that are not classified as White or African American. Reported subgroups in this total: Asian (4%). | - |
12% Residents Age 75–84 — State Benchmarked 12% of residents are 75–84, compared to the Maryland average of 31%. Below the state norm — the resident mix may skew either younger or older than this typical middle bracket. |
77% Residents Age 85–94 — State Benchmarked 77% of residents are 85–94, compared to the Maryland average of 44%. A high concentration of very elderly residents signals a higher-acuity facility with experience caring for advanced age-related needs. |
12% Residents Age 95+ — State Benchmarked 12% of residents are 95 or older, compared to the Maryland average of 16%. In line with the statewide profile for the oldest resident bracket. |
| Mabel‘s House |
IL Independent Living Lifestyle-focused communities for older adults offering dining, activities, and transportation with minimal personal care. Best for active, independent seniors who want community without medical support.
AL Assisted Living A licensed, long-term care setting for seniors or individuals with disabilities who need help with daily activities — like bathing, dressing, and medication management — but not 24-hour skilled nursing. Offers housing, meals, and around-the-clock support while aiming to maximize resident independence. | Gwynn Oak (Central Forest Park) | 5
Facility
5
MD AVG
43
Rank
#436 / 697 | No |
70
Facility
70
MD AVG
43
Rank
#184 / 985 | 1 Bed / 2 Bed | - | - | - | - | - | - | - | - | - | - |
Frequently Asked Questions about Brightview Westminster Ridge
What neighborhood is Brightview Westminster Ridge in?
Brightview Westminster Ridge is in the Brightview Westminster Ridge neighborhood of Westminster.
Is Brightview Westminster Ridge in a walkable area?
Brightview Westminster Ridge has a walk score of 30. Somewhat walkable. A few nearby services may be reachable on foot, but most trips require transportation.
How many beds does Brightview Westminster Ridge have?
Brightview Westminster Ridge has 75 beds.
Are there photos of Brightview Westminster Ridge?
Yes — there are 4 photos of Brightview Westminster Ridge in the photo gallery on this page.
What is the phone number of Brightview Westminster Ridge?
(410) 567-0050 will put you in contact with the team at Brightview Westminster Ridge.
What county is Brightview Westminster Ridge located in?
Brightview Westminster Ridge is in Carroll County.
Is Brightview Westminster Ridge Medicare or Medicaid certified?
Brightview Westminster Ridge is not currently listed as a CMS-certified provider of Medicare or Medicaid.
Guides for Better Senior Living
Care Cost Calculator: See Prices in Your Area
Nursing Home Data Explorer
Don’t Wait Too Long: 7 Red Flag Signs Your Parent Needs Assisted Living Now
The True Cost of Assisted Living in 2025 – And How Families Are Paying For It
Understanding Senior Living Costs: Pricing Models, Discounts & Financial Assistance
Contact Us

Published on
Updated on
Feedback
Write a review for Brightview Westminster Ridge
Rate your overall experience with this community
Explore Open Rooms
1
Contact details
2
What type of senior care service are you looking for?
3
What budget do you have in mind for senior care?
4
How soon do you need to find care?
5
Additional details
Thank you for your interest!
Our team will be in touch shortly to help with next steps.
Need Help?
Let us help you or a loved one find the perfect senior home.
