


Brightview Crofton Riverwalk
Assisted Living, Independent Living & Memory Care · Crofton, MD

Brightview Crofton Riverwalk
Assisted Living, Independent Living & Memory Care · Crofton, MD
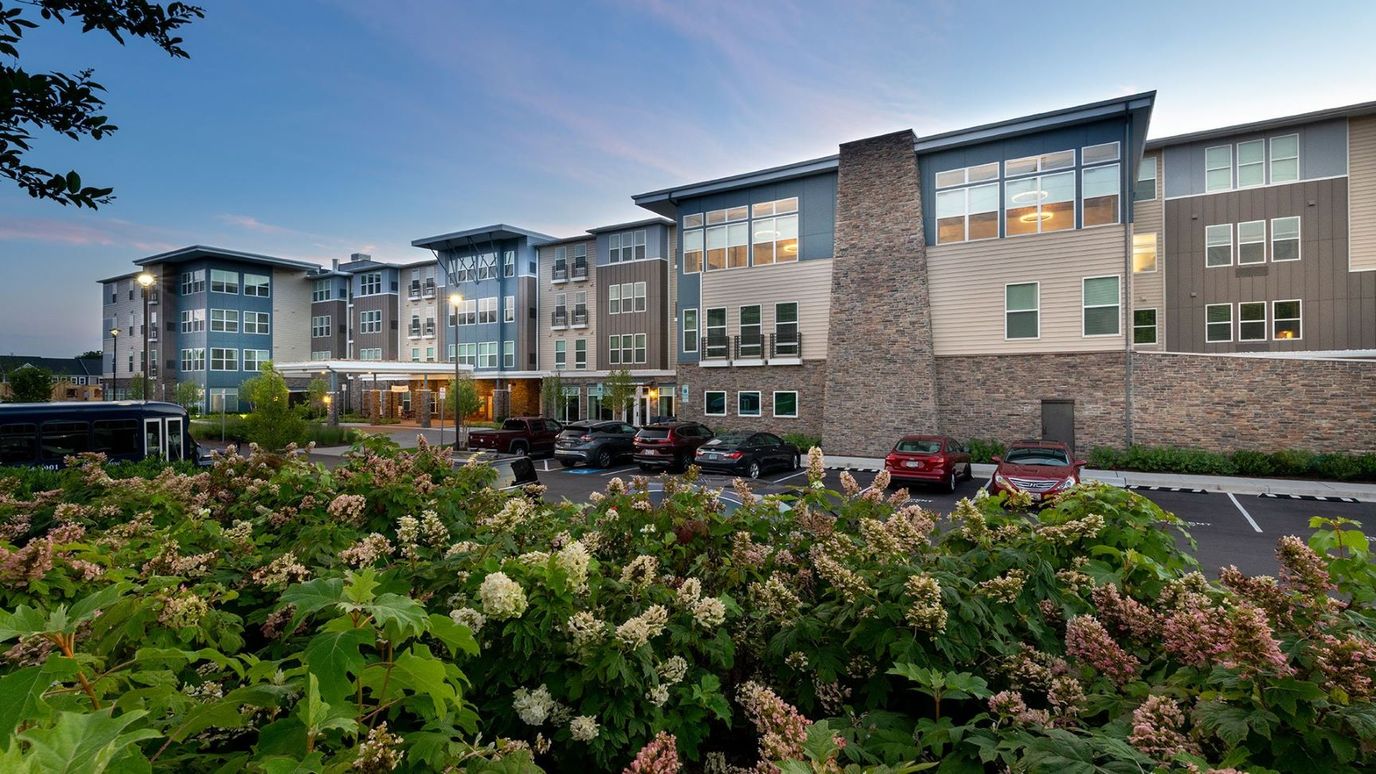
Brightview Crofton Riverwalk is a mid-rise community at 1301 Clarity Dr in Crofton, Maryland, operated by Brightview Senior Living. It has been open for 6 years and holds 92 units in studio, one-bedroom, and two-bedroom configurations. The Walk Score is 45, which means a car is needed for most errands. Room pricing starts at $257 per day for a private room and $337 per day for an apartment.
Three care levels are offered under one roof: independent living, assisted living, and memory care. The memory care side includes a dedicated Alzheimer’s unit organized around mild, moderate, and severe care levels. Brightview’s branded Bright Minds Program runs alongside the clinical care model.
Respite care is available. Licensed nurses and CNAs staff the community, and the facility has a hospice affiliation with Hospice of the Chesapeake. Pets are allowed.
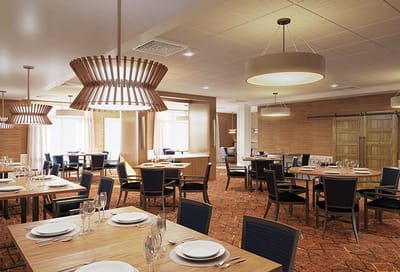
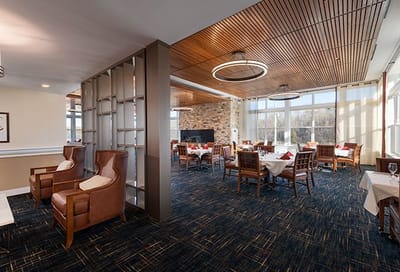
The day-to-day environment is well-appointed. Chef-prepared meals are served in the main dining room, with a private dining room available for family occasions. The building includes a fitness center, library, arts and crafts room, and a full-service beauty and barber shop. An outdoor courtyard and a daily structured activity schedule round out the lifestyle infrastructure.
Brightview Crofton Riverwalk is a full-continuum Brightview Senior Living property: independent living through memory care, a structured Alzheimer’s program with three care levels, on-site hospice affiliation, and a complete amenity set, all in a mid-rise building in Crofton’s Anne Arundel County.
92-bed community Rank #145 / 684Bed count — State benchmarkedThis home is ranked 145th out of 684 homes in Maryland for bed count. Shows this facility's certified or reported bed count compared to other Maryland facilities. Larger communities may offer more amenities, programs, and on-site services for residents and families.Facilities with the same value for a metric share the same rank. Rankings are based only on facilities in Maryland that report data for that category. Facilities without available data are excluded from the ranking.Click the rank badge to see the full State ranking.Click here to see the full State ranking.
A larger shared setting that may offer more common spaces and organized community services.
6 years in operation Rank #179 / 210Years in operation — State benchmarkedThis home is ranked 179th out of 210 homes in Maryland for years in operation. Shows how long this facility has been in operation compared to other Maryland facilities. Longer operating histories may benefit residents, families, and staff.Facilities with the same value for a metric share the same rank. Rankings are based only on facilities in Maryland that report data for that category. Facilities without available data are excluded from the ranking.Click the rank badge to see the full State ranking.Click here to see the full State ranking.
An established community with some operational experience and growing routines.
Walk Score: 45 / 100 Rank #474 / 953Walk Score — State benchmarkedThis home is ranked 474th out of 953 homes in Maryland for walk score. Shows how walkable this facility's neighborhood is compared to the average walk score across Maryland facilities. Higher scores benefit residents, families, and staff.Facilities with the same value for a metric share the same rank. Rankings are based only on facilities in Maryland that report data for that category. Facilities without available data are excluded from the ranking.Click the rank badge to see the full State ranking.Click here to see the full State ranking.
Somewhat walkable. A few nearby services may be reachable on foot, but most trips require transportation.
About this community
Best Workplace in Aging Services
Ranked by FORTUNE Magazine for seven consecutive years (2019 - 2025)
Facility TypeAssisted Living
CountyAnne Arundel
Brightview Crofton Riverwalk is legally operated by Brightview Senior Living.
Private Room
$257 - $364 per day
Semi-Private Room
$300 - $300 per day
Apartment
$337 - $412 per day
Hospice Affiliations
Respite Care
Licensed Nurses/CNAs
Dedicated Alzheimer's Unit
Mild Alzheimer's Level
Moderate Alzheimer's Level
Severe Alzheimer's Level
Salon
Activities
Branded ProgramsBright Minds Program
Specific ProgramsDaily programs, Chef-prepared meals, Fitness center, Arts and crafts room, Library, Private dining room, Outdoor courtyard
Demographics
Resident demographic information for this facility.
Gender
- Female 73.4%
- Male 26.6%
What does this home offer?
Pets Allowed
Housing Options: Studio / 1 Bed / 2 Bed
Building Type: Mid-rise
Fitness and Recreation
Places of interest near Brightview Crofton Riverwalk
![]() 0.8 miles from city center
0.8 miles from city center
![]() Estimated distance in miles from Crofton's city center to Brightview Crofton Riverwalk's address, calculated via Google Maps.
— 8.96 miles to nearest hospital (Luminis Health Anne Arundel Medical Center)
Estimated distance in miles from Crofton's city center to Brightview Crofton Riverwalk's address, calculated via Google Maps.
— 8.96 miles to nearest hospital (Luminis Health Anne Arundel Medical Center)
Calculate Travel Distance to Brightview Crofton Riverwalk
Add your location
Compare Assisted Living around Silver Spring
Info below is compiled from the MD Dept. of Health (OHCQ), senior community websites & trusted data sources such as Walk Score & BBB.
Communities are listed from highest to lowest based on our ranking methodology.
| Riderwood Village | AL IL MC | Silver Spring | 275
Facility
275
MD AVG
42
Rank
#3 / 684 | Yes |
33
Facility
33
MD AVG
45
Rank
#597 / 953 | - | 23
Facility
23
MD AVG
21
Rank
#101 / 210 |
29% Male Residents — State Benchmarked 29% of residents are male, compared to the Maryland average of 31%. This facility caters to a majority female resident pool (71% female), consistent with the broader assisted living trend where women significantly outnumber men. |
71% Female Residents — State Benchmarked 71% of residents are female, compared to the Maryland average of 69%. Women comprise the large majority, consistent with national assisted living demographics where women live longer and enter care facilities at higher rates. |
89% White Residents — State Benchmarked 89% of residents are reported as White, compared to the Maryland average of 81%. Close to the average for this category among assisted living facilities in Maryland with reported race/ethnicity data. |
7% African American Residents — State Benchmarked 7% of residents are reported as African American or Black, compared to the Maryland average of 13%. In line with the Maryland average for African American residents among facilities reporting this breakdown. |
4% Other Ethnicity Residents — State Benchmarked 4% of residents fall into categories other than White or African American (combined), compared to the Maryland average of 6%. This column aggregates Hispanic, Asian, multiracial, and any other labeled groups that are not classified as White or African American. Reported subgroups in this total: Asian (3%), Hispanic (0%). |
2% Residents Age 65–74 — State Benchmarked 2% of residents are 65–74, compared to the Maryland average of 13%. Fewer younger seniors suggests the resident population skews older, likely requiring higher acuity care and more hands-on support. |
23% Residents Age 75–84 — State Benchmarked 23% of residents are 75–84, compared to the Maryland average of 31%. Below the state norm — the resident mix may skew either younger or older than this typical middle bracket. |
52% Residents Age 85–94 — State Benchmarked 52% of residents are 85–94, compared to the Maryland average of 44%. A high concentration of very elderly residents signals a higher-acuity facility with experience caring for advanced age-related needs. |
23% Residents Age 95+ — State Benchmarked 23% of residents are 95 or older, compared to the Maryland average of 16%. A high proportion of the oldest-old suggests strong end-of-life care experience and very-high-acuity capabilities. |
| Sunrise of Chevy Chase | AL MC | Silver Spring (Rock Creek Gardens) | 196
Facility
196
MD AVG
42
Rank
#10 / 684 | No |
71
Facility
71
MD AVG
45
Rank
#175 / 953 | Studio / 1 Bed / 2 Bed | 8
Facility
8
MD AVG
21
Rank
#164 / 210 |
58% Male Residents — State Benchmarked 58% of residents are male, compared to the Maryland average of 31%. An unusually high male share for assisted living, where most facilities skew heavily female. |
42% Female Residents — State Benchmarked 42% of residents are female, compared to the Maryland average of 69%. An unusually low female share — most assisted living facilities have 65–75% female residents. |
69% White Residents — State Benchmarked 69% of residents are reported as White, compared to the Maryland average of 81%. A lower White share than the Maryland average — the community may draw a more diverse resident mix relative to other facilities in Maryland. |
28% African American Residents — State Benchmarked 28% of residents are reported as African American or Black, compared to the Maryland average of 13%. A higher African American share than the typical Maryland average — useful context when comparing cultural fit and community composition. |
3% Other Ethnicity Residents — State Benchmarked 3% of residents fall into categories other than White or African American (combined), compared to the Maryland average of 6%. This column aggregates Hispanic, Asian, multiracial, and any other labeled groups that are not classified as White or African American. Reported subgroups in this total: Hispanic (2%), Asian (1%). |
12% Residents Age 65–74 — State Benchmarked 12% of residents are 65–74, compared to the Maryland average of 13%. In line with the statewide profile for this youngest senior bracket in assisted living. |
39% Residents Age 75–84 — State Benchmarked 39% of residents are 75–84, compared to the Maryland average of 31%. A high concentration in this mid-range bracket, where residents typically need moderate support with daily activities. |
42% Residents Age 85–94 — State Benchmarked 42% of residents are 85–94, compared to the Maryland average of 44%. This is typically the most common age bracket in assisted living — this facility is in line with the statewide norm. |
6% Residents Age 95+ — State Benchmarked 6% of residents are 95 or older, compared to the Maryland average of 16%. Most residents here have not yet reached the oldest-old bracket, suggesting a younger overall community. |
| Brightview Crofton Riverwalk | AL IL MC | Crofton | 92
Facility
92
MD AVG
42
Rank
#145 / 684 | Yes |
45
Facility
45
MD AVG
45
Rank
#474 / 953 | Studio / 1 Bed / 2 Bed | 6
Facility
6
MD AVG
21
Rank
#179 / 210 |
27% Male Residents — State Benchmarked 27% of residents are male, compared to the Maryland average of 31%. This facility caters to a majority female resident pool (73% female), consistent with the broader assisted living trend where women significantly outnumber men. |
73% Female Residents — State Benchmarked 73% of residents are female, compared to the Maryland average of 69%. Women comprise the large majority, consistent with national assisted living demographics where women live longer and enter care facilities at higher rates. |
0% White Residents — State Benchmarked 0% of residents are reported as White, compared to the Maryland average of 81%. A lower White share than the Maryland average — the community may draw a more diverse resident mix relative to other facilities in Maryland. |
0% African American Residents — State Benchmarked 0% of residents are reported as African American or Black, compared to the Maryland average of 13%. A lower African American share than is typical in Maryland; local markets still vary widely. |
100% Other Ethnicity Residents — State Benchmarked 100% of residents fall into categories other than White or African American (combined), compared to the Maryland average of 6%. This column aggregates Hispanic, Asian, multiracial, and any other labeled groups that are not classified as White or African American. Reported subgroups in this total: Other (100%). | - | - | - | - |
| Bedford Court, a CCRC | AL HOS IL MC NH RC SNF | Silver Spring (International Drive) | 76
Facility
76
MD AVG
42
Rank
#173 / 684 | Yes |
64
Facility
64
MD AVG
45
Rank
#261 / 953 | Studio / 1 Bed | 34
Facility
34
MD AVG
21
Rank
#22 / 210 |
15% Male Residents — State Benchmarked 15% of residents are male, compared to the Maryland average of 31%. This facility caters to a majority female resident pool (85% female), consistent with the broader assisted living trend where women significantly outnumber men. |
85% Female Residents — State Benchmarked 85% of residents are female, compared to the Maryland average of 69%. Women comprise the large majority, consistent with national assisted living demographics where women live longer and enter care facilities at higher rates. |
95% White Residents — State Benchmarked 95% of residents are reported as White, compared to the Maryland average of 81%. A higher White share than is typical for assisted living in Maryland in this dataset — compare with peer facilities for local context. |
3% African American Residents — State Benchmarked 3% of residents are reported as African American or Black, compared to the Maryland average of 13%. A lower African American share than is typical in Maryland; local markets still vary widely. |
2% Other Ethnicity Residents — State Benchmarked 2% of residents fall into categories other than White or African American (combined), compared to the Maryland average of 6%. This column aggregates Hispanic, Asian, multiracial, and any other labeled groups that are not classified as White or African American. Reported subgroups in this total: Asian (2%). |
2% Residents Age 65–74 — State Benchmarked 2% of residents are 65–74, compared to the Maryland average of 13%. Fewer younger seniors suggests the resident population skews older, likely requiring higher acuity care and more hands-on support. |
8% Residents Age 75–84 — State Benchmarked 8% of residents are 75–84, compared to the Maryland average of 31%. Below the state norm — the resident mix may skew either younger or older than this typical middle bracket. |
65% Residents Age 85–94 — State Benchmarked 65% of residents are 85–94, compared to the Maryland average of 44%. A high concentration of very elderly residents signals a higher-acuity facility with experience caring for advanced age-related needs. |
26% Residents Age 95+ — State Benchmarked 26% of residents are 95 or older, compared to the Maryland average of 16%. A high proportion of the oldest-old suggests strong end-of-life care experience and very-high-acuity capabilities. |
| Bedford Court | AL HOS IL MC NH RC SNF | Silver Spring (International Drive) | 76
Facility
76
MD AVG
42
Rank
#173 / 684 | Yes |
66
Facility
66
MD AVG
45
Rank
#240 / 953 | Studio / 1 Bed / 2 Bed | 34
Facility
34
MD AVG
21
Rank
#22 / 210 |
15% Male Residents — State Benchmarked 15% of residents are male, compared to the Maryland average of 31%. This facility caters to a majority female resident pool (85% female), consistent with the broader assisted living trend where women significantly outnumber men. |
85% Female Residents — State Benchmarked 85% of residents are female, compared to the Maryland average of 69%. Women comprise the large majority, consistent with national assisted living demographics where women live longer and enter care facilities at higher rates. |
95% White Residents — State Benchmarked 95% of residents are reported as White, compared to the Maryland average of 81%. A higher White share than is typical for assisted living in Maryland in this dataset — compare with peer facilities for local context. |
3% African American Residents — State Benchmarked 3% of residents are reported as African American or Black, compared to the Maryland average of 13%. A lower African American share than is typical in Maryland; local markets still vary widely. |
2% Other Ethnicity Residents — State Benchmarked 2% of residents fall into categories other than White or African American (combined), compared to the Maryland average of 6%. This column aggregates Hispanic, Asian, multiracial, and any other labeled groups that are not classified as White or African American. Reported subgroups in this total: Asian (2%). |
2% Residents Age 65–74 — State Benchmarked 2% of residents are 65–74, compared to the Maryland average of 13%. Fewer younger seniors suggests the resident population skews older, likely requiring higher acuity care and more hands-on support. |
8% Residents Age 75–84 — State Benchmarked 8% of residents are 75–84, compared to the Maryland average of 31%. Below the state norm — the resident mix may skew either younger or older than this typical middle bracket. |
65% Residents Age 85–94 — State Benchmarked 65% of residents are 85–94, compared to the Maryland average of 44%. A high concentration of very elderly residents signals a higher-acuity facility with experience caring for advanced age-related needs. |
26% Residents Age 95+ — State Benchmarked 26% of residents are 95 or older, compared to the Maryland average of 16%. A high proportion of the oldest-old suggests strong end-of-life care experience and very-high-acuity capabilities. |
Financial Assistance for
Assisted Living in Maryland
Brightview Crofton Riverwalk is located in Crofton, Maryland.
Here are the financial assistance programs available to residents in Maryland.
Frequently Asked Questions about Brightview Crofton Riverwalk
Who is the owner of Brightview Crofton Riverwalk?
Brightview Crofton Riverwalk is legally operated by Brightview Senior Living.
Is Brightview Crofton Riverwalk in a walkable area?
Brightview Crofton Riverwalk has a walk score of 45. Somewhat walkable. A few nearby services may be reachable on foot, but most trips require transportation.
How long has Brightview Crofton Riverwalk been in business?
Brightview Crofton Riverwalk has been operating for approximately 6 years, based on available licensing and registration records.
Are pets allowed at Brightview Crofton Riverwalk?
Yes, Brightview Crofton Riverwalk allows residents to bring their pets.
How many beds does Brightview Crofton Riverwalk have?
Brightview Crofton Riverwalk has 92 beds.
Are there photos of Brightview Crofton Riverwalk?
Yes — there are 4 photos of Brightview Crofton Riverwalk in the photo gallery on this page.
What is the address of Brightview Crofton Riverwalk?
Brightview Crofton Riverwalk is located at 1301 Clarity Dr, Crofton, MD 21114.
Guides for Better Senior Living
Care Cost Calculator: See Prices in Your Area
Assisted Living Explorer
Don’t Wait Too Long: 7 Red Flag Signs Your Parent Needs Assisted Living Now
The True Cost of Assisted Living in 2025 – And How Families Are Paying For It
Understanding Senior Living Costs: Pricing Models, Discounts & Financial Assistance
Updated on
