Brookdale Rosehill
Nursing Home & Assisted Living · Kansas, KS
CMS overall rating Info CMS (the Centers for Medicare & Medicaid Services) is the federal agency that rates nursing home quality. Its Overall Rating runs from 1 to 5 stars, combining health inspections, staffing, and quality measures, with inspections weighted most heavily.

Brookdale Rosehill

Nursing Home & Assisted Living · Kansas, KS
CMS overall rating Info CMS (the Centers for Medicare & Medicaid Services) is the federal agency that rates nursing home quality. Its Overall Rating runs from 1 to 5 stars, combining health inspections, staffing, and quality measures, with inspections weighted most heavily.
Calculator: See prices in your area
Brookdale Rosehill accepts Medicare and private pay.

Overview of Brookdale Rosehill

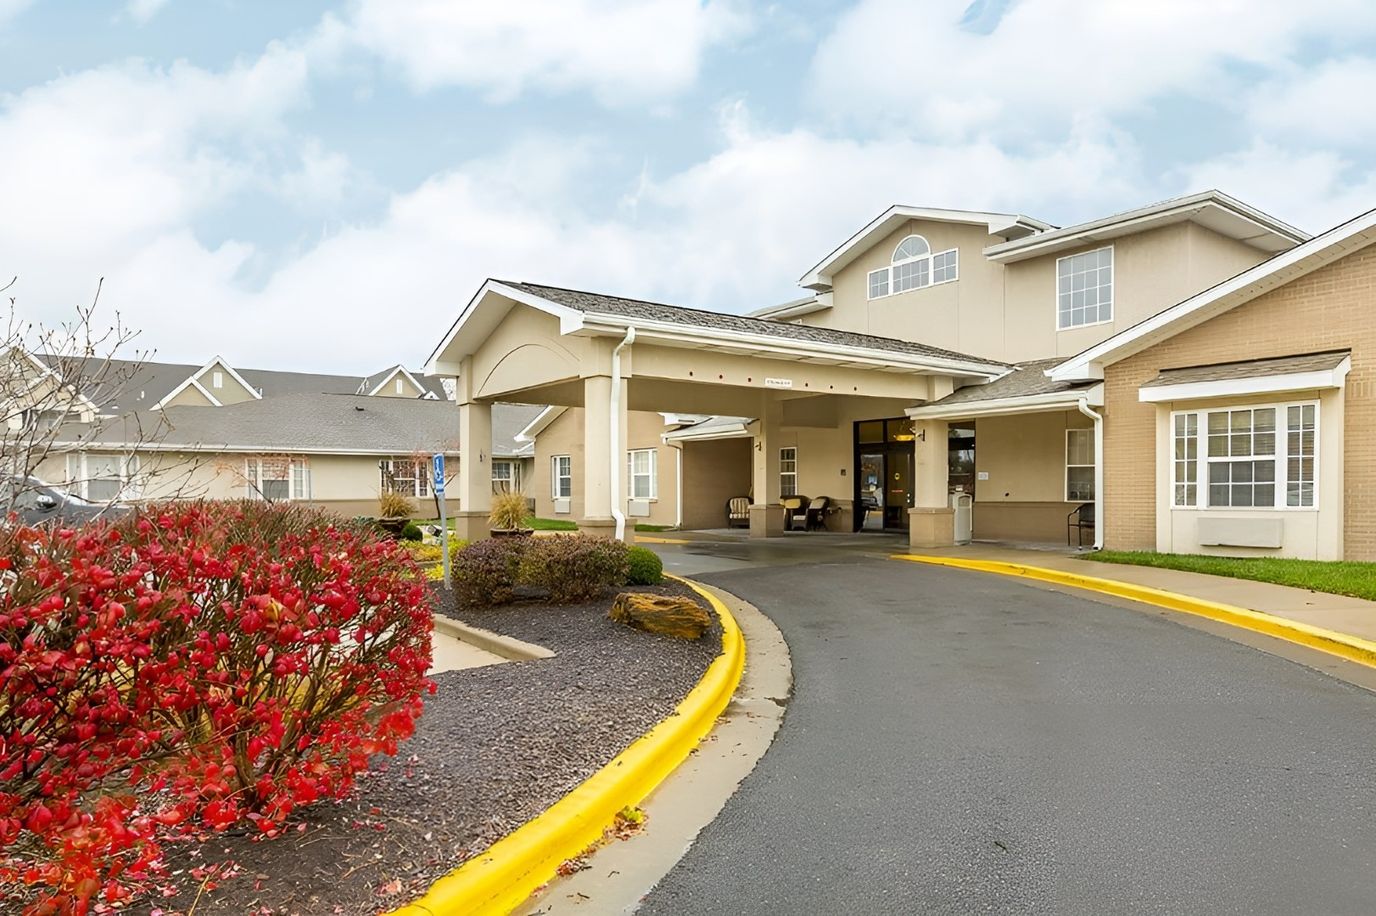
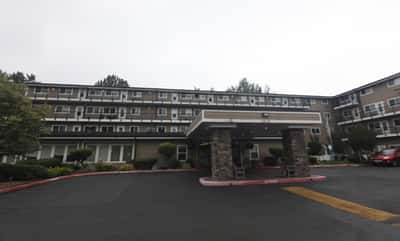
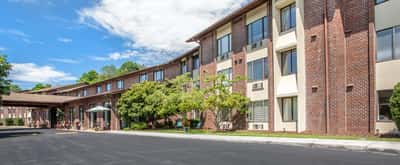
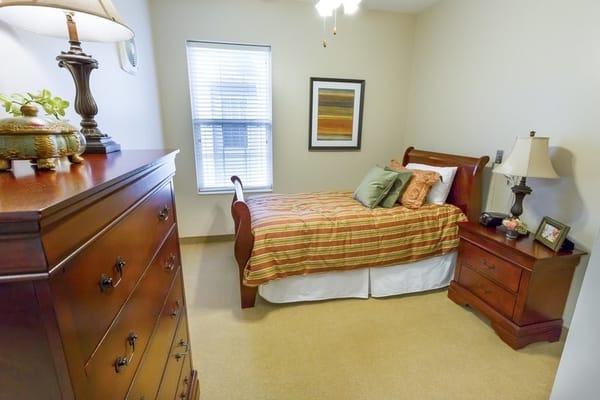
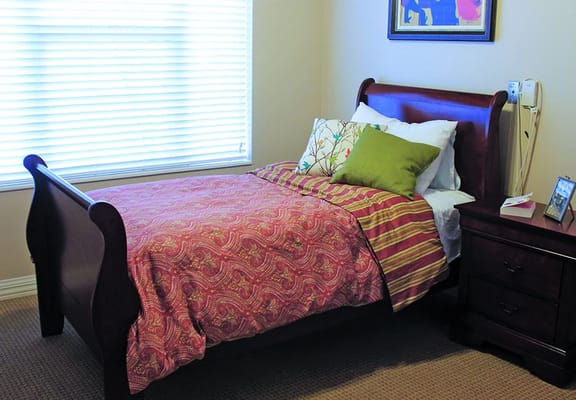
Enjoy a rewarding retirement lifestyle at Brookdale Rosehill, a charming senior living community set in Shawnee, Kansas, offering assisted living and a wide range of medical care, including respite stays, short-term care, long-term skilled care, short-stay transitional care, and hospice care. With several apartment floor plans, including apartments with kitchenettes, residents have a lot of great options to choose from.

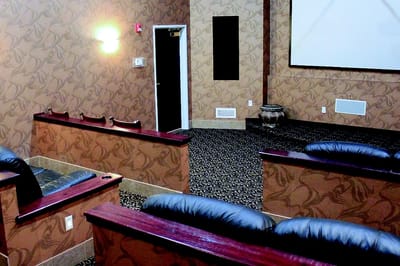
At Brookdale Rosehill, residents live a maintenance-free lifestyle with the care that matches their needs even as they change. Whether you need long-term care while recovering from surgery or an extra hand with daily activities like medication management or grooming, Brookdale Rosehill has it all for you. Here, residents also enjoy plenty of activities curated from their interests and passions and a host of amenities dedicated to their wellness and enjoyment. With an excellent dining program, residents also enjoy fresh, made-from-scratch meals with seasonal menu options that change. A theater, chapel, piano, beauty/barber shop, a library, ice cream parlor, and a therapy room are just some of the wonderful amenities within the community.

(913) 962-7600

Quality ratings

Measured by Centers for Medicare & Medicaid Services (CMS)

Overall rating Info The Overall CMS Rating combines results from health inspections, staffing levels and quality measures. Health inspections carry the most weight. Staffing and quality scores can increase or decrease the final rating based on performance compared to state and national standards.
▲ 72.9% Above KS avg. ▲ 72.9% Above KS avg.KS average: 2.9Click the badge to see the full State ranking.Click here to see the full State ranking.
Health Inspection Info Based on the results of the facility's three most recent standard inspections and any complaint investigations. CMS reviews the number, scope, and severity of deficiencies, with more recent findings weighted more heavily.
▲ 8.6% Above KS avg. ▲ 8.6% Above KS avg.KS average: 2.8Click the badge to see the full State ranking.Click here to see the full State ranking.
Staffing Info Measures average nursing staff hours per resident per day, including Registered Nurses (RNs) and total nursing staff. Ratings are adjusted based on the level of care residents require and are compared to state and national benchmarks.
▲ 44.6% Above KS avg. ▲ 44.6% Above KS avg.KS average: 3.5Click the badge to see the full State ranking.Click here to see the full State ranking.
Quality Measures Info Based on clinical and physical health indicators reported to CMS, such as hospital readmissions, falls, pressure ulcers, and improvements in mobility. These measures reflect how well residents' health needs are being managed.
▲ 61.7% Above KS avg. ▲ 61.7% Above KS avg.KS average: 3.1Click the badge to see the full State ranking.Click here to see the full State ranking.

Staffing hours breakdown

Info Daily nursing hours per resident by staff type, reported to CMS. Higher is generally better — compare this facility to state and national averages to see where staffing stands.

Hours per resident per day — compared to Kansas state averages

Total nursing care / resident Info Total adjusted nursing hours per resident per day, combining RN, LPN, and aide time. CMS adjusts this for case-mix so facilities can be fairly compared.
4h 16m per day
This facility Kansas avg (4h 38m per day)
vs Kansas avg
-8%

1 of 6 metrics below state avg

Standout metric Physical Therapist is +219% above state avg
Staff typeHours / Day / Residentvs state avg
Registered Nurse (RN) Info RNs hold the highest nursing license and can assess residents, interpret test results, and direct care plans. More RN hours per day often signals stronger clinical oversight and faster response to health changes. 1h 19m per day ▲ 84% State avg: 43m per day · National avg: 41m per day
LPN / LVN Info Licensed Practical Nurses (LPNs) or Licensed Vocational Nurses (LVNs) deliver routine hands-on care — medication administration, wound dressing, and monitoring vital signs. They work under RN supervision and make up a large share of daily bedside care. 57m per day ▲ 42% State avg: 40m per day · National avg: 52m per day
Nurse Aide Info Certified Nurse Aides (CNAs) provide the most direct day-to-day assistance: bathing, dressing, feeding, and mobility. Nurse aide hours are typically the largest staffing category and directly affect residents' quality of life. 1h 57m per day ▼ 27% State avg: 2h 41m per day · National avg: 2h 20m per day
Weekend Total Nursing Info Combined nursing hours (RN + LPN + Nurse Aide) per resident per day on weekends. Staffing often drops on weekends — this figure reveals whether the facility maintains adequate coverage outside of weekday hours. 3h 51m per day ▲ 7% State avg: 3h 35m per day · National avg: 3h 26m per day
Physical Therapist Info Hours per resident per day provided by licensed Physical Therapists (PTs) or PT Assistants. PT services help residents recover mobility after injury or illness and are especially important for post-acute (short-stay) rehabilitation. 6m per day ▲ 219% State avg: 2m per day · National avg: 4m per day
Weekend RN Info Registered nurse hours specifically on weekends. Facilities sometimes reduce RN presence on Saturdays and Sundays — a low weekend RN figure compared to weekday hours can indicate reduced clinical oversight when most administrative staff are absent. 1h 15m per day ▲ 151% State avg: 30m per day · National avg: 28m per day

Capacity and availability

This home usually has availability

Higher occupancy than the Kansas average: 79.5%
Occupancy rate
81.5%
Avg. Length of Stay
30 days
Bed community size
92-bed community Rank #45 / 224Bed count — State benchmarkedThis home is ranked 45th out of 224 homes in Kansas. Shows this facility's certified or reported bed count compared to other Kansas facilities. Larger communities may offer more amenities, programs, and on-site services for residents and families.Ranking totals vary by category as each rank only includes facilities that report data for that metric. Homes missing that data point aren't included in the ranking.Click the rank badge to see the full State ranking.Click here to see the full State ranking.
A larger shared setting that may offer more common spaces and organized community services.
Years in operation
48 years in operation
A longer operating history, which may indicate experience navigating regulations and delivering ongoing care.
Walk Score
Walk Score: 54 / 100 Rank #138 / 363Walk Score — State benchmarkedThis home is ranked 138th out of 363 homes in Kansas. Shows how walkable this facility's neighborhood is compared to the average Walk Score across Kansas facilities. Higher scores benefit residents, families, and staff.Ranking totals vary by category as each rank only includes facilities that report data for that metric. Homes missing that data point aren't included in the ranking.Click the rank badge to see the full State ranking.Click here to see the full State ranking.
Moderately walkable. Some errands can be accomplished on foot, with a mix of nearby amenities.
BBB Rating
BBB Rating: A+ (Not Accredited)
An independent rating from the Better Business Bureau based on factors such as complaint history, transparency, and business practices.
How BBB ratings work

About this community

License Details

CMS Certification Number175478

Safety & Compliance

Emergency SystemsYes

Staffing

Key information about the people who lead and staff this community.

Leadership

ContactMs. Denise Warren, Interim CEO

Therapy & Rehabilitation

3 services
Rehabilitation Services
Respite Care
Short-Term Rehab

Staffing & Medical

1 service
24-Hour Staffing

Amenities & Lifestyle

Pet Friendly
Planned Social Events/Entertainment
Transportation
Library
Concierge Service
Beauty/Barber Shop
Chapel
Private Dining Room
Arts & Crafts Studio
Game Room
Theatre
Walking Paths
Landscaped Grounds
Meeting Rooms
Ice Cream Parlor
Piano
Specific ProgramsGardening Club, tai chi sessions, Creative Writers’ Group, Book Club, Music Appreciation Group, Veterans Club
Touring HoursMon - Fri: 8am - 9pm CT / Sat: 9am - 5:30pm CT

Pricing & Financial Information

Starting Price$6,270 per month

Contact Brookdale Rosehill

Inspection History

In Kansas, the Department for Aging and Disability Services, Survey and Certification Commission performs the unannounced inspections required for facility licensing and federal certification.

Since 2022 · 4 years of data 36 deficiencies 5 inspections

Inspection Scorecard Info This scorecard compares key inspection, citation, and complaint metrics at this facility against the Kansas state average. Metrics rated ≥15% worse than average are highlighted in red; those ≥15% better are highlighted in green.

Since 2022 vs. Kansas state average
Overall vs. KS average 1 Worse Metrics worse than Kansas average:
• Deficiencies per inspection (132% above)
3 Better Metrics better than Kansas average:
• Total deficiencies (64% below)
• Deficiencies per year (64% below)
• Total inspections (84% below)
Latest Inspection December 10, 2025 Annual Inspection

Deficiencies Info Deficiencies are formal regulatory issues recorded during state inspections.

This FacilityKS Averagevs. KS Avg
Total deficiencies Info Formal regulatory issues recorded by inspectors across all inspection types. 36100 This facility has 64% fewer total deficiencies than a typical Kansas nursing home (36 vs. KS avg 100).↓ 64% better
Deficiencies per year Info Average deficiencies per year since 2022. 925 This facility has 64% fewer deficiencies per year than a typical Kansas nursing home (9 vs. KS avg 25).↓ 64% better
Deficiencies per inspection Info Average deficiencies per inspection. 7.23.1 This facility has 132% more deficiencies per inspection than a typical Kansas nursing home (7.2 vs. KS avg 3.1).↑ 132% worse

Inspections Info State inspections evaluate whether the facility meets health and safety standards.

This FacilityKS Averagevs. KS Avg
Total inspections Info Combined count of all routine and focused inspections. Excludes complaint investigations. 532 This facility has 84% fewer total inspections than a typical Kansas nursing home (5 vs. KS avg 32).↓ 84% better

Health Inspection History

Inspections since 2020
Total health inspections 4

Kansas average 4.5


Last Health inspection on Jan 2024

Total health citations
35

Kansas average 26.9

Citations per inspection
8.75

Kansas average 6.07


Health citations are formal notices following inspections when they fail to comply with safety and care standards.

33 of 35 citations resulted from standard inspections; and 2 of 35 resulted from complaint investigations.

Breakdown of citation severity (last 6 years)
Critical health citations
0
100% better than Kansas average

Kansas average: 0.9


Serious health citations
0
100% better than Kansas average

Kansas average: 0.9

0 critical citations Kansas average: 0.9

0 serious citations Kansas average: 0.9

34 moderate citations Kansas average: 24.6

1 minor citation Kansas average: 0.5
Citations history (last 6 years)
Pharmacy moderate citation Jan 30, 2024
Corrected

Quality of Care moderate citation Jan 30, 2024
Corrected

Administration moderate citation Dec 19, 2023
Corrected

Infection Control moderate citation Dec 19, 2023
Corrected

Staffing Data

Reporting period: October 1 – December 31, 2025 (Q4 2025). Source: CMS Payroll-Based Journal report.

Total staff 139
Employees 110
Contractors 29
Staff to resident ratio 1.83 : 1
18% fewer staff per resident than Kansas average
Kansas average ratio: 2.24 : 1 Kansas average ratio: 2.24 : 1See full Kansas ranking
Avg staff/day 49
Average shift 7.2 hours
6% worse than Kansas average
Kansas average: 7.7 hours Kansas average shift: 7.7 hoursSee full Kansas ranking
Total staff hours (quarter) 32,531

Nursing staff breakdown

Q4 2025 · Oct 1 – Dec 31 More info This data comes from the CMS Payroll-Based Journal report covering October 1 – December 31, 2025.
Registered Nurse

Manages medical care and health needs.

RN Staff Info All 20 RN Staff are full-time employees. No contractors work on this role. 20
Average shift length Info Average shift length. Calculated as total hours divided by days worked and average staff per day. 8 hours
Licensed Practical Nurse

Assists with medical care and medications.

LPN Staff Info All 16 LPN Staff are full-time employees. No contractors work on this role. 16
Average shift length Info Average shift length. Calculated as total hours divided by days worked and average staff per day. 8.3 hours
Certified Nursing Assistant

Helps with daily care and mobility.

CNA Staff Info All 59 CNA Staff are full-time employees. No contractors work on this role. 59
Average shift length Info Average shift length. Calculated as total hours divided by days worked and average staff per day. 6.9 hours

Contractor staffing

Q4 2025 · Oct 1 – Dec 31 More info This data comes from the CMS Payroll-Based Journal report covering October 1 – December 31, 2025.

Total hours from contractors

11.3%

3,676 contractor hours this quarter

Physical Therapy Assistant: 9 Speech Language Pathologist: 6 Respiratory Therapy Technician: 4 Physical Therapy Aide: 3 Qualified Social Worker: 3 Occupational Therapy Assistant: 3 Medical Director: 1

Staff by category

Q4 2025 · Oct 1 – Dec 31 More info This data comes from the CMS Payroll-Based Journal report covering October 1 – December 31, 2025.
Certified Nursing Assistant5905911,79192100%6.9
Licensed Practical Nurse160165,61192100%8.3
Registered Nurse200205,58192100%8
Clinical Nurse Specialist5052,3957582%8.4
Speech Language Pathologist0661,1467683%6.3
Physical Therapy Assistant0998937278%6.2
Dental Services Staff2028216773%7.8
Medication Aide/Technician2027137076%7.4
Respiratory Therapy Technician0446837582%4.9
Nurse Practitioner1014886166%8
Administrator1014806065%8
RN Director of Nursing1014645863%8
Qualified Social Worker0334396975%5.3
Occupational Therapy Aide1014335560%7.9
Physical Therapy Aide0334186267%6.6
Dietitian202801011%8
Occupational Therapy Assistant033575257%1
Medical Director011393134%1.3
59 Certified Nursing Assistant
% of Days 100%
16 Licensed Practical Nurse
% of Days 100%
20 Registered Nurse
% of Days 100%
5 Clinical Nurse Specialist
% of Days 82%
6 Speech Language Pathologist
% of Days 83%
9 Physical Therapy Assistant
% of Days 78%
2 Dental Services Staff
% of Days 73%
2 Medication Aide/Technician
% of Days 76%
4 Respiratory Therapy Technician
% of Days 82%
1 Nurse Practitioner
% of Days 66%
1 Administrator
% of Days 65%
1 RN Director of Nursing
% of Days 63%
3 Qualified Social Worker
% of Days 75%
1 Occupational Therapy Aide
% of Days 60%
3 Physical Therapy Aide
% of Days 67%
2 Dietitian
% of Days 11%
3 Occupational Therapy Assistant
% of Days 57%
1 Medical Director
% of Days 34%

Penalties and fines

Federal penalties imposed by CMS for regulatory violations, including civil money penalties (fines) and denials of payment for new Medicare/Medicaid admissions.

Source: CMS Penalties Database

No penalties in the past 3 years

No civil money penalties or payment denials were reported in the last 3 years.

Quality of care over time

These measures show how residents usually do over time at this home, based on health outcomes and preventive care.

High-risk clinical events score Info A composite score based on pressure ulcers, falls with injury, weight loss, walking ability decline, and activities of daily living decline. 10.4
In line with Kansas average

Kansas average: 10.5

Functional decline score Info A composite score based on activities of daily living decline, walking ability decline, and incontinence. 17.1
17% better than Kansas average

Kansas average: 20.7

Long-stay resident measures
Above average Kansas avg: 3.0 Info CMS star rating based on long-stay quality measure performance. 5 stars = significantly above average, 1 star = significantly below average.
Need for Help with Daily Activities Increased Info Percent of long-stay residents whose need for help with daily activities has increased 15.2%
20% better than Kansas average

Kansas average: 19.0%

Walking Ability Worsened Info Percent of long-stay residents whose ability to move independently worsened 17.3%
11% better than Kansas average

Kansas average: 19.4%

Low Risk Residents with Bowel/Bladder Incontinence Info Percent of low risk long-stay residents who lose control of their bowels or bladder 19.0%
20% better than Kansas average

Kansas average: 23.8%

Falls with Major Injury Info Percent of long-stay residents experiencing one or more falls with major injury 8.8%
99% worse than Kansas average

Kansas average: 4.4%

High Risk Residents with Pressure Ulcers Info Percent of long-stay high risk residents with pressure ulcers 6.2%
32% worse than Kansas average

Kansas average: 4.6%

Urinary Tract Infection Info Percent of long-stay residents with a urinary tract infection 9.1%
190% worse than Kansas average

Kansas average: 3.1%

Lost Too Much Weight Info Percent of long-stay residents who lose too much weight 4.7%
9% better than Kansas average

Kansas average: 5.1%

Depressive Symptoms Info Percent of long-stay residents who have depressive symptoms 2.0%
62% better than Kansas average

Kansas average: 5.2%

Antipsychotic Use Info Percent of long-stay residents who received an antipsychotic medication 9.4%
45% better than Kansas average

Kansas average: 16.9%

Pneumococcal Vaccine Info Percent of long-stay residents assessed and appropriately given the pneumococcal vaccine 100.0%
9% better than Kansas average

Kansas average: 91.9%

Influenza Vaccine Info Percent of long-stay residents assessed and appropriately given the seasonal influenza vaccine 97.8%
In line with Kansas average

Kansas average: 95.5%

Hospitalizations per 1,000 days Info Number of hospitalizations per 1,000 long-stay resident days. 2.18
18% worse than Kansas average

Kansas average: 1.84

ED visits per 1,000 days Info Number of outpatient emergency department visits per 1,000 long-stay resident days. 1.01
53% better than Kansas average

Kansas average: 2.16

Short-stay resident measures
Significantly above average Kansas avg: 2.6 Info CMS star rating based on short-stay quality measure performance. 5 stars = much above average, 1 star = much below average.
Pneumococcal Vaccine Info Percent of short-stay residents assessed and appropriately given the pneumococcal vaccine 97.7%
29% better than Kansas average

Kansas average: 75.6%

Antipsychotic medication increase Info Percent of short-stay residents who newly received an antipsychotic medication 0.3%
86% better than Kansas average

Kansas average: 2.2%

Influenza Vaccine Info Percent of short-stay residents assessed and appropriately given the seasonal influenza vaccine 97.9%
33% better than Kansas average

Kansas average: 73.5%

Re-hospitalized after SNF stay Info Percentage of short-stay residents who were re-hospitalized after their nursing home admission. 19.5%
15% better than Kansas average

Kansas average: 23.0%

Emergency department visits Info Percentage of short-stay residents who had an outpatient emergency department visit. 7.4%
37% better than Kansas average

Kansas average: 11.7%

Falls with major injury Info Percentage of SNF residents who experience falls with major injury during their stay. 0.5%
36% better than Kansas average

Kansas average: 0.8%

Ability to care for self at discharge Info Percentage of residents at or above expected ability to care for themselves at discharge. 72.8%
36% better than Kansas average

Kansas average: 53.7%

Successful return to home or community Info Rate of successful return to home or community from a skilled nursing facility. 65.1%
29% better than Kansas average

Kansas average: 50.6%

Breakdown by payment type

Medicare

30% of new residents, usually for short-term rehab.

Typical stay 25 days

Private pay

70% of new residents, often for short stays.

Typical stay 1 - 2 months

Facility Characteristics

Source: CMS Long-Term Care Facility Characteristics (Data as of Jan 2026)

Total residents 76
Medicare
41
53.9% of residents
Medicaid
17
22.4% of residents
Private pay or other
18
23.7% of residents
Programs & Services
Residents Group

Residents meet regularly to discuss policies, care quality, and activities

Nurse Aide Training

State-approved Nurse Aide Training and Competency Evaluation Program on-site

CCRC

Part of a Continuing Care Retirement Community offering multiple care levels

Active Resident Council

Organized group of residents that meets regularly to discuss facility policies, quality of life, and activities.

Finances and operations

Based on CMS SNF Cost Report for fiscal year ending in 12/2023.

Voluntary non-profit community
Operated by a church.
Net patient revenue Info Net patient revenue — what the home actually collects for resident care, after contractual allowances, bad debt and discounts are subtracted from its gross charges (CMS cost report, Worksheet G-3). It covers resident care only; money the home earns from other sources is shown separately as "Other income."
$15.7M
Net patient income Info Net patient income: net patient revenue minus the home's total operating expenses. A positive figure means it earns more from resident care than it spends to deliver it; a negative figure means the opposite. It excludes non-operating "other income."
$177.6K
Voluntary non-profit community Operated by a church.
Net patient revenue Info Net patient revenue — what the home actually collects for resident care, after contractual allowances, bad debt and discounts are subtracted from its gross charges (CMS cost report, Worksheet G-3). It covers resident care only; money the home earns from other sources is shown separately as "Other income."
$15.7M
Net patient income Info Net patient income: net patient revenue minus the home's total operating expenses. A positive figure means it earns more from resident care than it spends to deliver it; a negative figure means the opposite. It excludes non-operating "other income."
$177.6K
Other income Info Money the home earns outside of resident care — such as investments, grants, rentals and other non-operating sources (CMS cost report, Worksheet G-3). It is tracked separately from net patient revenue: it is not part of that figure, and it is not included in net patient income.
$96.5K
Payroll costs Info Staff salaries plus wage-related costs — benefits such as payroll taxes, health insurance and retirement — from the home's own accounting records (CMS cost report, Worksheet A). Contract or agency labor is counted separately, under other operating costs.
$7.5M 48% of net patient revenue Info Payroll as a share of revenue: staff salaries and wage-related benefits divided by net patient revenue. A higher figure means more of each revenue dollar goes to staff pay.
Other operating costs Info Everything it costs to run the home apart from payroll — food, utilities, supplies, maintenance, contract labor and administration. Calculated as total operating expense minus payroll (staff salaries and wage-related benefits).
$8.0M
Total costs Info The home's total operating expense for the year — all the costs of running it, salaries included (CMS cost report, Worksheet G-3).
$15.5M

What does this home offer?

Pets allowed icon
Pets allowed icon

Pets Allowed

Housing options icon

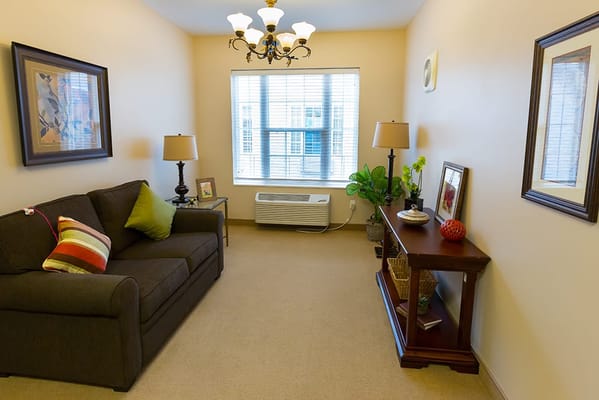
Housing Options: Studio / 1 Bed

Building type icon
Building type icon

Building Type: 2-story

Transportation services icon

Transportation Services

Fitness and recreation icon

Fitness and Recreation

Type of Rooms Available

Studio
Studio
1
1 Bed
1 Bed
1 / 4
1 Bed
1

Who this home usually serves

TYPE OF STAY

Primarily short stays

Residents typically stay for brief periods, with frequent admissions and discharges throughout the year.

Most new residents arrive under private pay (70% of admissions), and a typical private pay stay runs around 1 - 2 months.

Admissions
884 total

Coverage residents most often arrive under.

Medicare 30%
Private pay 70%
Discharges
912 total

Coverage residents most often leave under.

Medicare 39%
Private pay 61%

Living Spaces & Floor Plans for Brookdale Rosehill

Floor Plan
Download PDF

Places of interest near Brookdale Rosehill

Address 1.1 miles from city center Info Estimated distance in miles from Shawnee's city center to Brookdale Rosehill's address, calculated via Google Maps. — 2.97 miles to nearest hospital (AdventHealth Shawnee Mission)

Calculate Travel Distance to Brookdale Rosehill

Add your location

Address

Compare Nursing Home around Kansas

The information below is reported by the Kansas Department for Aging and Disability Services.

5 facilities compared · CMS & KS Dept. of Health data

Lexington Park Assisted Living
NH
AL
IL
Topeka (West Southwest 2)
60
Facility 60
KS AVG 69
Rank #94 / 224
83.9% +6%4.49 -50%-3%$082.7-80A+
60
Facility 60
KS AVG 46
Rank #99 / 363
Floyd Eaton$8.4M$4.3M51.3%175154
Ascension Living Via Christi Village McLean
NH
AL
IL
MC
Wichita (Indian Hills)
95
Facility 95
KS AVG 69
Rank #43 / 224
33.7% -58%4.47 +4%-4%$0147.0134-
47
Facility 47
KS AVG 46
Rank #186 / 363
Abigail Poff$7.8M$3.5M44.1%175543
Brookdale Rosehill
NH
AL
Shawnee
92
Facility 92
KS AVG 69
Rank #45 / 224
81.5% +3%4.27 +42%-8%$0358.8-70A+
54
Facility 54
KS AVG 46
Rank #138 / 363
Mary Patchett$15.7M$7.5M48%175478
Lakeview Village
NH
AL
IL
Lenexa
184
Facility 184
KS AVG 69
Rank #3 / 224
69.6% -12%7.23 -23%+56%$35.6k184.52115A+
54
Facility 54
KS AVG 46
Rank #138 / 363
Lakeview Village, Inc.$44.4M$29.7M66.9%175242
Colonial Village Overland Park
NH
AL
IL
MC
Overland Park
82
Facility 82
KS AVG 69
Rank #56 / 224
84.1% +6%4.73 -36%+2%$0289.3137-
45
Facility 45
KS AVG 46
Rank #199 / 363
Dan Chik$10.0M$3.5M35.3%175560

Financial Assistance for
Nursing Home in Kansas

Brookdale Rosehill is located in Shawnee, Kansas.
Here are the financial assistance programs available to residents in Kansas.

Get Financial aid guidance

Frail Elderly Waiver

Kansas Medicaid FE Waiver

Age 65+
General Kansas resident, Medicaid-eligible, nursing home- level care need.
Income Limits (2025) ~$2,829/month 300% FBR, individual
Asset Limits $2,000 (individual), $3,000 (couple).
KS

Requires care level assessment.

Benefits
Personal care (5-7 hours/day) Respite (240 hours/year) Adult day care (~$60/day) Home aides

Senior Care Act

Kansas SCA

Age 60+
General Kansas resident, at risk of nursing home.
Income Limits ~$1,800/month individual, varies
Asset Limits $2,000 individual
KS

Limited funding; waitlists common.

Benefits
In-home care (3-5 hours/week) Respite (up to 10 days/year) Homemaker services

Medicare Savings Program (MSP)

Kansas Medicare Savings Program

Age 65+ or disabled
General Kansas resident, Medicare Part A/B.
Income Limits (2025) ~$2,510/month (QMB), ~$3,380/month (SLMB), ~$3,598/month (QI)—individual.
Asset Limits $9,430 (individual), $14,130 (couple).
KS

Three tiers; no waitlist.

Benefits
Covers Part B premiums ($174.70/month) Deductibles ($240/year) Copays (~20%)

National Family Caregiver Support Program (NFCSP) Respite

Kansas NFCSP Respite Care

Age
General Caregivers of 60+ needing care or 55+ caregivers of others; Kansas resident; functional needs (2+ ADLs).
Income Limits (2025) Prioritizes ~$24,980/year (individual); no strict cap.
Asset Limits Not assessed; need-based.
KS

11 AAAs; prioritizes low-income, rural caregivers.

Benefits
Respite (4-6 hours/week or 5 days/year) Adult day care ($60/day) Caregiver training

VA Aid and Attendance (A&A) and Housebound Benefits

Kansas VA Aid and Attendance/Housebound

Age 65+ or disabled veteran/spouse
General Kansas resident, wartime service, need for ADL help (A&A) or homebound.
Income Limits (2025) Net income < ~$1,984/month (veteran with dependent, A&A); pension offsets income.
Asset Limits ~$155,356 net worth limit
KS

High veteran demand in rural/urban areas.

Benefits
Cash (~$1,433-$2,642/month veteran, ~$951-$1,318 spouse) for care costs (e.g., in-home, assisted living)

More homes from the same operator

Operated by Brookdale

Frequently Asked Questions about Brookdale Rosehill

Is Brookdale Rosehill in a walkable area?

Brookdale Rosehill has a walk score of 54. Moderately walkable. Some errands can be accomplished on foot, with a mix of nearby amenities.

What is the occupancy rate at Brookdale Rosehill?

Brookdale Rosehill's occupancy is 76.2%.

Does Brookdale Rosehill have different floorplan options?

Yes — see the floorplan options available at Brookdale Rosehill on this page.

Are there photos of Brookdale Rosehill?

Yes — there are 5 photos of Brookdale Rosehill in the photo gallery on this page.

What is the phone number of Brookdale Rosehill?

(913) 962-7600 will put you in contact with the team at Brookdale Rosehill.

Is Brookdale Rosehill Medicare or Medicaid certified?

Yes — Brookdale Rosehill is a CMS-certified provider of Medicare and Medicaid.

Guides for Better Senior Living

Care Cost Calculator: See Prices in Your Area

Nursing Home Data Explorer

Don’t Wait Too Long: 7 Red Flag Signs Your Parent Needs Assisted Living Now

The True Cost of Assisted Living in 2025 – And How Families Are Paying For It

Understanding Senior Living Costs: Pricing Models, Discounts & Financial Assistance