Buckeye Forest at Fairfield
Nursing Home, Assisted Living, Memory Care & Respite Care · Fairfield, OH
CMS overall rating Info CMS (the Centers for Medicare & Medicaid Services) is the federal agency that rates nursing home quality. Its Overall Rating runs from 1 to 5 stars, combining health inspections, staffing, and quality measures, with inspections weighted most heavily.

Buckeye Forest at Fairfield

Nursing Home, Assisted Living, Memory Care & Respite Care · Fairfield, OH
CMS overall rating Info CMS (the Centers for Medicare & Medicaid Services) is the federal agency that rates nursing home quality. Its Overall Rating runs from 1 to 5 stars, combining health inspections, staffing, and quality measures, with inspections weighted most heavily.
Calculator: See prices in your area
Buckeye Forest at Fairfield accepts Medicare, Medicaid, and private pay.

Overview of Buckeye Forest at Fairfield

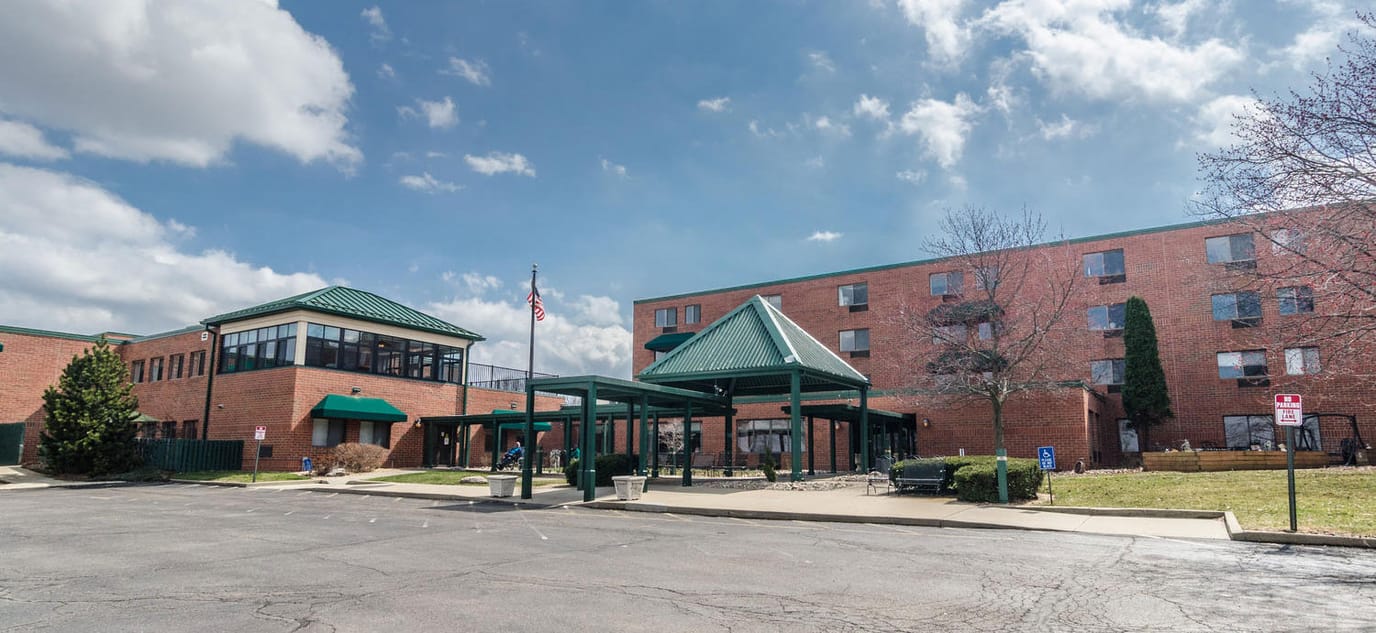
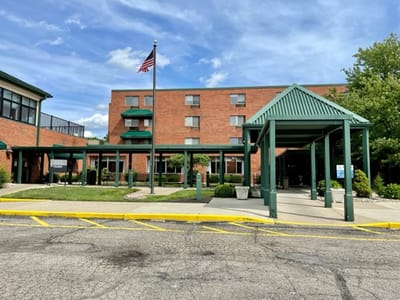
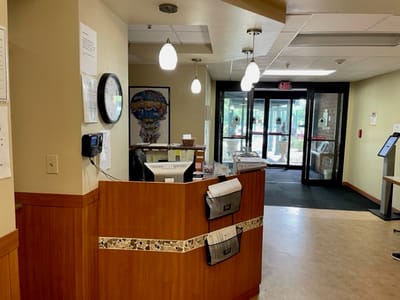
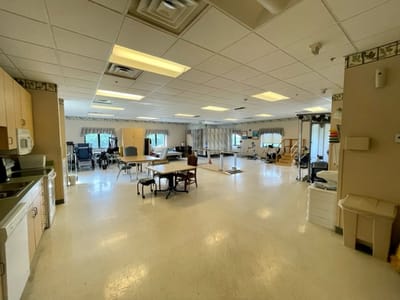
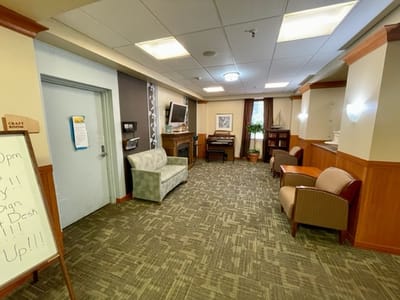
Buckeye Forest at Fairfield is a nursing home in Fairfield, OH, offering assisted living, memory care, respite care, and skilled nursing. With its supportive and home-like environment, the community ensures older adults can feel at ease during their stay. 24-hour care, dietitian-approved meals, and social services are among the excellent services provided to enrich residents’ living experiences. Through person-centered care, the community strives to meet residents’ unique needs and habits to ensure they recover with ease and live to their potential.

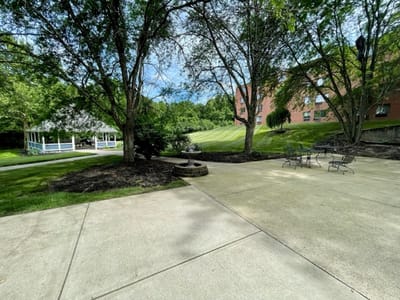
Live entertainment, games, and exercises encourage residents to live actively and make friends. Well-lit living areas and lively gathering spaces are also available, so residents can live comfortably and safely. Set in the tree-lined neighborhood of Fairfield, the community guarantees a stress-free retirement. This nursing home is one of the best choices for senior living in Ohio, especially with its top-notch services and well-maintained amenities.

Quality ratings

Measured by Centers for Medicare & Medicaid Services (CMS)

Overall rating Info The Overall CMS Rating combines results from health inspections, staffing levels and quality measures. Health inspections carry the most weight. Staffing and quality scores can increase or decrease the final rating based on performance compared to state and national standards.
▼ 68.6% Below OH avg. ▼ 68.6% Below OH avg.OH average: 3.2Click the badge to see the full State ranking.Click here to see the full State ranking.
Health Inspection Info Based on the results of the facility's three most recent standard inspections and any complaint investigations. CMS reviews the number, scope, and severity of deficiencies, with more recent findings weighted more heavily.
▼ 64.3% Below OH avg. ▼ 64.3% Below OH avg.OH average: 2.8Click the badge to see the full State ranking.Click here to see the full State ranking.
Staffing Info Measures average nursing staff hours per resident per day, including Registered Nurses (RNs) and total nursing staff. Ratings are adjusted based on the level of care residents require and are compared to state and national benchmarks.
▼ 59.1% Below OH avg. ▼ 59.1% Below OH avg.OH average: 2.4Click the badge to see the full State ranking.Click here to see the full State ranking.
Quality Measures Info Based on clinical and physical health indicators reported to CMS, such as hospital readmissions, falls, pressure ulcers, and improvements in mobility. These measures reflect how well residents' health needs are being managed.
▼ 8.2% Below OH avg. ▼ 8.2% Below OH avg.OH average: 4.4Click the badge to see the full State ranking.Click here to see the full State ranking.

Staffing hours breakdown

Info Daily nursing hours per resident by staff type, reported to CMS. Higher is generally better — compare this facility to state and national averages to see where staffing stands.

Hours per resident per day — compared to Ohio state averages

Total nursing care / resident Info This home is ranked 131st out of 210 homes in Ohio for nurse hours. Total adjusted nursing hours per resident per day, combining RN, LPN, and aide time. CMS adjusts this for case-mix so facilities can be fairly compared.
3h 15m per day
Rank #131 / 210Nurse hours — State benchmarkedThis home is ranked 131st out of 210 homes in Ohio. Shows adjusted nurse hours per resident per day benchmarked to the Ohio average, with a ranking across 210 Ohio facilities. More hours mean more direct care. The national average is about 3.5 hrs; below 3.0 is a red flag.Rankings are based only on facilities in Ohio that report data for that category. Facilities without available data are excluded from the ranking.Click the rank badge to see the full State ranking.Click here to see the full State ranking.
This facility Ohio avg (3h 32m per day)
vs Ohio avg
-8%

4 of 6 metrics below state avg

Standout metric Physical Therapist is +145% above state avg
Staff typeHours / Day / Residentvs state avg
Registered Nurse (RN) Info RNs hold the highest nursing license and can assess residents, interpret test results, and direct care plans. More RN hours per day often signals stronger clinical oversight and faster response to health changes. 16m per day ▼ 58% State avg: 38m per day · National avg: 41m per day
LPN / LVN Info Licensed Practical Nurses (LPNs) or Licensed Vocational Nurses (LVNs) deliver routine hands-on care — medication administration, wound dressing, and monitoring vital signs. They work under RN supervision and make up a large share of daily bedside care. 1h 11m per day ▲ 22% State avg: 58m per day · National avg: 52m per day
Nurse Aide Info Certified Nurse Aides (CNAs) provide the most direct day-to-day assistance: bathing, dressing, feeding, and mobility. Nurse aide hours are typically the largest staffing category and directly affect residents' quality of life. 1h 44m per day ▼ 19% State avg: 2h 8m per day · National avg: 2h 21m per day
Weekend Total Nursing Info Combined nursing hours (RN + LPN + Nurse Aide) per resident per day on weekends. Staffing often drops on weekends — this figure reveals whether the facility maintains adequate coverage outside of weekday hours. 2h 55m per day ▼ 11% State avg: 3h 17m per day · National avg: 3h 26m per day
Physical Therapist Info Hours per resident per day provided by licensed Physical Therapists (PTs) or PT Assistants. PT services help residents recover mobility after injury or illness and are especially important for post-acute (short-stay) rehabilitation. 7m per day ▲ 145% State avg: 3m per day · National avg: 4m per day
Weekend RN Info Registered nurse hours specifically on weekends. Facilities sometimes reduce RN presence on Saturdays and Sundays — a low weekend RN figure compared to weekday hours can indicate reduced clinical oversight when most administrative staff are absent. 10m per day ▼ 60% State avg: 25m per day · National avg: 29m per day

Capacity and availability

This home usually has availability

Lower occupancy than the Ohio average: 78.7%
Occupancy rate
57.3% Rank #195 / 211Occupancy rate — State benchmarkedThis home is ranked 195th out of 211 homes in Ohio. Shows this facility's occupancy rate versus the Ohio average, with its Statewide rank out of 211. Higher occupancy signals strong local demand and financial stability.Rankings are based only on facilities in Ohio that report data for that category. Facilities without available data are excluded from the ranking.Click the rank badge to see the full State ranking.Click here to see the full State ranking.
Avg. Length of Stay
202 days
Bed community size
90-bed community Rank #113 / 323Bed count — State benchmarkedThis home is ranked 113th out of 323 homes in Ohio. Shows this facility's certified or reported bed count compared to other Ohio facilities. Larger communities may offer more amenities, programs, and on-site services for residents and families.Rankings are based only on facilities in Ohio that report data for that category. Facilities without available data are excluded from the ranking.Click the rank badge to see the full State ranking.Click here to see the full State ranking.
A larger shared setting that may offer more common spaces and organized community services.
Walk Score
Walk Score: 21 / 100 Rank #541 / 705Walk Score — State benchmarkedThis home is ranked 541st out of 705 homes in Ohio. Shows how walkable this facility's neighborhood is compared to the average Walk Score across Ohio facilities. Higher scores benefit residents, families, and staff.Rankings are based only on facilities in Ohio that report data for that category. Facilities without available data are excluded from the ranking.Click the rank badge to see the full State ranking.Click here to see the full State ranking.
Car-dependent. Most errands require a car, with limited nearby walkable options.

Contact Buckeye Forest at Fairfield

Staffing Data

Reporting period: October 1 – December 31, 2025 (Q4 2025). Source: CMS Payroll-Based Journal report.

Total staff 109
Employees 89
Contractors 20
Staff to resident ratio 1.63 : 1
20% fewer staff per resident than Ohio average
Ohio average ratio: 2.04 : 1 Ohio average ratio: 2.04 : 1See full Ohio ranking
Avg staff/day 34
Average shift 8.4 hours
0% compared with Ohio average
Ohio average: 8.1 hours Ohio average shift: 8.1 hoursSee full Ohio ranking
Total staff hours (quarter) 26,210

Nursing staff breakdown

Q4 2025 · Oct 1 – Dec 31 More info This data comes from the CMS Payroll-Based Journal report covering October 1 – December 31, 2025.
Registered Nurse

Manages medical care and health needs.

RN Staff Info 9 total: 8 full-time employees and 1 contractor. 9
Average shift length Info Average shift length. Calculated as total hours divided by days worked and average staff per day. 9.5 hours
Licensed Practical Nurse

Assists with medical care and medications.

LPN Staff Info 25 total: 22 full-time employees and 3 contractors. 25
Average shift length Info Average shift length. Calculated as total hours divided by days worked and average staff per day. 8.8 hours
Certified Nursing Assistant

Helps with daily care and mobility.

CNA Staff Info 46 total: 33 full-time employees and 13 contractors. 46
Average shift length Info Average shift length. Calculated as total hours divided by days worked and average staff per day. 9.4 hours

Contractor staffing

Q4 2025 · Oct 1 – Dec 31 More info This data comes from the CMS Payroll-Based Journal report covering October 1 – December 31, 2025.

Total hours from contractors

1.8%

469 contractor hours this quarter

Certified Nursing Assistant: 13 Licensed Practical Nurse: 3 Administrator: 1 Registered Nurse: 1 Occupational Therapy Assistant: 1 Medical Director: 1

Staff by category

Q4 2025 · Oct 1 – Dec 31 More info This data comes from the CMS Payroll-Based Journal report covering October 1 – December 31, 2025.
Certified Nursing Assistant33134610,68392100%9.4
Licensed Practical Nurse223256,24492100%8.8
Other Dietary Services Staff6061,6858693%7.4
Physical Therapy Aide3031,3397784%7.6
Registered Nurse8191,1838592%9.5
RN Director of Nursing3031,1216975%7.5
Speech Language Pathologist3031,1117480%6.5
Respiratory Therapy Technician3037636874%6
Nurse Practitioner1014405661%7.9
Qualified Social Worker1014346065%7.2
Administrator1124305155%8.4
Dental Services Staff1013625358%6.8
Physical Therapy Assistant2022375054%4.7
Nurse Aide in Training1011061213%8.8
Clinical Nurse Specialist1013755%7.3
Occupational Therapy Assistant0112144%5.3
Medical Director0111589%1.9
46 Certified Nursing Assistant
% of Days 100%
25 Licensed Practical Nurse
% of Days 100%
6 Other Dietary Services Staff
% of Days 93%
3 Physical Therapy Aide
% of Days 84%
9 Registered Nurse
% of Days 92%
3 RN Director of Nursing
% of Days 75%
3 Speech Language Pathologist
% of Days 80%
3 Respiratory Therapy Technician
% of Days 74%
1 Nurse Practitioner
% of Days 61%
1 Qualified Social Worker
% of Days 65%
2 Administrator
% of Days 55%
1 Dental Services Staff
% of Days 58%
2 Physical Therapy Assistant
% of Days 54%
1 Nurse Aide in Training
% of Days 13%
1 Clinical Nurse Specialist
% of Days 5%
1 Occupational Therapy Assistant
% of Days 4%
1 Medical Director
% of Days 9%

Penalties and fines

Includes penalties issued in 2023

Federal penalties imposed by CMS for regulatory violations, including civil money penalties (fines) and denials of payment for new Medicare/Medicaid admissions.

Source: CMS Penalties Database (Data as of Jan 2026)

Total fines amount $156K Rank #197 / 211Federal fines — State benchmarkedThis home is ranked 197th out of 211 homes in Ohio. Shows this facility's cumulative CMS federal fine dollars versus the Ohio average among facilities with fines, and where it ranks among 211 facilities in the pool. Lower total dollars mean a better rank.Rankings are based only on facilities in Ohio that report data for that category. Facilities without available data are excluded from the ranking.Click the rank badge to see the full State ranking.Click here to see the full State ranking.
126% higher than Ohio average

Ohio average: $69K

Number of fines 4
116% more fines than Ohio average

Ohio average: 1.9

Payment Denials Info Serious action where Medicare and/or Medicaid temporarily stops payments for new residents until issues are fixed. 1
86% more payment denials than Ohio average

Ohio average: 0.5

Fines amount comparison
This facility $156K
Ohio average $69K
Penalty History

Penalties are imposed by CMS for violations of federal nursing home regulations.

2 penalties in the past 3 years

Multiple penalties were reported in the last 3 years.

Civil Money Penalty Info Fines imposed for noncompliance, which can be assessed per day or per instance of violation. Aug 4, 2023
$142K
Payment Denial Info Serious action where Medicare and/or Medicaid temporarily stops payments for new residents until issues are fixed. Aug 4, 2023
1 days

Last updated: Jan 2026

Quality of care over time

These measures show how residents usually do over time at this home, based on health outcomes and preventive care.

High-risk clinical events score Info A composite score based on pressure ulcers, falls with injury, weight loss, walking ability decline, and activities of daily living decline. 4.2
28% better than Ohio average

Ohio average: 5.8

Functional decline score Info A composite score based on activities of daily living decline, walking ability decline, and incontinence. 10.9
14% better than Ohio average

Ohio average: 12.7

Long-stay resident measures
Significantly above average Info CMS star rating based on long-stay quality measure performance. 5 stars = significantly above average, 1 star = significantly below average.
Need for Help with Daily Activities Increased Info Percent of long-stay residents whose need for help with daily activities has increased 0.9%
86% better than Ohio average

Ohio average: 6.8%

Walking Ability Worsened Info Percent of long-stay residents whose ability to move independently worsened 0.0%
100% better than Ohio average

Ohio average: 8.9%

Low Risk Residents with Bowel/Bladder Incontinence Info Percent of low risk long-stay residents who lose control of their bowels or bladder 31.9%
45% worse than Ohio average

Ohio average: 22.0%

Falls with Major Injury Info Percent of long-stay residents experiencing one or more falls with major injury 6.0%
75% worse than Ohio average

Ohio average: 3.4%

High Risk Residents with Pressure Ulcers Info Percent of long-stay high risk residents with pressure ulcers 3.3%
16% better than Ohio average

Ohio average: 3.9%

Urinary Tract Infection Info Percent of long-stay residents with a urinary tract infection 0.4%
21% better than Ohio average

Ohio average: 0.5%

Lost Too Much Weight Info Percent of long-stay residents who lose too much weight 10.7%
73% worse than Ohio average

Ohio average: 6.2%

Depressive Symptoms Info Percent of long-stay residents who have depressive symptoms 26.2%
9% worse than Ohio average

Ohio average: 24.0%

Antipsychotic Use Info Percent of long-stay residents who received an antipsychotic medication 6.7%
20% better than Ohio average

Ohio average: 8.4%

Pneumococcal Vaccine Info Percent of long-stay residents assessed and appropriately given the pneumococcal vaccine 66.5%
28% worse than Ohio average

Ohio average: 92.4%

Influenza Vaccine Info Percent of long-stay residents assessed and appropriately given the seasonal influenza vaccine 88.4%
6% worse than Ohio average

Ohio average: 94.5%

Short-stay resident measures
Pneumococcal Vaccine Info Percent of short-stay residents assessed and appropriately given the pneumococcal vaccine 14.7%
81% worse than Ohio average

Ohio average: 78.0%

Antipsychotic medication increase Info Percent of short-stay residents who newly received an antipsychotic medication 0.0%
100% better than Ohio average

Ohio average: 1.3%

Influenza Vaccine Info Percent of short-stay residents assessed and appropriately given the seasonal influenza vaccine 28.8%
62% worse than Ohio average

Ohio average: 75.6%

Falls with major injury Info Percentage of SNF residents who experience falls with major injury during their stay. 0.0%
100% better than Ohio average

Ohio average: 0.8%

Breakdown by payment type

Medicare

19% of new residents, usually for short-term rehab.

Typical stay 1 - 2 months

Private pay

70% of new residents, often for short stays.

Typical stay 6 - 7 months

Medicaid

11% of new residents, often for long-term daily care.

Typical stay 1 - 2 years

Facility Characteristics

Source: CMS Long-Term Care Facility Characteristics (Data as of Jan 2026)

Total residents 67
Medicaid
57
85.1% of residents
Private pay or other
10
14.9% of residents
Programs & Services
Residents Group

Residents meet regularly to discuss policies, care quality, and activities

CCRC

Part of a Continuing Care Retirement Community offering multiple care levels

Active Resident Council

Organized group of residents that meets regularly to discuss facility policies, quality of life, and activities.

Finances and operations

Based on CMS SNF Cost Report for fiscal year ending in 12/2023.

For-profit
Operated by a single business entity.
Net patient revenue Info Net patient revenue — what the home actually collects for resident care, after contractual allowances, bad debt and discounts are subtracted from its gross charges (CMS cost report, Worksheet G-3). It covers resident care only; money the home earns from other sources is shown separately as "Other income."
$7.9M
Net patient income Info Net patient income: net patient revenue minus the home's total operating expenses. A positive figure means it earns more from resident care than it spends to deliver it; a negative figure means the opposite. It excludes non-operating "other income."
-$1.1M
For-profit Operated by a single business entity.
Net patient revenue Info Net patient revenue — what the home actually collects for resident care, after contractual allowances, bad debt and discounts are subtracted from its gross charges (CMS cost report, Worksheet G-3). It covers resident care only; money the home earns from other sources is shown separately as "Other income."
$7.9M Rank #121 / 210Revenue — State benchmarkedThis home is ranked 121st out of 210 homes in Ohio. Shows this facility's annual revenue compared to the Ohio average. Higher revenue generally means more resources for staffing and capital — read alongside Payroll %.Rankings are based only on facilities in Ohio that report data for that category. Facilities without available data are excluded from the ranking.Click the rank badge to see the full State ranking.Click here to see the full State ranking.
Net patient income Info Net patient income: net patient revenue minus the home's total operating expenses. A positive figure means it earns more from resident care than it spends to deliver it; a negative figure means the opposite. It excludes non-operating "other income."
-$1.1M
Other income Info Money the home earns outside of resident care — such as investments, grants, rentals and other non-operating sources (CMS cost report, Worksheet G-3). It is tracked separately from net patient revenue: it is not part of that figure, and it is not included in net patient income.
$317.5K
Payroll costs Info Staff salaries plus wage-related costs — benefits such as payroll taxes, health insurance and retirement — from the home's own accounting records (CMS cost report, Worksheet A). Contract or agency labor is counted separately, under other operating costs. Rank #106 / 210Payroll — State benchmarkedThis home is ranked 106th out of 210 homes in Ohio. Shows total annual staff payroll benchmarked to the Ohio average. Higher payroll investment relative to peers often signals better staffing and less reliance on cheaper contract labor.Rankings are based only on facilities in Ohio that report data for that category. Facilities without available data are excluded from the ranking.Click the rank badge to see the full State ranking.Click here to see the full State ranking.
$5.5M 69.4% of net patient revenue Info Payroll as a share of revenue: staff salaries and wage-related benefits divided by net patient revenue. A higher figure means more of each revenue dollar goes to staff pay. Rank #66 / 210Payroll % — State benchmarkedThis home is ranked 66th out of 210 homes in Ohio. Shows payroll as a percentage of revenue versus the Ohio average. Well-run Ohio facilities typically land around 54–64% — the top third Statewide. Below 25% may signal understaffing or heavy agency use — read with Staffing ratings.Rankings are based only on facilities in Ohio that report data for that category. Facilities without available data are excluded from the ranking.Click the rank badge to see the full State ranking.Click here to see the full State ranking.
Other operating costs Info Everything it costs to run the home apart from payroll — food, utilities, supplies, maintenance, contract labor and administration. Calculated as total operating expense minus payroll (staff salaries and wage-related benefits).
$3.6M
Total costs Info The home's total operating expense for the year — all the costs of running it, salaries included (CMS cost report, Worksheet G-3).
$9.0M

Who this home usually serves

TYPE OF STAY

Primarily short stays

Residents typically stay for brief periods, with frequent admissions and discharges throughout the year.

Most new residents arrive under private pay (70% of admissions), and a typical private pay stay runs around 6 - 7 months.

Admissions
107 total

Coverage residents most often arrive under.

Medicare 19%
Private pay 70%
Medicaid 11%
Discharges
107 total

Coverage residents most often leave under.

Medicare 19%
Private pay 70%
Medicaid 11%

Places of interest near Buckeye Forest at Fairfield

Address 4.4 miles from city center Info Estimated distance in miles from Fairfield's city center to Buckeye Forest at Fairfield's address, calculated via Google Maps.

Calculate Travel Distance to Buckeye Forest at Fairfield

Add your location

Address

Compare Nursing Homes around Fairfield

The information below is reported by the Ohio Department of Health, Bureau of Survey and Certification.

3 facilities compared · CMS & OH Dept. of Health data

Parkside
NH
HC
Fairfield
76
Facility 76
OH AVG 78
Rank #158 / 323
92.0%
Facility 92.0%
OH AVG 78.7%
Rank #57 / 211
+17%
3.38
Facility 3.38
OH AVG 3.54
Rank #115 / 210
-45%-5%
$45.8k
Facility $45.8k
OH AVG $74.0k
Rank #179 / 211
37
Facility 37
OH AVG 30.9
Rank #145 / 210
5.3
Facility 5.3
OH AVG 4.6
Rank #163 / 210
368-
56
Facility 56
OH AVG 40
Rank #186 / 705
-
$14.1M
Facility $14.1M
OH AVG $10.1M
Rank #107 / 210
$7.0M
Facility $7.0M
OH AVG $3.9M
Rank #53 / 210
49.5%
Facility 49.5%
OH AVG 40.2%
Rank #16 / 210
365363
Majestic Care of Fairfield
NH
AL
HC
IL
MC
NC
Fairfield
200
Facility 200
OH AVG 78
Rank #4 / 323
75.6%
Facility 75.6%
OH AVG 78.7%
Rank #149 / 211
-4%
2.96
Facility 2.96
OH AVG 3.54
Rank #177 / 210
-39%-16%
$0
Facility $0
OH AVG $74.0k
Rank #1 / 211
37
Facility 37
OH AVG 30.9
Rank #145 / 210
3.1
Facility 3.1
OH AVG 4.6
Rank #54 / 210
2156-
66
Facility 66
OH AVG 40
Rank #94 / 705
Kimberly Barrows
$17.6M
Facility $17.6M
OH AVG $10.1M
Rank #27 / 210
$7.7M
Facility $7.7M
OH AVG $3.9M
Rank #33 / 210
43.9%
Facility 43.9%
OH AVG 40.2%
Rank #129 / 210
365396
Buckeye Forest at Fairfield
NH
AL
MC
RC
Fairfield
90
Facility 90
OH AVG 78
Rank #113 / 323
57.3%
Facility 57.3%
OH AVG 78.7%
Rank #195 / 211
-27%
3.26
Facility 3.26
OH AVG 3.54
Rank #131 / 210
-10%-8%
$141.8k
Facility $141.8k
OH AVG $74.0k
Rank #197 / 211
58
Facility 58
OH AVG 30.9
Rank #189 / 210
5.3
Facility 5.3
OH AVG 4.6
Rank #163 / 210
268-
21
Facility 21
OH AVG 40
Rank #541 / 705
-
$7.9M
Facility $7.9M
OH AVG $10.1M
Rank #121 / 210
$5.5M
Facility $5.5M
OH AVG $3.9M
Rank #106 / 210
69.4%
Facility 69.4%
OH AVG 40.2%
Rank #66 / 210
365738

Financial Assistance for
Nursing Home in Ohio

Buckeye Forest at Fairfield is located in Fairfield, Ohio.
Here are the financial assistance programs available to residents in Ohio.

Get Financial aid guidance

PASSPORT Waiver

Ohio Medicaid PASSPORT

Age 60+
General Ohio resident, Medicaid-eligible, nursing home-level care need.
Income Limits (2025) ~$2,829/month 300% FBR, individual
Asset Limits $2,000 (individual), $3,000 (couple).
OH

Administered through regional agencies; waitlists possible.

Benefits
Personal care (5-7 hours/day) Respite (240 hours/year) Adult day care ($65/day) Home modifications ($1,500 avg.)

Ohio Home Care Program (non-Medicaid)

OH HCP

Age 60+
General Ohio resident, at risk of decline.
Income Limits ~$2,000/month individual, varies
Asset Limits $5,000 individual
OH

Limited funding; regional variation.

Benefits
In-home care (3-5 hours/week) Respite (up to 10 days/year) Transportation (~5 trips/month)

Assisted Living Waiver (ALW)

Ohio Assisted Living Waiver

Age 21+ (65+ prioritized)
General OH resident, Medicaid-eligible, NFLOC.
Income Limits (2025) ~$2,829/month (individual); QIT required.
Asset Limits $2,000 (individual), $3,000 (couple).
OH

Covers ~300 facilities; room/board not included (separate cost).

Benefits
Personal care Meals Medication management Transportation (~$3,000-$4,000/month value)

Program of All-Inclusive Care for the Elderly (PACE)

Ohio PACE (e.g., McGregor PACE)

Age 55+
General OH resident (specific counties), NFLOC, safe with PACE support.
Income Limits (2025) ~$2,829/month (Medicaid-eligible); private pay option available.
Asset Limits $2,000 (individual), $3,000 (couple) for Medicaid enrollees.
OH

Available in 9 counties (e.g., Cuyahoga, Franklin); expanding via Healthy Aging Grants.

Benefits
Personal care (5-7 hours/day) Medical care Meals Transportation Respite Therapies

Medicare Savings Program (MSP)

Ohio Medicare Savings Program

Age 65+ or disabled
General OH resident, Medicare Part A/B.
Income Limits (2025) ~$2,510/month (QMB), ~$3,380/month (SLMB), ~$3,598/month (QI)—individual.
Asset Limits $9,430 (individual), $14,130 (couple).
OH

Three tiers; includes Extra Help for Part D; no waitlist.

Benefits
Covers Part B premiums ($174.70/month) Deductibles ($240/year) Copays (~20%)

Home Energy Assistance Program (HEAP)

Ohio HEAP

Age 60+ prioritized
General OH resident, low-income household.
Income Limits (2025) ~$3,970/month individual, 185% FPL
Asset Limits Not assessed; income-focused.
OH

Covers gas, electric, oil; emergency aid via Winter/Summer Crisis Programs.

Benefits
Heating/cooling aid ($300-$1,000/season) Emergency aid ($500 max)

Family Caregiver Support Program (FCSP)

Ohio Family Caregiver Support Program

Age
General Caregivers of 60+ needing care or 55+ caregivers of others; OH resident; functional needs (2+ ADLs).
Income Limits (2025) Prioritizes ~$24,980/year (individual); no strict cap.
Asset Limits Not assessed; need-based.
OH

12 AAAs; rural/low-income priority; volunteer respite option.

Benefits
Respite (4-6 hours/week or 5 days/year) Adult day care ($60/day) Training Supplies (~$500/year)

VA Aid and Attendance (A&A) and Housebound Benefits

Ohio VA Aid and Attendance/Housebound

Age 65+ or disabled veteran/spouse
General OH resident, wartime service, need for ADL help (A&A) or homebound.
Income Limits (2025) Net income < ~$1,984/month (veteran with dependent, A&A); pension offsets income.
Asset Limits ~$155,356 net worth limit
OH

High veteran demand; supports care in multiple settings.

Benefits
Cash (~$1,433-$2,642/month veteran, ~$951-$1,318 spouse) for care costs (e.g., in-home, assisted living)

Homestead Exemption

Ohio Homestead Exemption

Age 65+ (or disabled)
General OH resident, homeowner, low-income.
Income Limits (2025) ~$38,500/year individual, adjusted annually
Asset Limits Not assessed; home ownership required.
OH

Reduces taxable value by $25,000; applies to primary residence.

Benefits
Tax reduction (~$400-$800/year avg., varies by county)

Save the Dream Ohio (Homeowner Assistance Fund)

Ohio Save the Dream

Age 60+ prioritized
General OH resident, homeowner, hardship post-Jan 21, 2020.
Income Limits (2025) ~$147,600/year family of 4, 150% AMI; varies by county
Asset Limits Not assessed; hardship-focused.
OH

Covers delinquent mortgages, utilities, taxes; max $25,000 mortgage aid.

Benefits
Mortgage aid ($25,000 max) Utility/property tax aid ($5,000 avg.)

Frequently Asked Questions about Buckeye Forest at Fairfield

Is Buckeye Forest at Fairfield in a walkable area?

Buckeye Forest at Fairfield has a walk score of 21. Car-dependent. Most errands require a car, with limited nearby walkable options.

What is the occupancy rate at Buckeye Forest at Fairfield?

Buckeye Forest at Fairfield's occupancy is 57.3%.

Does Buckeye Forest at Fairfield operate as a for-profit or non-profit?

Buckeye Forest at Fairfield is registered as a for-profit.

Are there photos of Buckeye Forest at Fairfield?

Yes — there are 7 photos of Buckeye Forest at Fairfield in the photo gallery on this page.

What is the address of Buckeye Forest at Fairfield?

Buckeye Forest at Fairfield is located at 3801 Woodridge Blvd, Fairfield, OH 45014.

What is the phone number of Buckeye Forest at Fairfield?

(513) 874-9933 will put you in contact with the team at Buckeye Forest at Fairfield.

Is Buckeye Forest at Fairfield Medicare or Medicaid certified?

Yes — Buckeye Forest at Fairfield is a CMS-certified provider of Medicare and Medicaid.

Guides for Better Senior Living

Care Cost Calculator: See Prices in Your Area

Nursing Home Data Explorer

Don’t Wait Too Long: 7 Red Flag Signs Your Parent Needs Assisted Living Now

The True Cost of Assisted Living in 2025 – And How Families Are Paying For It

Understanding Senior Living Costs: Pricing Models, Discounts & Financial Assistance