Majestic Care of Fairfield
Nursing Home, Assisted Living, Home Care, Hospice Care, Independent Living, Memory Care & Nursing Care · Fairfield, OH
CMS overall rating Info CMS (the Centers for Medicare & Medicaid Services) is the federal agency that rates nursing home quality. Its Overall Rating runs from 1 to 5 stars, combining health inspections, staffing, and quality measures, with inspections weighted most heavily.

Majestic Care of Fairfield

Nursing Home, Assisted Living, Home Care, Hospice Care, Independent Living, Memory Care & Nursing Care · Fairfield, OH
CMS overall rating Info CMS (the Centers for Medicare & Medicaid Services) is the federal agency that rates nursing home quality. Its Overall Rating runs from 1 to 5 stars, combining health inspections, staffing, and quality measures, with inspections weighted most heavily.
Calculator: See prices in your area
Majestic Care of Fairfield accepts Medicare, Medicaid, and private pay.

Overview of Majestic Care of Fairfield

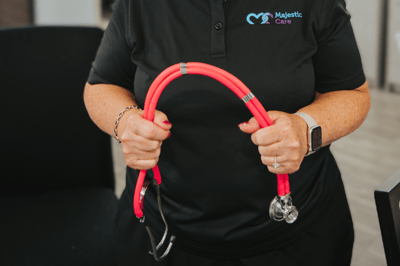
Majestic Care of Fairfield is a nursing home in Fairfield, OH, offering memory care, rehabilitation, skilled nursing, and hospice care. Promoting a nurturing and welcoming environment, the community strives to provide the ideal setting where older adults can thrive in retirement. High-quality services, including 24-hour care, well-balancedmeals, and therapies, are also offered to meet residents’ unique needs and preferences. Following a resident-centered care, the community doubles its efforts to help residents recover and return to their routines.

Light exercises, social events, and a variety of recreational activities help residents maintain their holistic well-being and make friends. State-of-the-art rehabilitation equipment and lively gathering areas are also available for residents’ relaxation and wellness. Residents also have quick access to their necessities and leisure with restaurants and shops in the area. This nursing home has excellent standards of care, making it one of the best options for senior living in Ohio.

Quality ratings

Measured by Centers for Medicare & Medicaid Services (CMS)

Overall rating Info The Overall CMS Rating combines results from health inspections, staffing levels and quality measures. Health inspections carry the most weight. Staffing and quality scores can increase or decrease the final rating based on performance compared to state and national standards.
▼ 37.1% Below OH avg. ▼ 37.1% Below OH avg.OH average: 3.2Click the badge to see the full State ranking.Click here to see the full State ranking.
Health Inspection Info Based on the results of the facility's three most recent standard inspections and any complaint investigations. CMS reviews the number, scope, and severity of deficiencies, with more recent findings weighted more heavily.
▼ 28.6% Below OH avg. ▼ 28.6% Below OH avg.OH average: 2.8Click the badge to see the full State ranking.Click here to see the full State ranking.
Staffing Info Measures average nursing staff hours per resident per day, including Registered Nurses (RNs) and total nursing staff. Ratings are adjusted based on the level of care residents require and are compared to state and national benchmarks.
▼ 59.1% Below OH avg. ▼ 59.1% Below OH avg.OH average: 2.4Click the badge to see the full State ranking.Click here to see the full State ranking.
Quality Measures Info Based on clinical and physical health indicators reported to CMS, such as hospital readmissions, falls, pressure ulcers, and improvements in mobility. These measures reflect how well residents' health needs are being managed.
▲ 14.7% Above OH avg. ▲ 14.7% Above OH avg.OH average: 4.4Click the badge to see the full State ranking.Click here to see the full State ranking.

Staffing hours breakdown

Info Daily nursing hours per resident by staff type, reported to CMS. Higher is generally better — compare this facility to state and national averages to see where staffing stands.

Hours per resident per day — compared to Ohio state averages

Total nursing care / resident Info This home is ranked 177th out of 210 homes in Ohio for nurse hours. Total adjusted nursing hours per resident per day, combining RN, LPN, and aide time. CMS adjusts this for case-mix so facilities can be fairly compared.
2h 58m per day
Rank #177 / 210Nurse hours — State benchmarkedThis home is ranked 177th out of 210 homes in Ohio. Shows adjusted nurse hours per resident per day benchmarked to the Ohio average, with a ranking across 210 Ohio facilities. More hours mean more direct care. The national average is about 3.5 hrs; below 3.0 is a red flag.Rankings are based only on facilities in Ohio that report data for that category. Facilities without available data are excluded from the ranking.Click the rank badge to see the full State ranking.Click here to see the full State ranking.
This facility Ohio avg (3h 32m per day)
vs Ohio avg
-16%

5 of 6 metrics below state avg

Standout metric LPN / LVN is +21% above state avg
Staff typeHours / Day / Residentvs state avg
Registered Nurse (RN) Info RNs hold the highest nursing license and can assess residents, interpret test results, and direct care plans. More RN hours per day often signals stronger clinical oversight and faster response to health changes. 28m per day ▼ 25% State avg: 38m per day · National avg: 41m per day
LPN / LVN Info Licensed Practical Nurses (LPNs) or Licensed Vocational Nurses (LVNs) deliver routine hands-on care — medication administration, wound dressing, and monitoring vital signs. They work under RN supervision and make up a large share of daily bedside care. 1h 10m per day ▲ 21% State avg: 58m per day · National avg: 52m per day
Nurse Aide Info Certified Nurse Aides (CNAs) provide the most direct day-to-day assistance: bathing, dressing, feeding, and mobility. Nurse aide hours are typically the largest staffing category and directly affect residents' quality of life. 1h 38m per day ▼ 23% State avg: 2h 8m per day · National avg: 2h 21m per day
Weekend Total Nursing Info Combined nursing hours (RN + LPN + Nurse Aide) per resident per day on weekends. Staffing often drops on weekends — this figure reveals whether the facility maintains adequate coverage outside of weekday hours. 3h 2m per day ▼ 8% State avg: 3h 17m per day · National avg: 3h 26m per day
Physical Therapist Info Hours per resident per day provided by licensed Physical Therapists (PTs) or PT Assistants. PT services help residents recover mobility after injury or illness and are especially important for post-acute (short-stay) rehabilitation. 1m per day ▼ 55% State avg: 3m per day · National avg: 4m per day
Weekend RN Info Registered nurse hours specifically on weekends. Facilities sometimes reduce RN presence on Saturdays and Sundays — a low weekend RN figure compared to weekday hours can indicate reduced clinical oversight when most administrative staff are absent. 24m per day ▼ 3% State avg: 25m per day · National avg: 29m per day

Capacity and availability

This home usually has availability

Lower occupancy than the Ohio average: 78.7%
Occupancy rate
75.6% Rank #149 / 211Occupancy rate — State benchmarkedThis home is ranked 149th out of 211 homes in Ohio. Shows this facility's occupancy rate versus the Ohio average, with its Statewide rank out of 211. Higher occupancy signals strong local demand and financial stability.Rankings are based only on facilities in Ohio that report data for that category. Facilities without available data are excluded from the ranking.Click the rank badge to see the full State ranking.Click here to see the full State ranking.
Avg. Length of Stay
149 days
Bed community size
200-bed community Rank #4 / 323Bed count — State benchmarkedThis home is ranked 4th out of 323 homes in Ohio. Shows this facility's certified or reported bed count compared to other Ohio facilities. Larger communities may offer more amenities, programs, and on-site services for residents and families.Rankings are based only on facilities in Ohio that report data for that category. Facilities without available data are excluded from the ranking.Click the rank badge to see the full State ranking.Click here to see the full State ranking.
A large-scale community that may provide a wide range of amenities, services, and structured programs.
Walk Score
Walk Score: 66 / 100 Rank #94 / 705Walk Score — State benchmarkedThis home is ranked 94th out of 705 homes in Ohio. Shows how walkable this facility's neighborhood is compared to the average Walk Score across Ohio facilities. Higher scores benefit residents, families, and staff.Rankings are based only on facilities in Ohio that report data for that category. Facilities without available data are excluded from the ranking.Click the rank badge to see the full State ranking.Click here to see the full State ranking.
Moderately walkable. Some errands can be accomplished on foot, with a mix of nearby amenities.

Therapy & Rehabilitation

3 services
Rehabilitation Services
Respite Care
Short-Term Rehab

Staffing & Medical

1 service
24-Hour Staffing

Amenities & Lifestyle

Branded ProgramsLife Story Communities Memory Care
Specific ProgramsSpeech Therapy, Physical Therapy, Occupational Therapy, Dialysis Care, Outpatient Therapy

Contact Majestic Care of Fairfield

Staffing Data

Reporting period: October 1 – December 31, 2025 (Q4 2025). Source: CMS Payroll-Based Journal report.

Total staff 178
Employees 153
Contractors 25
Staff to resident ratio 1.13 : 1
45% fewer staff per resident than Ohio average
Ohio average ratio: 2.04 : 1 Ohio average ratio: 2.04 : 1See full Ohio ranking
Avg staff/day 66
Average shift 8.7 hours
7% better than Ohio average
Ohio average: 8.1 hours Ohio average shift: 8.1 hoursSee full Ohio ranking
Total staff hours (quarter) 52,757

Nursing staff breakdown

Q4 2025 · Oct 1 – Dec 31 More info This data comes from the CMS Payroll-Based Journal report covering October 1 – December 31, 2025.
Registered Nurse

Manages medical care and health needs.

RN Staff Info 10 total: 9 full-time employees and 1 contractor. 10
Average shift length Info Average shift length. Calculated as total hours divided by days worked and average staff per day. 9.9 hours
Licensed Practical Nurse

Assists with medical care and medications.

LPN Staff Info All 40 LPN Staff are full-time employees. No contractors work on this role. 40
Average shift length Info Average shift length. Calculated as total hours divided by days worked and average staff per day. 9.4 hours
Certified Nursing Assistant

Helps with daily care and mobility.

CNA Staff Info All 72 CNA Staff are full-time employees. No contractors work on this role. 72
Average shift length Info Average shift length. Calculated as total hours divided by days worked and average staff per day. 8.9 hours

Contractor staffing

Q4 2025 · Oct 1 – Dec 31 More info This data comes from the CMS Payroll-Based Journal report covering October 1 – December 31, 2025.

Total hours from contractors

6.1%

3,202 contractor hours this quarter

Physical Therapy Assistant: 4 Respiratory Therapy Technician: 4 Speech Language Pathologist: 4 Feeding Assistant: 3 Medical Director: 3 Physical Therapy Aide: 3 Qualified Social Worker: 2 Registered Nurse: 1 Occupational Therapy Aide: 1

Staff by category

Q4 2025 · Oct 1 – Dec 31 More info This data comes from the CMS Payroll-Based Journal report covering October 1 – December 31, 2025.
Certified Nursing Assistant7207223,48992100%8.9
Licensed Practical Nurse4004013,67692100%9.4
Registered Nurse91105,09492100%9.9
RN Director of Nursing8083,1408087%8.7
Clinical Nurse Specialist100101,2698896%8.4
Dental Services Staff5059916874%7.3
Other Dietary Services Staff6067737480%5.8
Physical Therapy Aide0337016975%5.9
Feeding Assistant0336206773%6
Administrator1015126470%8
Nurse Practitioner1014565762%8
Qualified Social Worker0224376368%6.9
Speech Language Pathologist0444276166%6.4
Physical Therapy Assistant0444106571%6.2
Respiratory Therapy Technician0443215964%4.9
Occupational Therapy Aide1122393235%6.3
Medical Director0332023134%4.7
72 Certified Nursing Assistant
% of Days 100%
40 Licensed Practical Nurse
% of Days 100%
10 Registered Nurse
% of Days 100%
8 RN Director of Nursing
% of Days 87%
10 Clinical Nurse Specialist
% of Days 96%
5 Dental Services Staff
% of Days 74%
6 Other Dietary Services Staff
% of Days 80%
3 Physical Therapy Aide
% of Days 75%
3 Feeding Assistant
% of Days 73%
1 Administrator
% of Days 70%
1 Nurse Practitioner
% of Days 62%
2 Qualified Social Worker
% of Days 68%
4 Speech Language Pathologist
% of Days 66%
4 Physical Therapy Assistant
% of Days 71%
4 Respiratory Therapy Technician
% of Days 64%
2 Occupational Therapy Aide
% of Days 35%
3 Medical Director
% of Days 34%

Penalties and fines

Federal penalties imposed by CMS for regulatory violations, including civil money penalties (fines) and denials of payment for new Medicare/Medicaid admissions.

Source: CMS Penalties Database

No penalties in the past 3 years

No civil money penalties or payment denials were reported in the last 3 years.

Quality of care over time

These measures show how residents usually do over time at this home, based on health outcomes and preventive care.

High-risk clinical events score Info A composite score based on pressure ulcers, falls with injury, weight loss, walking ability decline, and activities of daily living decline. 7.1
21% worse than Ohio average

Ohio average: 5.8

Functional decline score Info A composite score based on activities of daily living decline, walking ability decline, and incontinence. 14.8
17% worse than Ohio average

Ohio average: 12.7

Long-stay resident measures
Significantly above average Info CMS star rating based on long-stay quality measure performance. 5 stars = significantly above average, 1 star = significantly below average.
Need for Help with Daily Activities Increased Info Percent of long-stay residents whose need for help with daily activities has increased 7.0%
In line with Ohio average

Ohio average: 6.8%

Walking Ability Worsened Info Percent of long-stay residents whose ability to move independently worsened 10.8%
22% worse than Ohio average

Ohio average: 8.9%

Low Risk Residents with Bowel/Bladder Incontinence Info Percent of low risk long-stay residents who lose control of their bowels or bladder 26.5%
21% worse than Ohio average

Ohio average: 22.0%

Falls with Major Injury Info Percent of long-stay residents experiencing one or more falls with major injury 1.4%
61% better than Ohio average

Ohio average: 3.4%

High Risk Residents with Pressure Ulcers Info Percent of long-stay high risk residents with pressure ulcers 5.4%
38% worse than Ohio average

Ohio average: 3.9%

Urinary Tract Infection Info Percent of long-stay residents with a urinary tract infection 0.0%
100% better than Ohio average

Ohio average: 0.5%

Lost Too Much Weight Info Percent of long-stay residents who lose too much weight 10.7%
73% worse than Ohio average

Ohio average: 6.2%

Depressive Symptoms Info Percent of long-stay residents who have depressive symptoms 17.3%
28% better than Ohio average

Ohio average: 24.0%

Antipsychotic Use Info Percent of long-stay residents who received an antipsychotic medication 5.9%
30% better than Ohio average

Ohio average: 8.4%

Pneumococcal Vaccine Info Percent of long-stay residents assessed and appropriately given the pneumococcal vaccine 60.5%
34% worse than Ohio average

Ohio average: 92.4%

Influenza Vaccine Info Percent of long-stay residents assessed and appropriately given the seasonal influenza vaccine 64.5%
32% worse than Ohio average

Ohio average: 94.5%

Short-stay resident measures
Significantly below average Info CMS star rating based on short-stay quality measure performance. 5 stars = much above average, 1 star = much below average.
Pneumococcal Vaccine Info Percent of short-stay residents assessed and appropriately given the pneumococcal vaccine 35.1%
55% worse than Ohio average

Ohio average: 78.0%

Antipsychotic medication increase Info Percent of short-stay residents who newly received an antipsychotic medication 3.6%
184% worse than Ohio average

Ohio average: 1.3%

Influenza Vaccine Info Percent of short-stay residents assessed and appropriately given the seasonal influenza vaccine 20.0%
74% worse than Ohio average

Ohio average: 75.6%

Re-hospitalized after SNF stay Info Percentage of short-stay residents who were re-hospitalized after their nursing home admission. 30.1%
20% worse than Ohio average

Ohio average: 25.1%

Emergency department visits Info Percentage of short-stay residents who had an outpatient emergency department visit. 14.8%
18% worse than Ohio average

Ohio average: 12.5%

Falls with major injury Info Percentage of SNF residents who experience falls with major injury during their stay. 2.0%
155% worse than Ohio average

Ohio average: 0.8%

Ability to care for self at discharge Info Percentage of residents at or above expected ability to care for themselves at discharge. 51.6%
In line with Ohio average

Ohio average: 53.7%

Successful return to home or community Info Rate of successful return to home or community from a skilled nursing facility. 42.4%
16% worse than Ohio average

Ohio average: 50.6%

Breakdown by payment type

Medicare

18% of new residents, usually for short-term rehab.

Typical stay 26 days

Private pay

33% of new residents, often for short stays.

Typical stay 2 - 3 months

Medicaid

48% of new residents, often for long-term daily care.

Typical stay 7 - 8 months

Facility Characteristics

Source: CMS Long-Term Care Facility Characteristics (Data as of Jan 2026)

Total residents 158
Medicare
5
3.2% of residents
Medicaid
134
84.8% of residents
Private pay or other
19
12% of residents
Programs & Services
Residents Group

Residents meet regularly to discuss policies, care quality, and activities

Family Member Group

Family members meet regularly to discuss policies, care quality, and activities

Active Family Council

Organized group of family members that meets regularly to discuss facility policies, resident care, and activities.

Active Resident Council

Organized group of residents that meets regularly to discuss facility policies, quality of life, and activities.

Finances and operations

Based on CMS SNF Cost Report for fiscal year ending in 12/2023.

For-profit
Individual
Net patient revenue Info Net patient revenue — what the home actually collects for resident care, after contractual allowances, bad debt and discounts are subtracted from its gross charges (CMS cost report, Worksheet G-3). It covers resident care only; money the home earns from other sources is shown separately as "Other income."
$17.6M
Net patient income Info Net patient income: net patient revenue minus the home's total operating expenses. A positive figure means it earns more from resident care than it spends to deliver it; a negative figure means the opposite. It excludes non-operating "other income."
-$146.4K
For-profit Individual
Net patient revenue Info Net patient revenue — what the home actually collects for resident care, after contractual allowances, bad debt and discounts are subtracted from its gross charges (CMS cost report, Worksheet G-3). It covers resident care only; money the home earns from other sources is shown separately as "Other income."
$17.6M Rank #27 / 210Revenue — State benchmarkedThis home is ranked 27th out of 210 homes in Ohio. Shows this facility's annual revenue compared to the Ohio average. Higher revenue generally means more resources for staffing and capital — read alongside Payroll %.Rankings are based only on facilities in Ohio that report data for that category. Facilities without available data are excluded from the ranking.Click the rank badge to see the full State ranking.Click here to see the full State ranking.
Net patient income Info Net patient income: net patient revenue minus the home's total operating expenses. A positive figure means it earns more from resident care than it spends to deliver it; a negative figure means the opposite. It excludes non-operating "other income."
-$146.4K
Other income Info Money the home earns outside of resident care — such as investments, grants, rentals and other non-operating sources (CMS cost report, Worksheet G-3). It is tracked separately from net patient revenue: it is not part of that figure, and it is not included in net patient income.
$14.8K
Payroll costs Info Staff salaries plus wage-related costs — benefits such as payroll taxes, health insurance and retirement — from the home's own accounting records (CMS cost report, Worksheet A). Contract or agency labor is counted separately, under other operating costs. Rank #33 / 210Payroll — State benchmarkedThis home is ranked 33rd out of 210 homes in Ohio. Shows total annual staff payroll benchmarked to the Ohio average. Higher payroll investment relative to peers often signals better staffing and less reliance on cheaper contract labor.Rankings are based only on facilities in Ohio that report data for that category. Facilities without available data are excluded from the ranking.Click the rank badge to see the full State ranking.Click here to see the full State ranking.
$7.7M 43.9% of net patient revenue Info Payroll as a share of revenue: staff salaries and wage-related benefits divided by net patient revenue. A higher figure means more of each revenue dollar goes to staff pay. Rank #129 / 210Payroll % — State benchmarkedThis home is ranked 129th out of 210 homes in Ohio. Shows payroll as a percentage of revenue versus the Ohio average. Well-run Ohio facilities typically land around 54–64% — the top third Statewide. Below 25% may signal understaffing or heavy agency use — read with Staffing ratings.Rankings are based only on facilities in Ohio that report data for that category. Facilities without available data are excluded from the ranking.Click the rank badge to see the full State ranking.Click here to see the full State ranking.
Other operating costs Info Everything it costs to run the home apart from payroll — food, utilities, supplies, maintenance, contract labor and administration. Calculated as total operating expense minus payroll (staff salaries and wage-related benefits).
$10.0M
Total costs Info The home's total operating expense for the year — all the costs of running it, salaries included (CMS cost report, Worksheet G-3).
$17.7M

Who this home usually serves

TYPE OF STAY

Mostly long-term care residents

Most residents stay for extended periods and receive ongoing daily care.

New residents most often arrive under Medicaid (48% of admissions), and a typical Medicaid stay runs around 7 - 8 months.

Admissions
376 total

Coverage residents most often arrive under.

Medicare 18%
Private pay 33%
Medicaid 48%
Discharges
370 total

Coverage residents most often leave under.

Medicare 12%
Private pay 32%
Medicaid 56%

Places of interest near Majestic Care of Fairfield

Address 2.3 miles from city center Info Estimated distance in miles from Fairfield's city center to Majestic Care of Fairfield's address, calculated via Google Maps.

Calculate Travel Distance to Majestic Care of Fairfield

Add your location

Address

Compare Nursing Homes around Fairfield

The information below is reported by the Ohio Department of Health, Bureau of Survey and Certification.

3 facilities compared · CMS & OH Dept. of Health data

Parkside
NH
HC
Fairfield
76
Facility 76
OH AVG 78
Rank #158 / 323
92.0%
Facility 92.0%
OH AVG 78.7%
Rank #57 / 211
+17%
3.38
Facility 3.38
OH AVG 3.54
Rank #115 / 210
-45%-5%
$45.8k
Facility $45.8k
OH AVG $74.0k
Rank #179 / 211
37
Facility 37
OH AVG 30.9
Rank #145 / 210
5.3
Facility 5.3
OH AVG 4.6
Rank #163 / 210
368-
56
Facility 56
OH AVG 40
Rank #186 / 705
-
$14.1M
Facility $14.1M
OH AVG $10.1M
Rank #107 / 210
$7.0M
Facility $7.0M
OH AVG $3.9M
Rank #53 / 210
49.5%
Facility 49.5%
OH AVG 40.2%
Rank #16 / 210
365363
Majestic Care of Fairfield
NH
AL
HC
IL
MC
NC
Fairfield
200
Facility 200
OH AVG 78
Rank #4 / 323
75.6%
Facility 75.6%
OH AVG 78.7%
Rank #149 / 211
-4%
2.96
Facility 2.96
OH AVG 3.54
Rank #177 / 210
-39%-16%
$0
Facility $0
OH AVG $74.0k
Rank #1 / 211
37
Facility 37
OH AVG 30.9
Rank #145 / 210
3.1
Facility 3.1
OH AVG 4.6
Rank #54 / 210
2156-
66
Facility 66
OH AVG 40
Rank #94 / 705
Kimberly Barrows
$17.6M
Facility $17.6M
OH AVG $10.1M
Rank #27 / 210
$7.7M
Facility $7.7M
OH AVG $3.9M
Rank #33 / 210
43.9%
Facility 43.9%
OH AVG 40.2%
Rank #129 / 210
365396
Buckeye Forest at Fairfield
NH
AL
MC
RC
Fairfield
90
Facility 90
OH AVG 78
Rank #113 / 323
57.3%
Facility 57.3%
OH AVG 78.7%
Rank #195 / 211
-27%
3.26
Facility 3.26
OH AVG 3.54
Rank #131 / 210
-10%-8%
$141.8k
Facility $141.8k
OH AVG $74.0k
Rank #197 / 211
58
Facility 58
OH AVG 30.9
Rank #189 / 210
5.3
Facility 5.3
OH AVG 4.6
Rank #163 / 210
268-
21
Facility 21
OH AVG 40
Rank #541 / 705
-
$7.9M
Facility $7.9M
OH AVG $10.1M
Rank #121 / 210
$5.5M
Facility $5.5M
OH AVG $3.9M
Rank #106 / 210
69.4%
Facility 69.4%
OH AVG 40.2%
Rank #66 / 210
365738

Financial Assistance for
Nursing Home in Ohio

Majestic Care of Fairfield is located in Fairfield, Ohio.
Here are the financial assistance programs available to residents in Ohio.

Get Financial aid guidance

PASSPORT Waiver

Ohio Medicaid PASSPORT

Age 60+
General Ohio resident, Medicaid-eligible, nursing home-level care need.
Income Limits (2025) ~$2,829/month 300% FBR, individual
Asset Limits $2,000 (individual), $3,000 (couple).
OH

Administered through regional agencies; waitlists possible.

Benefits
Personal care (5-7 hours/day) Respite (240 hours/year) Adult day care ($65/day) Home modifications ($1,500 avg.)

Ohio Home Care Program (non-Medicaid)

OH HCP

Age 60+
General Ohio resident, at risk of decline.
Income Limits ~$2,000/month individual, varies
Asset Limits $5,000 individual
OH

Limited funding; regional variation.

Benefits
In-home care (3-5 hours/week) Respite (up to 10 days/year) Transportation (~5 trips/month)

Assisted Living Waiver (ALW)

Ohio Assisted Living Waiver

Age 21+ (65+ prioritized)
General OH resident, Medicaid-eligible, NFLOC.
Income Limits (2025) ~$2,829/month (individual); QIT required.
Asset Limits $2,000 (individual), $3,000 (couple).
OH

Covers ~300 facilities; room/board not included (separate cost).

Benefits
Personal care Meals Medication management Transportation (~$3,000-$4,000/month value)

Program of All-Inclusive Care for the Elderly (PACE)

Ohio PACE (e.g., McGregor PACE)

Age 55+
General OH resident (specific counties), NFLOC, safe with PACE support.
Income Limits (2025) ~$2,829/month (Medicaid-eligible); private pay option available.
Asset Limits $2,000 (individual), $3,000 (couple) for Medicaid enrollees.
OH

Available in 9 counties (e.g., Cuyahoga, Franklin); expanding via Healthy Aging Grants.

Benefits
Personal care (5-7 hours/day) Medical care Meals Transportation Respite Therapies

Medicare Savings Program (MSP)

Ohio Medicare Savings Program

Age 65+ or disabled
General OH resident, Medicare Part A/B.
Income Limits (2025) ~$2,510/month (QMB), ~$3,380/month (SLMB), ~$3,598/month (QI)—individual.
Asset Limits $9,430 (individual), $14,130 (couple).
OH

Three tiers; includes Extra Help for Part D; no waitlist.

Benefits
Covers Part B premiums ($174.70/month) Deductibles ($240/year) Copays (~20%)

Home Energy Assistance Program (HEAP)

Ohio HEAP

Age 60+ prioritized
General OH resident, low-income household.
Income Limits (2025) ~$3,970/month individual, 185% FPL
Asset Limits Not assessed; income-focused.
OH

Covers gas, electric, oil; emergency aid via Winter/Summer Crisis Programs.

Benefits
Heating/cooling aid ($300-$1,000/season) Emergency aid ($500 max)

Family Caregiver Support Program (FCSP)

Ohio Family Caregiver Support Program

Age
General Caregivers of 60+ needing care or 55+ caregivers of others; OH resident; functional needs (2+ ADLs).
Income Limits (2025) Prioritizes ~$24,980/year (individual); no strict cap.
Asset Limits Not assessed; need-based.
OH

12 AAAs; rural/low-income priority; volunteer respite option.

Benefits
Respite (4-6 hours/week or 5 days/year) Adult day care ($60/day) Training Supplies (~$500/year)

VA Aid and Attendance (A&A) and Housebound Benefits

Ohio VA Aid and Attendance/Housebound

Age 65+ or disabled veteran/spouse
General OH resident, wartime service, need for ADL help (A&A) or homebound.
Income Limits (2025) Net income < ~$1,984/month (veteran with dependent, A&A); pension offsets income.
Asset Limits ~$155,356 net worth limit
OH

High veteran demand; supports care in multiple settings.

Benefits
Cash (~$1,433-$2,642/month veteran, ~$951-$1,318 spouse) for care costs (e.g., in-home, assisted living)

Homestead Exemption

Ohio Homestead Exemption

Age 65+ (or disabled)
General OH resident, homeowner, low-income.
Income Limits (2025) ~$38,500/year individual, adjusted annually
Asset Limits Not assessed; home ownership required.
OH

Reduces taxable value by $25,000; applies to primary residence.

Benefits
Tax reduction (~$400-$800/year avg., varies by county)

Save the Dream Ohio (Homeowner Assistance Fund)

Ohio Save the Dream

Age 60+ prioritized
General OH resident, homeowner, hardship post-Jan 21, 2020.
Income Limits (2025) ~$147,600/year family of 4, 150% AMI; varies by county
Asset Limits Not assessed; hardship-focused.
OH

Covers delinquent mortgages, utilities, taxes; max $25,000 mortgage aid.

Benefits
Mortgage aid ($25,000 max) Utility/property tax aid ($5,000 avg.)

Frequently Asked Questions about Majestic Care of Fairfield

Is Majestic Care of Fairfield in a walkable area?

Majestic Care of Fairfield has a walk score of 66. Moderately walkable. Some errands can be accomplished on foot, with a mix of nearby amenities.

What is the occupancy rate at Majestic Care of Fairfield?

Majestic Care of Fairfield's occupancy is 75.6%.

Does Majestic Care of Fairfield operate as a for-profit or non-profit?

Majestic Care of Fairfield is registered as a for-profit.

Are there photos of Majestic Care of Fairfield?

Yes — there are 2 photos of Majestic Care of Fairfield in the photo gallery on this page.

What is the address of Majestic Care of Fairfield?

Majestic Care of Fairfield is located at 5200 Camelot Dr, Fairfield, OH 45014.

What is the phone number of Majestic Care of Fairfield?

(513) 829-8100 will put you in contact with the team at Majestic Care of Fairfield.

Is Majestic Care of Fairfield Medicare or Medicaid certified?

Yes — Majestic Care of Fairfield is a CMS-certified provider of Medicare and Medicaid.

Guides for Better Senior Living

Care Cost Calculator: See Prices in Your Area

Nursing Home Data Explorer

Don’t Wait Too Long: 7 Red Flag Signs Your Parent Needs Assisted Living Now

The True Cost of Assisted Living in 2025 – And How Families Are Paying For It

Understanding Senior Living Costs: Pricing Models, Discounts & Financial Assistance