Burbank Healthcare & Rehabilitation Center
CMS overall rating Info CMS (the Centers for Medicare & Medicaid Services) is the federal agency that rates nursing home quality. Its Overall Rating runs from 1 to 5 stars, combining health inspections, staffing, and quality measures, with inspections weighted most heavily.

Burbank Healthcare & Rehabilitation Center

CMS overall rating Info CMS (the Centers for Medicare & Medicaid Services) is the federal agency that rates nursing home quality. Its Overall Rating runs from 1 to 5 stars, combining health inspections, staffing, and quality measures, with inspections weighted most heavily.
Calculator: See prices in your area
Burbank Healthcare & Rehabilitation Center accepts Medicare, Medicaid, and private pay.

Overview of Burbank Healthcare & Rehabilitation Center

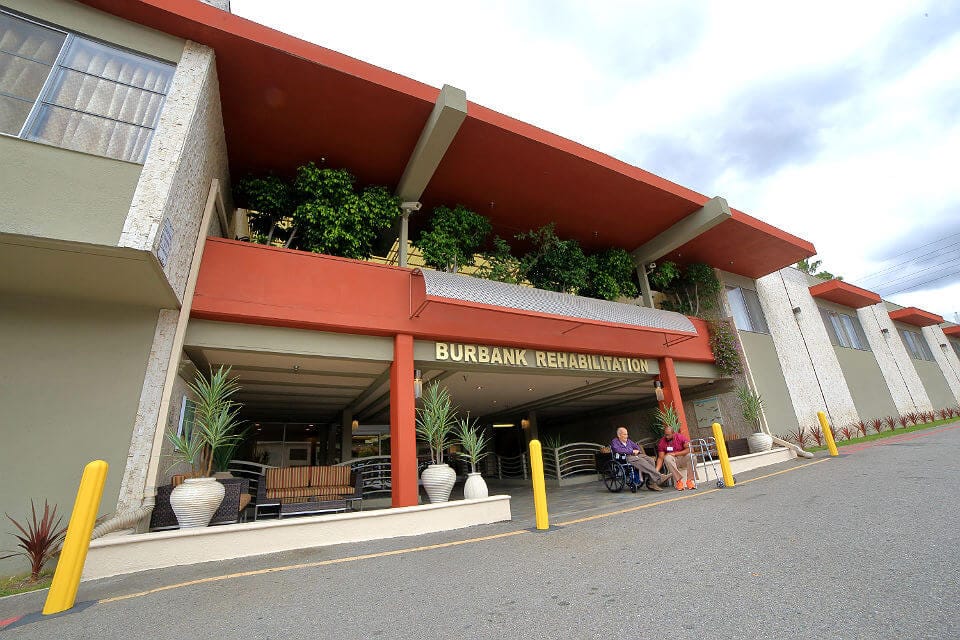
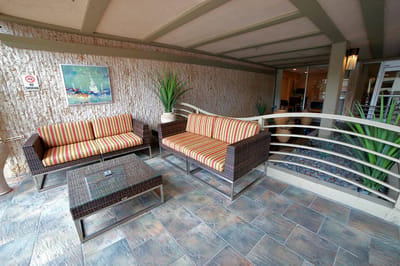
Burbank Healthcare & Rehabilitation Center in Burbank, CA, is a nursing home that offers skilled nursing and rehabilitation. Fostering comfort and healing, the community features upscale amenities in a nurturing setting. With 24-hour care, social services, and scheduled transportation, residents receive exceptional care to live comfortably in retirement. Combining a resident-centered and family-inclusive approach to care, the community strives to understand residents’ needs and habits to help them recover.

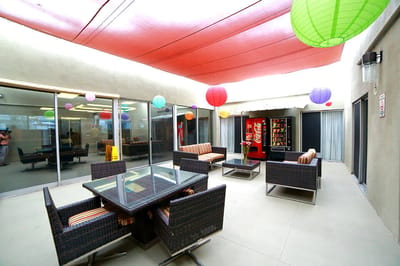
Fun gatherings, fitness programs, and sensory games ensure residents can interact with friends and gain meaningful experiences. Residents can also relax, especially with its lively gathering areas and cozy rooms. Surrounded by restaurants and shops in the serene residential area of Burbank, the community guarantees accessibility and convenience. This nursing home has exceptional standards of care, making it one of the trusted options for senior living in California.

Quality ratings

Measured by Centers for Medicare & Medicaid Services (CMS)

Overall rating Info The Overall CMS Rating combines results from health inspections, staffing levels and quality measures. Health inspections carry the most weight. Staffing and quality scores can increase or decrease the final rating based on performance compared to state and national standards.
▼ 68.2% Below CA avg. ▼ 68.2% Below CA avg.CA average: 3.1Click the badge to see the full State ranking.Click here to see the full State ranking.
Health Inspection Info Based on the results of the facility's three most recent standard inspections and any complaint investigations. CMS reviews the number, scope, and severity of deficiencies, with more recent findings weighted more heavily.
▼ 64.2% Below CA avg. ▼ 64.2% Below CA avg.CA average: 2.8Click the badge to see the full State ranking.Click here to see the full State ranking.
Staffing Info Measures average nursing staff hours per resident per day, including Registered Nurses (RNs) and total nursing staff. Ratings are adjusted based on the level of care residents require and are compared to state and national benchmarks.
▲ 27.5% Above CA avg. ▲ 27.5% Above CA avg.CA average: 3.1Click the badge to see the full State ranking.Click here to see the full State ranking.
Quality Measures Info Based on clinical and physical health indicators reported to CMS, such as hospital readmissions, falls, pressure ulcers, and improvements in mobility. These measures reflect how well residents' health needs are being managed.
▼ 26.6% Below CA avg. ▼ 26.6% Below CA avg.CA average: 4.1Click the badge to see the full State ranking.Click here to see the full State ranking.

Staffing hours breakdown

Info Daily nursing hours per resident by staff type, reported to CMS. Higher is generally better — compare this facility to state and national averages to see where staffing stands.

Hours per resident per day — compared to California state averages

Total nursing care / resident Info This home is ranked 160th out of 354 homes in California for nurse hours. Total adjusted nursing hours per resident per day, combining RN, LPN, and aide time. CMS adjusts this for case-mix so facilities can be fairly compared.
4h 6m per day
Rank #160 / 354Nurse hours — State benchmarkedThis home is ranked 160th out of 354 homes in California. Shows adjusted nurse hours per resident per day benchmarked to the California average, with a ranking across 354 California facilities. More hours mean more direct care. The national average is about 3.5 hrs; below 3.0 is a red flag.Rankings are based only on facilities in California that report data for that category. Facilities without available data are excluded from the ranking.Click the rank badge to see the full State ranking.Click here to see the full State ranking.
This facility California avg (4h 13m per day)
vs California avg
-3%

5 of 6 metrics below state avg

Staff typeHours / Day / Residentvs state avg
Registered Nurse (RN) Info RNs hold the highest nursing license and can assess residents, interpret test results, and direct care plans. More RN hours per day often signals stronger clinical oversight and faster response to health changes. 25m per day ▼ 35% State avg: 39m per day · National avg: 41m per day
LPN / LVN Info Licensed Practical Nurses (LPNs) or Licensed Vocational Nurses (LVNs) deliver routine hands-on care — medication administration, wound dressing, and monitoring vital signs. They work under RN supervision and make up a large share of daily bedside care. 1h 3m per day ▼ 14% State avg: 1h 13m per day · National avg: 52m per day
Nurse Aide Info Certified Nurse Aides (CNAs) provide the most direct day-to-day assistance: bathing, dressing, feeding, and mobility. Nurse aide hours are typically the largest staffing category and directly affect residents' quality of life. 2h 35m per day ■ Avg State avg: 2h 39m per day · National avg: 2h 21m per day
Weekend Total Nursing Info Combined nursing hours (RN + LPN + Nurse Aide) per resident per day on weekends. Staffing often drops on weekends — this figure reveals whether the facility maintains adequate coverage outside of weekday hours. 3h 51m per day ▼ 6% State avg: 4h 5m per day · National avg: 3h 26m per day
Physical Therapist Info Hours per resident per day provided by licensed Physical Therapists (PTs) or PT Assistants. PT services help residents recover mobility after injury or illness and are especially important for post-acute (short-stay) rehabilitation. 4m per day ▼ 28% State avg: 5m per day · National avg: 4m per day
Weekend RN Info Registered nurse hours specifically on weekends. Facilities sometimes reduce RN presence on Saturdays and Sundays — a low weekend RN figure compared to weekday hours can indicate reduced clinical oversight when most administrative staff are absent. 21m per day ▼ 31% State avg: 30m per day · National avg: 29m per day

Capacity and availability

This home usually has limited availability

Higher occupancy than the California average: 84.7%
Occupancy rate
89.2% Rank #348 / 1537Occupancy rate — State benchmarkedThis home is ranked 348th out of 1537 homes in California. Shows this facility's occupancy rate versus the California average, with its Statewide rank out of 1537. Higher occupancy signals strong local demand and financial stability.Rankings are based only on facilities in California that report data for that category. Facilities without available data are excluded from the ranking.Click the rank badge to see the full State ranking.Click here to see the full State ranking.
Avg. Length of Stay
113 days
Bed community size
188-bed community Rank #187 / 1657Bed count — State benchmarkedThis home is ranked 187th out of 1657 homes in California. Shows this facility's certified or reported bed count compared to other California facilities. Larger communities may offer more amenities, programs, and on-site services for residents and families.Rankings are based only on facilities in California that report data for that category. Facilities without available data are excluded from the ranking.Click the rank badge to see the full State ranking.Click here to see the full State ranking.
A large-scale community that may provide a wide range of amenities, services, and structured programs.
Walk Score
Walk Score: 78 / 100 Rank #486 / 2092Walk Score — State benchmarkedThis home is ranked 486th out of 2092 homes in California. Shows how walkable this facility's neighborhood is compared to the average Walk Score across California facilities. Higher scores benefit residents, families, and staff.Rankings are based only on facilities in California that report data for that category. Facilities without available data are excluded from the ranking.Click the rank badge to see the full State ranking.Click here to see the full State ranking.
Very walkable. Most errands can be accomplished on foot, and many essentials are within a short walk.

Contact Burbank Healthcare & Rehabilitation Center

Staffing Data

Reporting period: October 1 – December 31, 2025 (Q4 2025). Source: CMS Payroll-Based Journal report.

Total staff 246
Employees 206
Contractors 40
Staff to resident ratio 1.48 : 1
18% fewer staff per resident than California average
California average ratio: 1.81 : 1 California average ratio: 1.81 : 1See full California ranking
Avg staff/day 116
Average shift 7.4 hours
0% compared with California average
California average: 7.7 hours California average shift: 7.7 hoursSee full California ranking
Total staff hours (quarter) 78,763

Nursing staff breakdown

Q4 2025 · Oct 1 – Dec 31 More info This data comes from the CMS Payroll-Based Journal report covering October 1 – December 31, 2025.
Registered Nurse

Manages medical care and health needs.

RN Staff Info 14 total: 13 full-time employees and 1 contractor. 14
Average shift length Info Average shift length. Calculated as total hours divided by days worked and average staff per day. 8 hours
Licensed Practical Nurse

Assists with medical care and medications.

LPN Staff Info All 42 LPN Staff are full-time employees. No contractors work on this role. 42
Average shift length Info Average shift length. Calculated as total hours divided by days worked and average staff per day. 7.9 hours
Certified Nursing Assistant

Helps with daily care and mobility.

CNA Staff Info All 120 CNA Staff are full-time employees. No contractors work on this role. 120
Average shift length Info Average shift length. Calculated as total hours divided by days worked and average staff per day. 7.2 hours

Contractor staffing

Q4 2025 · Oct 1 – Dec 31 More info This data comes from the CMS Payroll-Based Journal report covering October 1 – December 31, 2025.

Total hours from contractors

9.8%

7,706 contractor hours this quarter

Speech Language Pathologist: 7 Physical Therapy Assistant: 7 Respiratory Therapy Technician: 6 Physical Therapy Aide: 5 Qualified Social Worker: 4 Other Physician: 3 Medical Director: 2 Occupational Therapist: 2 Occupational Therapy Aide: 2 Clinical Nurse Specialist: 1 Registered Nurse: 1

Staff by category

Q4 2025 · Oct 1 – Dec 31 More info This data comes from the CMS Payroll-Based Journal report covering October 1 – December 31, 2025.
Certified Nursing Assistant120012041,89292100%7.2
Licensed Practical Nurse4204214,45092100%7.9
Registered Nurse131144,64292100%8
Other Dietary Services Staff120122,78792100%7.2
RN Director of Nursing6062,5156975%7.8
Speech Language Pathologist0772,3767683%6.8
Physical Therapy Aide0551,89592100%7.5
Clinical Nurse Specialist4151,6537986%8
Physical Therapy Assistant0771,2258087%6
Administrator2021,1257278%8.4
Respiratory Therapy Technician0669719098%5.9
Qualified Social Worker0448866773%6.8
Dental Services Staff4047886166%8
Mental Health Service Worker1015516368%8.7
Nurse Practitioner1015126470%8
Dietitian1012092830%7.5
Other Physician0331002729%2.6
Occupational Therapy Aide022881112%8
Occupational Therapist022741011%7.4
Medical Director02225910%2.1
120 Certified Nursing Assistant
% of Days 100%
42 Licensed Practical Nurse
% of Days 100%
14 Registered Nurse
% of Days 100%
12 Other Dietary Services Staff
% of Days 100%
6 RN Director of Nursing
% of Days 75%
7 Speech Language Pathologist
% of Days 83%
5 Physical Therapy Aide
% of Days 100%
5 Clinical Nurse Specialist
% of Days 86%
7 Physical Therapy Assistant
% of Days 87%
2 Administrator
% of Days 78%
6 Respiratory Therapy Technician
% of Days 98%
4 Qualified Social Worker
% of Days 73%
4 Dental Services Staff
% of Days 66%
1 Mental Health Service Worker
% of Days 68%
1 Nurse Practitioner
% of Days 70%
1 Dietitian
% of Days 30%
3 Other Physician
% of Days 29%
2 Occupational Therapy Aide
% of Days 12%
2 Occupational Therapist
% of Days 11%
2 Medical Director
% of Days 10%

Penalties and fines

Includes penalties issued in 2024-2025

Federal penalties imposed by CMS for regulatory violations, including civil money penalties (fines) and denials of payment for new Medicare/Medicaid admissions.

Source: CMS Penalties Database (Data as of Jan 2026)

Total fines amount $17K Rank #261 / 362Federal fines — State benchmarkedThis home is ranked 261st out of 362 homes in California. Shows this facility's cumulative CMS federal fine dollars versus the California average among facilities with fines, and where it ranks among 362 facilities in the pool. Lower total dollars mean a better rank.Rankings are based only on facilities in California that report data for that category. Facilities without available data are excluded from the ranking.Click the rank badge to see the full State ranking.Click here to see the full State ranking.
68% lower than California average

California average: $55K

Number of fines 1
58% fewer fines than California average

California average: 2.4

Payment Denials Info Serious action where Medicare and/or Medicaid temporarily stops payments for new residents until issues are fixed. 1
102% more payment denials than California average

California average: 0.5

Fines amount comparison
This facility $17K
California average $55K
Penalty History

Penalties are imposed by CMS for violations of federal nursing home regulations.

2 penalties in the past 3 years

Multiple penalties were reported in the last 3 years.

Civil Money Penalty Info Fines imposed for noncompliance, which can be assessed per day or per instance of violation. Jan 31, 2025
$17K
Payment Denial Info Serious action where Medicare and/or Medicaid temporarily stops payments for new residents until issues are fixed. Apr 17, 2024
22 days

Last updated: Jan 2026

Quality of care over time

These measures show how residents usually do over time at this home, based on health outcomes and preventive care.

High-risk clinical events score Info A composite score based on pressure ulcers, falls with injury, weight loss, walking ability decline, and activities of daily living decline. 7.4
11% worse than California average

California average: 6.6

Functional decline score Info A composite score based on activities of daily living decline, walking ability decline, and incontinence. 8.1
28% better than California average

California average: 11.3

Long-stay resident measures
Above average Info CMS star rating based on long-stay quality measure performance. 5 stars = significantly above average, 1 star = significantly below average.
Need for Help with Daily Activities Increased Info Percent of long-stay residents whose need for help with daily activities has increased 8.6%
23% better than California average

California average: 11.1%

Walking Ability Worsened Info Percent of long-stay residents whose ability to move independently worsened 9.5%
21% better than California average

California average: 12.0%

Low Risk Residents with Bowel/Bladder Incontinence Info Percent of low risk long-stay residents who lose control of their bowels or bladder 6.3%
44% better than California average

California average: 11.3%

Falls with Major Injury Info Percent of long-stay residents experiencing one or more falls with major injury 1.7%
In line with California average

California average: 1.7%

High Risk Residents with Pressure Ulcers Info Percent of long-stay high risk residents with pressure ulcers 6.2%
25% worse than California average

California average: 5.0%

Urinary Tract Infection Info Percent of long-stay residents with a urinary tract infection 1.9%
52% worse than California average

California average: 1.2%

Lost Too Much Weight Info Percent of long-stay residents who lose too much weight 10.9%
160% worse than California average

California average: 4.2%

Depressive Symptoms Info Percent of long-stay residents who have depressive symptoms 0.0%
100% better than California average

California average: 6.7%

Antipsychotic Use Info Percent of long-stay residents who received an antipsychotic medication 17.6%
75% worse than California average

California average: 10.1%

Pneumococcal Vaccine Info Percent of long-stay residents assessed and appropriately given the pneumococcal vaccine 100.0%
In line with California average

California average: 98.5%

Influenza Vaccine Info Percent of long-stay residents assessed and appropriately given the seasonal influenza vaccine 100.0%
In line with California average

California average: 98.2%

Hospitalizations per 1,000 days Info Number of hospitalizations per 1,000 long-stay resident days. 3.38
50% worse than California average

California average: 2.25

ED visits per 1,000 days Info Number of outpatient emergency department visits per 1,000 long-stay resident days. 1.68
6% worse than California average

California average: 1.59

Short-stay resident measures
Significantly below average Info CMS star rating based on short-stay quality measure performance. 5 stars = much above average, 1 star = much below average.
Pneumococcal Vaccine Info Percent of short-stay residents assessed and appropriately given the pneumococcal vaccine 96.3%
In line with California average

California average: 94.0%

Antipsychotic medication increase Info Percent of short-stay residents who newly received an antipsychotic medication 2.3%
61% worse than California average

California average: 1.5%

Influenza Vaccine Info Percent of short-stay residents assessed and appropriately given the seasonal influenza vaccine 92.5%
In line with California average

California average: 93.2%

Re-hospitalized after SNF stay Info Percentage of short-stay residents who were re-hospitalized after their nursing home admission. 35.0%
51% worse than California average

California average: 23.2%

Emergency department visits Info Percentage of short-stay residents who had an outpatient emergency department visit. 9.3%
17% better than California average

California average: 11.2%

Falls with major injury Info Percentage of SNF residents who experience falls with major injury during their stay. 0.8%
5% worse than California average

California average: 0.8%

Ability to care for self at discharge Info Percentage of residents at or above expected ability to care for themselves at discharge. 26.0%
52% worse than California average

California average: 53.7%

Successful return to home or community Info Rate of successful return to home or community from a skilled nursing facility. 46.8%
7% worse than California average

California average: 50.6%

Breakdown by payment type

Medicare

30% of new residents, usually for short-term rehab.

Typical stay 2 - 3 months

Private pay

39% of new residents, often for short stays.

Typical stay 1 - 2 months

Medicaid

31% of new residents, often for long-term daily care.

Typical stay 8 - 9 months

Facility Characteristics

Source: CMS Long-Term Care Facility Characteristics (Data as of Jan 2026)

Total residents 166
Medicare
19
11.4% of residents
Medicaid
110
66.3% of residents
Private pay or other
37
22.3% of residents
Programs & Services
Residents Group

Residents meet regularly to discuss policies, care quality, and activities

Nurse Aide Training

State-approved Nurse Aide Training and Competency Evaluation Program on-site

Active Resident Council

Organized group of residents that meets regularly to discuss facility policies, quality of life, and activities.

Finances and operations

Based on CMS SNF Cost Report for fiscal year ending in 12/2023.

For-profit
Operated by a single business entity.
Net patient revenue Info Net patient revenue — what the home actually collects for resident care, after contractual allowances, bad debt and discounts are subtracted from its gross charges (CMS cost report, Worksheet G-3). It covers resident care only; money the home earns from other sources is shown separately as "Other income."
$25.2M
Net patient income Info Net patient income: net patient revenue minus the home's total operating expenses. A positive figure means it earns more from resident care than it spends to deliver it; a negative figure means the opposite. It excludes non-operating "other income."
$781.8K
For-profit Operated by a single business entity.
Net patient revenue Info Net patient revenue — what the home actually collects for resident care, after contractual allowances, bad debt and discounts are subtracted from its gross charges (CMS cost report, Worksheet G-3). It covers resident care only; money the home earns from other sources is shown separately as "Other income."
$25.2M Rank #39 / 355Revenue — State benchmarkedThis home is ranked 39th out of 355 homes in California. Shows this facility's annual revenue compared to the California average. Higher revenue generally means more resources for staffing and capital — read alongside Payroll %.Rankings are based only on facilities in California that report data for that category. Facilities without available data are excluded from the ranking.Click the rank badge to see the full State ranking.Click here to see the full State ranking.
Net patient income Info Net patient income: net patient revenue minus the home's total operating expenses. A positive figure means it earns more from resident care than it spends to deliver it; a negative figure means the opposite. It excludes non-operating "other income."
$781.8K
Other income Info Money the home earns outside of resident care — such as investments, grants, rentals and other non-operating sources (CMS cost report, Worksheet G-3). It is tracked separately from net patient revenue: it is not part of that figure, and it is not included in net patient income.
$106.3K
Payroll costs Info Staff salaries plus wage-related costs — benefits such as payroll taxes, health insurance and retirement — from the home's own accounting records (CMS cost report, Worksheet A). Contract or agency labor is counted separately, under other operating costs. Rank #35 / 355Payroll — State benchmarkedThis home is ranked 35th out of 355 homes in California. Shows total annual staff payroll benchmarked to the California average. Higher payroll investment relative to peers often signals better staffing and less reliance on cheaper contract labor.Rankings are based only on facilities in California that report data for that category. Facilities without available data are excluded from the ranking.Click the rank badge to see the full State ranking.Click here to see the full State ranking.
$12.4M 49.2% of net patient revenue Info Payroll as a share of revenue: staff salaries and wage-related benefits divided by net patient revenue. A higher figure means more of each revenue dollar goes to staff pay. Rank #244 / 355Payroll % — State benchmarkedThis home is ranked 244th out of 355 homes in California. Shows payroll as a percentage of revenue versus the California average. Well-run California facilities typically land around 56–67% — the top third Statewide. Below 25% may signal understaffing or heavy agency use — read with Staffing ratings.Rankings are based only on facilities in California that report data for that category. Facilities without available data are excluded from the ranking.Click the rank badge to see the full State ranking.Click here to see the full State ranking.
Other operating costs Info Everything it costs to run the home apart from payroll — food, utilities, supplies, maintenance, contract labor and administration. Calculated as total operating expense minus payroll (staff salaries and wage-related benefits).
$12.0M
Total costs Info The home's total operating expense for the year — all the costs of running it, salaries included (CMS cost report, Worksheet G-3).
$24.4M

What does this home offer?

Housing options icon

Housing Options: Private / Semi-Private Rooms

Building type icon
Building type icon

Building Type: 2-story

Beauty services icon

Beauty Services

Transportation services icon

Transportation Services

Social and recreational activities icon

Social and Recreational Activities

Rehabilitative support icon

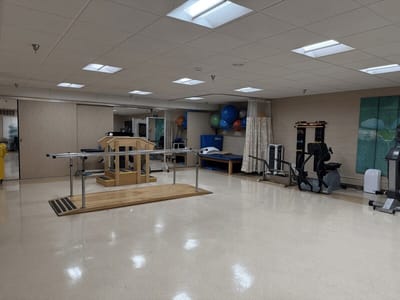
Rehabilitative Support

On-site medical care and health services icon

On-site Medical Care and Health Services

Who this home usually serves

TYPE OF STAY

Mix of rehab and long-term care

This home supports both short-term rehab and long-term care, with residents staying for a wide range of durations.

New residents most often arrive under private pay (39% of admissions), and a typical private pay stay runs around 1 - 2 months.

Admissions
551 total

Coverage residents most often arrive under.

Medicare 30%
Private pay 39%
Medicaid 31%
Discharges
544 total

Coverage residents most often leave under.

Medicare 42%
Private pay 32%
Medicaid 26%

Places of interest near Burbank Healthcare & Rehabilitation Center

Address 1.6 miles from city center Info Estimated distance in miles from Burbank's city center to Burbank Healthcare & Rehabilitation Center's address, calculated via Google Maps.

Calculate Travel Distance to Burbank Healthcare & Rehabilitation Center

Add your location

Address

Compare Nursing Homes around Burbank

The information below is reported by the California Department of Social Services and Department of Public Health.

3 facilities compared · CMS & CA Dept. of Health data

Alameda Care Center
NH
Burbank
89
Facility 89
CA AVG 103
Rank #862 / 1657
94.9%
Facility 94.9%
CA AVG 84.7%
Rank #198 / 1537
+12%
4.59
Facility 4.59
CA AVG 4.22
Rank #80 / 354
-39%+9%
$8.0k
Facility $8.0k
CA AVG $56.5k
Rank #223 / 362
-
80
Facility 80
CA AVG 50.2
Rank #308 / 361
5.0
Facility 5.0
CA AVG 4.6
Rank #243 / 361
184-
82
Facility 82
CA AVG 57
Rank #357 / 2092
Barbara Czarnik
$10.9M
Facility $10.9M
CA AVG $17.0M
Rank #201 / 355
$5.1M
Facility $5.1M
CA AVG $7.0M
Rank #264 / 355
46.6%
Facility 46.6%
CA AVG 45.2%
Rank #296 / 355
555690
Providence St. Elizabeth Care Center – North Hollywood
NH
North Hollywood (North Hollywood Neighborhood Council District)
52
Facility 52
CA AVG 103
Rank #1128 / 1657
74.9%
Facility 74.9%
CA AVG 84.7%
Rank #834 / 1537
-12%
3.93
Facility 3.93
CA AVG 4.22
Rank #206 / 354
+21%-7%
$54.0k
Facility $54.0k
CA AVG $56.5k
Rank #317 / 362
-
63
Facility 63
CA AVG 50.2
Rank #279 / 361
5.7
Facility 5.7
CA AVG 4.6
Rank #287 / 361
248-
79
Facility 79
CA AVG 57
Rank #451 / 2092
Providence Health System-Southern California
$6.2M
Facility $6.2M
CA AVG $17.0M
Rank #311 / 355
$4.2M
Facility $4.2M
CA AVG $7.0M
Rank #284 / 355
67.9%
Facility 67.9%
CA AVG 45.2%
Rank #28 / 355
55192
Burbank Healthcare & Rehabilitation Center
NH
Burbank (South Main Street)
188
Facility 188
CA AVG 103
Rank #187 / 1657
89.2%
Facility 89.2%
CA AVG 84.7%
Rank #348 / 1537
+5%
4.11
Facility 4.11
CA AVG 4.22
Rank #160 / 354
-36%-3%
$17.4k
Facility $17.4k
CA AVG $56.5k
Rank #261 / 362
-
110
Facility 110
CA AVG 50.2
Rank #348 / 361
4.6
Facility 4.6
CA AVG 4.6
Rank #216 / 361
3176-
78
Facility 78
CA AVG 57
Rank #486 / 2092
Reiner Roeske
$25.2M
Facility $25.2M
CA AVG $17.0M
Rank #39 / 355
$12.4M
Facility $12.4M
CA AVG $7.0M
Rank #35 / 355
49.2%
Facility 49.2%
CA AVG 45.2%
Rank #244 / 355
56129

Financial Assistance for
Nursing Home in California

Burbank Healthcare & Rehabilitation Center is located in Burbank, California.
Here are the financial assistance programs available to residents in California.

Get Financial aid guidance

Multipurpose Senior Services Program

MSSP (Medi-Cal Waiver)

Age 65+
General California resident, Medi-Cal eligible, nursing home risk.
Income Limits (2025) ~$2,829/month 300% FBR, individual
Asset Limits $2,000 (individual), $3,000 (couple).
CA

County-managed; waitlists possible.

Benefits
In-home support (4-6 hours/day) Respite care (14 days/year) Meals (~$6/meal) Transportation (8 trips/month) Care management

In-Home Supportive Services (IHSS)

California IHSS

Age 65+
General California resident, Medicaid-eligible or low-income.
Income Limits ~$1,732/month individual, Medi-Cal threshold
Asset Limits $2,000 individual
CA

Can hire family as caregivers.

Benefits
Personal care (up to 283 hours/month) Homemaker services Respite (varies)

Multipurpose Senior Services Program (MSSP)

CA MSSP

Age 65+
General California resident, Medi-Cal-eligible, nursing home-eligible but community-capable.
Income Limits ~$2,829/month 300% FBR, individual
Asset Limits $2,000 individual
CA

Available in 38 counties; waitlists common.

Benefits
Case management Respite care (up to 10 days/year) Minor home mods (avg. $500) Adult day care (~$50/day)

Property Tax Postponement Program (PTP)

CA PTP

Age 62+
General California resident, own and live in home, 40% equity.
Income Limits (2025) ~$51,500/year household, adjusted annually
Asset Limits Equity-based; no strict asset cap.
CA

Deferred taxes accrue interest (5% as of 2024); repaid upon sale/death.

Benefits
Property tax deferral (avg. $1,000-$3,000/year, varies by county)

Assisted Living Waiver (ALW)

CA ALW

Age 65+ or disabled
General California resident, Medi-Cal-eligible, nursing home-eligible.
Income Limits ~$2,829/month 300% FBR, individual
Asset Limits $2,000 individual
CA

Available in 15 counties (e.g., LA, Sacramento); waitlists common.

Benefits
Personal care in ALFs (5-7 hours/day) Medication management Social services

California CARES Program

CA CARES

Age
General Caregivers of California residents 60+ needing help with 3+ daily activities; no caregiver age limit.
Income Limits No strict limit; cost-sharing above ~$2,500/month threshold.
Asset Limits Not applicable; need-based.
CA

High demand in urban areas; complements IHSS respite.

Benefits
Respite care (up to 10 days/year) Counseling (4-6 sessions/year) Training (2-3 workshops/year) Supplies (~$200/year)

Frequently Asked Questions about Burbank Healthcare & Rehabilitation Center

What neighborhood is Burbank Healthcare & Rehabilitation Center in?

Burbank Healthcare & Rehabilitation Center is in the South Main Street neighborhood.

Is Burbank Healthcare & Rehabilitation Center in a walkable area?

Burbank Healthcare & Rehabilitation Center has a walk score of 78. Very walkable. Most errands can be accomplished on foot, and many essentials are within a short walk.

What is the occupancy rate at Burbank Healthcare & Rehabilitation Center?

Burbank Healthcare & Rehabilitation Center's occupancy is 89.2%.

Does Burbank Healthcare & Rehabilitation Center operate as a for-profit or non-profit?

Burbank Healthcare & Rehabilitation Center is registered as a for-profit.

Are there photos of Burbank Healthcare & Rehabilitation Center?

Yes — there are 6 photos of Burbank Healthcare & Rehabilitation Center in the photo gallery on this page.

What is the address of Burbank Healthcare & Rehabilitation Center?

Burbank Healthcare & Rehabilitation Center is located at 1041 S Main St, Burbank, CA 91506.

What is the phone number of Burbank Healthcare & Rehabilitation Center?

(818) 843-2330 will put you in contact with the team at Burbank Healthcare & Rehabilitation Center.

Guides for Better Senior Living

Care Cost Calculator: See Prices in Your Area

Nursing Home Data Explorer

Don’t Wait Too Long: 7 Red Flag Signs Your Parent Needs Assisted Living Now

The True Cost of Assisted Living in 2025 – And How Families Are Paying For It

Understanding Senior Living Costs: Pricing Models, Discounts & Financial Assistance