Explore Open Rooms

1 Contact details
2 What type of senior care service are you looking for?
3 What budget do you have in mind for senior care?
4 How soon do you need to find care?
5 Additional details

Thank you for your interest!

Our team will be in touch shortly to help with next steps.

Nursing Home

Burgess Square Healthcare & Rehab Centre

Nursing Home

Burgess Square Healthcare & Rehab Centre

5801 S Cass Ave, Westmont, IL 60559 View map
Overview of Burgess Square Healthcare & Rehab Centre

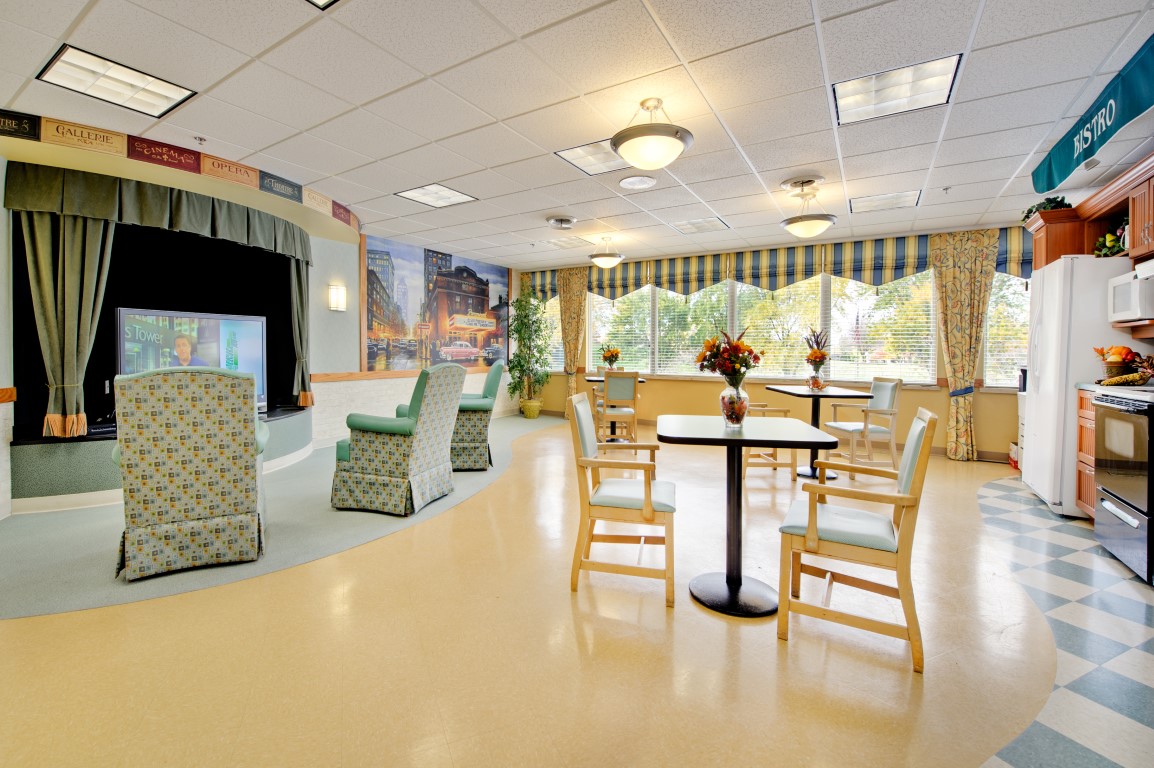
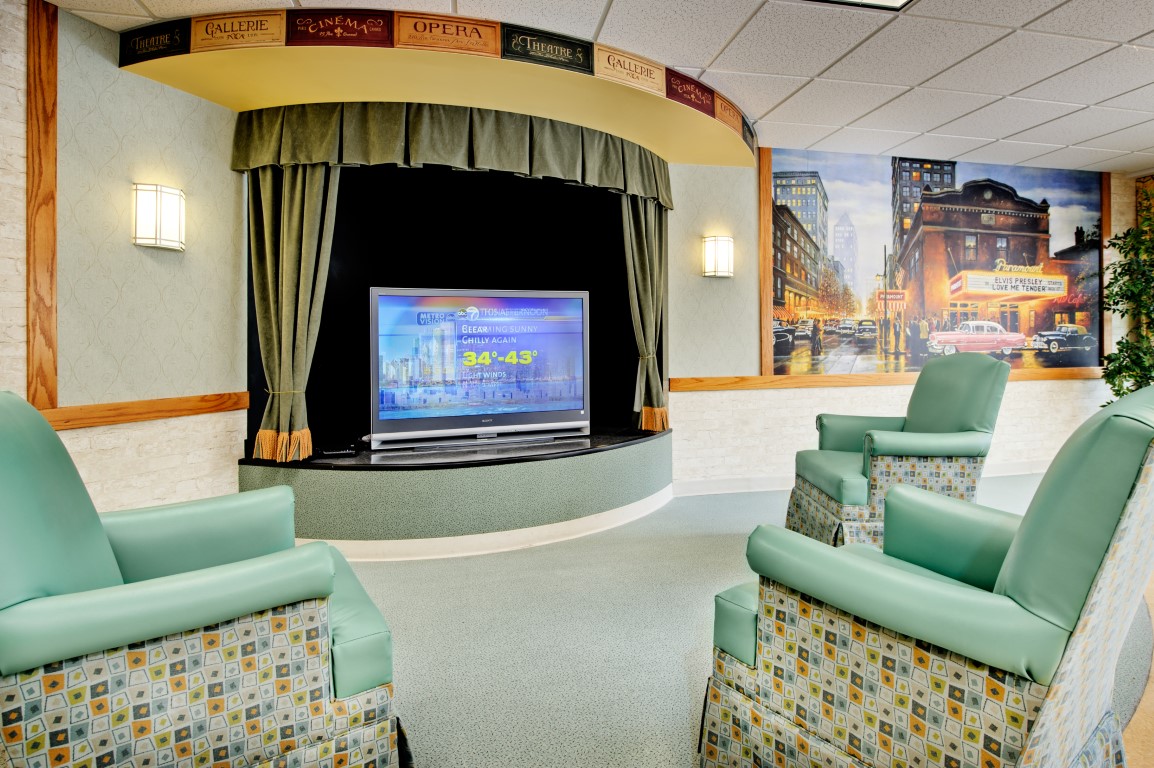
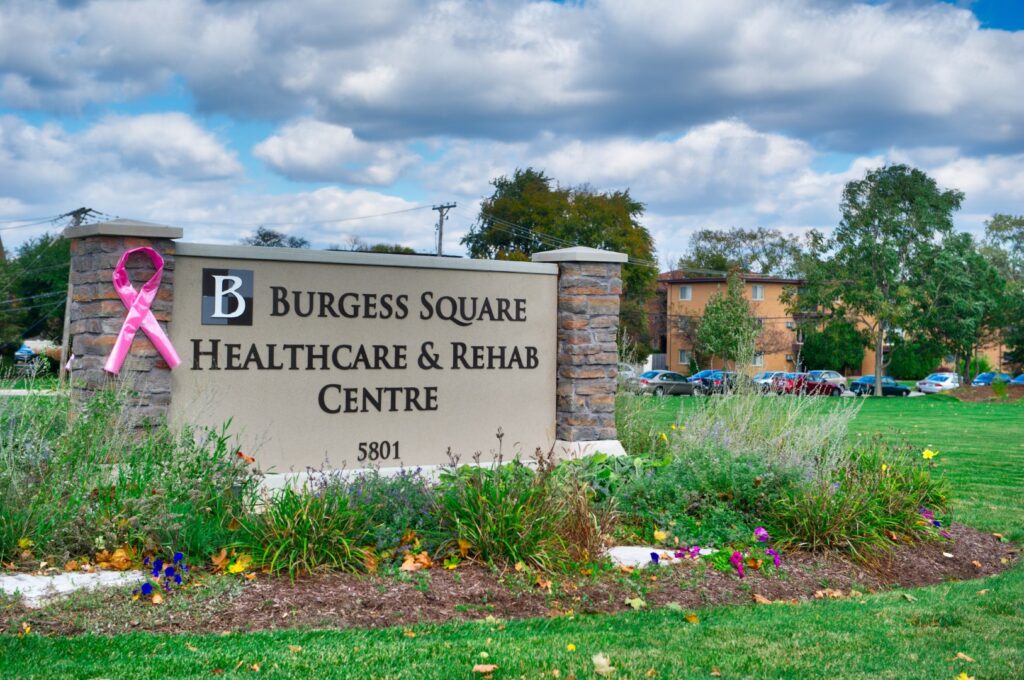
Burgess Square Healthcare & Rehab Centre is an excellent Westmont, IL community offering exceptional rehabilitation services. To guarantee excellent recovery outcomes and a fast healing process, the community provides tailored care plans based on residents’ unique needs, care goals, and preferences. The community also has partnerships with several healthcare providers to ensure residents’ medical needs are well-provided.

The community also provides compassionate hospice and palliative care for those in the final stages of their lives or suffering from serious illnesses. Its compassionate team works closely with residents, their families, and other healthcare providers to deliver care transparently and conveniently. At Burgess Square Healthcare & Rehab Centre, they ensure residents are given all the care and support they need to maintain their maximum potential.

(630) 971-2645

Quality ratings

Measured by Centers for Medicare & Medicaid Services (CMS)

Overall rating Info The Overall CMS Rating combines results from health inspections, staffing levels and quality measures. Health inspections carry the most weight. Staffing and quality scores can increase or decrease the final rating based on performance compared to state and national standards.
5/5
Illinois average: 2.5/5
Health Inspection Info Based on the results of the facility's three most recent standard inspections and any complaint investigations. CMS reviews the number, scope, and severity of deficiencies, with more recent findings weighted more heavily.
4/5
Illinois average: 2.8/5
Staffing Info Measures average nursing staff hours per resident per day, including Registered Nurses (RNs) and total nursing staff. Ratings are adjusted based on the level of care residents require and are compared to state and national benchmarks.
5/5
Illinois average: 2.1/5
Quality Measures Info Based on clinical and physical health indicators reported to CMS, such as hospital readmissions, falls, pressure ulcers, and improvements in mobility. These measures reflect how well residents' health needs are being managed.
4/5
Illinois average: 2.8/5

Nursing care per resident

Info This shows how many total hours of nursing staff time are available per resident each day. Higher numbers usually mean more staff support.
4h 31m per day

This home provides 46% more nursing time per resident than the Illinois average.

Illinois average: 3h 6m per day

Staffing hours breakdown

Info Hours of care per resident per day, broken down by staff type. Data from CMS Medicare.
Staff type Facility State avg National avg
Registered Nurse (RN) Info Registered nurse hours per resident per day. 1h 28m per day 44m per day 41m per day
Nurse Aide Info Nurse aide hours per resident per day. 2h 35m per day 2h 8m per day 2h 21m per day
Total Nursing (Weekend) Info Total number of nurse staff hours per resident per day on weekends. 4h 19m per day 3h 5m per day 3h 26m per day
Physical Therapist Info Physical therapist staff hours per resident per day. 13m per day 3m per day 4m per day
RN (Weekend) Info Registered nurse hours per resident per day on weekends. 1h 9m per day 34m per day 29m per day

Capacity and availability

High-capacity home

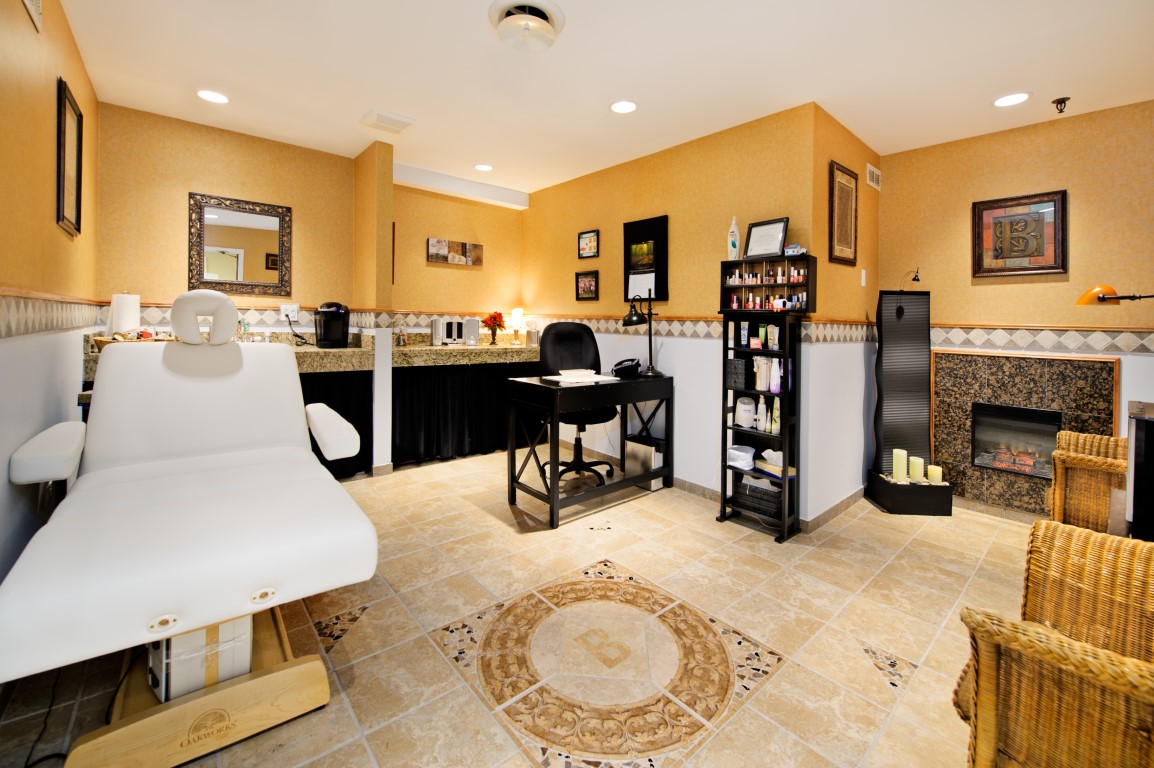
May provide extensive amenities, services and programs.

Total beds 203

This home usually has availability

Lower occupancy suggests more openings may be available.

Lower demand than the Illinois average
Occupancy rate 57.4%
Residents per day (avg) 124
Occupancy rate
57.4%
Residents per day (avg)
124

Who this home usually serves

TYPE OF STAY

Mostly short-term rehab stays

Most residents typically stay for a few weeks or months before returning home or moving on.

Might be optimal for
Short stays Recovery Medicare-covered care

Breakdown by payment type

Medicare

63% of new residents, usually for short-term rehab.

Typical stay 23 days

Private pay

37% of new residents, often for short stays.

Typical stay 1 - 2 months

Finances and operations

Privately-owned community
Operated by a partnership between two or more business owners.
Home revenue
$30.0M
Profit
$770.5K
Privately-owned community Operated by a partnership between two or more business owners.
Home revenue
$30,038,199.00
Profit
$770,455.00
Payroll costs Info The portion of the home's budget spent on staff, including nurses, caregivers, and other employees who support care and operations.
$10.2M
34.1% of revenue
Other operating costs Info All remaining costs needed to run the home, such as food, utilities, building maintenance, supplies and administrative expenses.
$19.0M
Total costs $29.3M

What does this home offer?

Accepts Medicaid icon

Accept Medicaid: Yes

Building type icon
Building type icon

Building Type: 2-story

Dining services icon

Dining Services

Beauty services icon

Beauty Services

Recreational activities icon

Recreational Activities

Exercise program icon

Exercise Programs

Types of Care at Burgess Square Healthcare & Rehab Centre

Nursing Home
Contact Burgess Square Healthcare & Rehab Centre

Health Inspection History

Inspections
Total health inspections 6

Illinois average 10.4


Last Health inspection on Feb 2025

Total health citations 23

Illinois average 36.8

Citations per inspection
3.83

Illinois average 3.68


Health citations are formal notices following inspections when they fail to comply with safety and care standards.

19 of 23 citations resulted from standard inspections; and 4 of 23 resulted from complaint investigations.

Breakdown of citation severity (last 3 years)
Critical Health citations More info 0
100% better than Illinois average

Illinois average: 0.7


Serious Health citations More info 1
72% better than Illinois average

Illinois average: 3.6

0 critical citations More info Illinois average: 0.7

1 serious citation More info Illinois average: 3.6

22 moderate citations More info Illinois average: 32

0 minor citations More info Illinois average: 0.5
Citations history (last 3 years)
Abuse/Neglect moderate citation Info Issues related to protecting resident's from harm, including abuse, neglect, or mistreatment. Feb 11, 2025
Corrected

Infection Control moderate citation Info Issues related to preventing and controlling infections, including hygiene practices and safety protocols. Sep 27, 2024
Corrected

Pharmacy moderate citation Info Issues related to medication management, including how drugs are stored, administered, and monitored. Sep 27, 2024
Corrected

Pharmacy moderate citation Info Issues related to medication management, including how drugs are stored, administered, and monitored. Sep 27, 2024
Corrected

Compare Nursing Homes around Dupage County The information below is reported by the Illinois Department of Public Health, Office of Health Care Regulation.

5 facilities compared · CMS & IL Dept. of Health data · Updated Mar 2026

Burgess Square Healthcare & Rehab Centre
NH

Nursing Home Licensed facility providing 24/7 skilled nursing care for residents with complex, ongoing medical needs. Staffed by RNs, LPNs, and CNAs. Inspected and star-rated annually by CMS. Accepts Medicare (short-term rehab) and Medicaid (long-term care).

Westmont
203
57.4%
-17%
4.52
+28%
+46%
0
23
1
124
58
Hensley, Michael
$29,8M
$10,2M
34.4%
145219
-
Abbington Rehab & Nursing Center
NH

Nursing Home Licensed facility providing 24/7 skilled nursing care for residents with complex, ongoing medical needs. Staffed by RNs, LPNs, and CNAs. Inspected and star-rated annually by CMS. Accepts Medicare (short-term rehab) and Medicaid (long-term care).

Roselle
82
72.4%
+5%
2.40
+32%
-23%
0
40
0
56
70
Maher, Jayne
$5,1M
$3,3M
63.8%
146065
-
West Suburban Nursing and Rehabilitation Center
NH

Nursing Home Licensed facility providing 24/7 skilled nursing care for residents with complex, ongoing medical needs. Staffed by RNs, LPNs, and CNAs. Inspected and star-rated annually by CMS. Accepts Medicare (short-term rehab) and Medicaid (long-term care).

Bloomingdale
259
67.2%
-3%
2.32
+44%
-25%
0
35
2
188
60
A & F Realty Llc
$17,8M
$7,1M
40.2%
145333
Private Rooms
Chateau Nursing and Rehabilitation Center
MC

Memory Care Secured, specialized care for people living with Alzheimer's or dementia. Staff trained in cognitive impairment, with higher staff-to-resident ratios and an environment designed to reduce confusion and wandering risk.

NH

Nursing Home Licensed facility providing 24/7 skilled nursing care for residents with complex, ongoing medical needs. Staffed by RNs, LPNs, and CNAs. Inspected and star-rated annually by CMS. Accepts Medicare (short-term rehab) and Medicaid (long-term care).

Willowbrook
150
74.6%
+8%
2.48
+32%
-20%
2
35
2
123
28
Rothner Health Ventures G Ii, Llc
$13,8M
$6,6M
48.2%
145614
Private / Semi-Private Rooms
Westmont Manor Health and Rehab Center
MC

Memory Care Secured, specialized care for people living with Alzheimer's or dementia. Staff trained in cognitive impairment, with higher staff-to-resident ratios and an environment designed to reduce confusion and wandering risk.

NH

Nursing Home Licensed facility providing 24/7 skilled nursing care for residents with complex, ongoing medical needs. Staffed by RNs, LPNs, and CNAs. Inspected and star-rated annually by CMS. Accepts Medicare (short-term rehab) and Medicaid (long-term care).

Westmont
155
54.7%
-21%
2.86
+45%
-8%
2
52
3
73
58
Nunziato, Ronald
$11,0M
$5,5M
50%
145338
Private / Semi-Private Rooms

Places of interest near Burgess Square Healthcare & Rehab Centre

Address 2.2 miles from city center

Address 5801 S Cass Ave, Westmont, IL 60559

Calculate Travel Distance to Burgess Square Healthcare & Rehab Centre

Add your location

Address

Staffing Data (Q2 2025)

This data corresponds to Q2 2025 and is based on CMS Payroll-Based Journal.

Total staff 256
Employees 216
Contractors 40
Staff to resident ratio 2.13:1
12% better than Illinois average

Illinois average ratio: 1.90:1

Avg staff/day 99
Average shift 7.7 hours
0% compared with Illinois average

Illinois average: 7.6 hours

Total staff hours (quarter) 69,079
Nursing staff breakdown
Registered Nurse

Manages medical care and health needs.

Total count 46
Average shift length Info Average shift length. Calculated as total hours divided by days worked and average staff per day. 7.7 hours

This role is partially covered by contractors.

Licensed Practical Nurse

Assists with medical care and medications.

Total count 34
Average shift length Info Average shift length. Calculated as total hours divided by days worked and average staff per day. 7.6 hours

This role is partially covered by contractors.

Certified Nursing Assistant

Helps with daily care and mobility.

Total count 121
Average shift length Info Average shift length. Calculated as total hours divided by days worked and average staff per day. 7.8 hours

This role is partially covered by contractors.

Contractor staffing

Total hours from contractors

6.2%

4,250 contractor hours this quarter

Certified Nursing Assistant: 24 Licensed Practical Nurse: 11 Registered Nurse: 3 Qualified Activities Professional: 1 Medical Director: 1
Staff by category
Certified Nursing Assistant972412130,58291100%7.8
Registered Nurse4334611,90791100%7.7
Licensed Practical Nurse2311347,67991100%7.6
Speech Language Pathologist9092,8187886%7.6
Mental Health Service Worker8082,7586470%8
Respiratory Therapy Technician9092,7559099%7.3
Clinical Nurse Specialist7072,6896875%7.3
Physical Therapy Assistant8082,4459099%7.1
Physical Therapy Aide5052,1258593%7.7
Administrator2027496571%7.3
Nurse Practitioner2025766369%8
Qualified Activities Professional0115126470%8
Qualified Social Worker1015126470%8
Occupational Therapy Aide1014936369%7.8
Dietitian1014575864%7.9
Medical Director011241213%2
121 Certified Nursing Assistant
% of Days 100%
46 Registered Nurse
% of Days 100%
34 Licensed Practical Nurse
% of Days 100%
9 Speech Language Pathologist
% of Days 86%
8 Mental Health Service Worker
% of Days 70%
9 Respiratory Therapy Technician
% of Days 99%
7 Clinical Nurse Specialist
% of Days 75%
8 Physical Therapy Assistant
% of Days 99%
5 Physical Therapy Aide
% of Days 93%
2 Administrator
% of Days 71%
2 Nurse Practitioner
% of Days 69%
1 Qualified Activities Professional
% of Days 70%
1 Qualified Social Worker
% of Days 70%
1 Occupational Therapy Aide
% of Days 69%
1 Dietitian
% of Days 64%
1 Medical Director
% of Days 13%

Facility Characteristics

Source: CMS Long-Term Care Facility Characteristics (Data as of Jan 2026)

Total census
120 residents
Residents by payment source
Medicare
82 residents (68.3%)
Medicaid
22 residents (18.3%)
Private pay or other
16 residents (13.3%)
Programs & Services
Residents' Group

Residents meet regularly to discuss policies, care quality, and activities

Active Resident Council

Organized group of residents that meets regularly to discuss facility policies, quality of life, and activities.

Quality of care over time

These measures show how residents usually do over time at this home, based on health outcomes and preventive care.

High-risk clinical events score Info A composite score based on pressure ulcers, falls with injury, weight loss, walking ability decline, and activities of daily living decline. 11.1
15% worse than Illinois average

Illinois average: 9.7

Functional decline score Info A composite score based on activities of daily living decline, walking ability decline, and incontinence. 25.9
39% worse than Illinois average

Illinois average: 18.6

Long-stay resident measures
Average Illinois avg: 3.6 Info CMS star rating based on long-stay quality measure performance. 5 stars = significantly above average, 1 star = significantly below average.
Need for Help with Daily Activities Increased Info Percent of long-stay residents whose need for help with daily activities has increased 15.6%
In line with Illinois average

Illinois average: 15.5%

Walking Ability Worsened Info Percent of long-stay residents whose ability to move independently worsened 22.1%
20% worse than Illinois average

Illinois average: 18.4%

Low Risk Residents with Bowel/Bladder Incontinence Info Percent of low risk long-stay residents who lose control of their bowels or bladder 40.0%
85% worse than Illinois average

Illinois average: 21.6%

Falls with Major Injury Info Percent of long-stay residents experiencing one or more falls with major injury 2.7%
19% better than Illinois average

Illinois average: 3.4%

High Risk Residents with Pressure Ulcers Info Percent of long-stay high risk residents with pressure ulcers 9.5%
80% worse than Illinois average

Illinois average: 5.3%

Urinary Tract Infection Info Percent of long-stay residents with a urinary tract infection 6.2%
242% worse than Illinois average

Illinois average: 1.8%

Lost Too Much Weight Info Percent of long-stay residents who lose too much weight 5.8%
11% better than Illinois average

Illinois average: 6.5%

Depressive Symptoms Info Percent of long-stay residents who have depressive symptoms 2.9%
94% better than Illinois average

Illinois average: 48.1%

Antipsychotic Use Info Percent of long-stay residents who received an antipsychotic medication 11.8%
42% better than Illinois average

Illinois average: 20.2%

Pneumococcal Vaccine Info Percent of long-stay residents assessed and appropriately given the pneumococcal vaccine 97.3%
9% better than Illinois average

Illinois average: 89.2%

Influenza Vaccine Info Percent of long-stay residents assessed and appropriately given the seasonal influenza vaccine 100.0%
9% better than Illinois average

Illinois average: 91.6%

Hospitalizations per 1,000 days Info Number of hospitalizations per 1,000 long-stay resident days. 1.36
34% better than Illinois average

Illinois average: 2.05

ED visits per 1,000 days Info Number of outpatient emergency department visits per 1,000 long-stay resident days. 0.26
88% better than Illinois average

Illinois average: 2.25

Short-stay resident measures
Above average Illinois avg: 2.0 Info CMS star rating based on short-stay quality measure performance. 5 stars = much above average, 1 star = much below average.
Pneumococcal Vaccine Info Percent of short-stay residents assessed and appropriately given the pneumococcal vaccine 92.5%
35% better than Illinois average

Illinois average: 68.3%

Antipsychotic medication increase Info Percent of short-stay residents who newly received an antipsychotic medication 1.1%
51% better than Illinois average

Illinois average: 2.3%

Influenza Vaccine Info Percent of short-stay residents assessed and appropriately given the seasonal influenza vaccine 90.2%
43% better than Illinois average

Illinois average: 63.0%

Re-hospitalized after SNF stay Info Percentage of short-stay residents who were re-hospitalized after their nursing home admission. 24.4%
7% better than Illinois average

Illinois average: 26.2%

Emergency department visits Info Percentage of short-stay residents who had an outpatient emergency department visit. 8.0%
43% better than Illinois average

Illinois average: 14.0%

Falls with major injury Info Percentage of SNF residents who experience falls with major injury during their stay. 0.5%
34% better than Illinois average

Illinois average: 0.8%

Ability to care for self at discharge Info Percentage of residents at or above expected ability to care for themselves at discharge. 71.5%
33% better than Illinois average

Illinois average: 53.7%

Successful return to home or community Info Rate of successful return to home or community from a skilled nursing facility. 62.3%
23% better than Illinois average

Illinois average: 50.6%

Guides for Better Senior Living

Care Cost Calculator: See Prices in Your Area

Nursing Home Data Explorer

Don’t Wait Too Long: 7 Red Flag Signs Your Parent Needs Assisted Living Now

The True Cost of Assisted Living in 2025 – And How Families Are Paying For It

Understanding Senior Living Costs: Pricing Models, Discounts & Financial Assistance

Financial Aid for Illinois Seniors

Get financial aid guidance

Community Care Program

Illinois CCP

Age 60+, Illinois resident, at risk of nursing home placement.

~$1,215/month (individual).

$17,500 (individual, excludes home, car).

High demand in urban areas; waitlists possible.

Illinois Respite Program

IL Respite (via NFCSP)

Caregiver of someone 60+ (or with dementia), Illinois resident.

No strict limit; prioritizes low-income.

Not applicable.

Limited slots; urban/rural balance.

Supportive Living Program (SLP)

Illinois Medicaid Supportive Living Program

Age 65+ or 22-64 with disability, Illinois resident, Medicaid-eligible, needs moderate assistance (not nursing home-level).

~$2,829/month (300% FBR, individual); QIT allowed.

$2,000 (individual), $3,000 (couple) (excludes home, car).

~200 SLP sites statewide; room/board not covered.

Persons Who Are Elderly Waiver

Illinois Medicaid Elderly Waiver

Age 65+, Illinois resident, Medicaid-eligible, nursing home-level care need.

~$2,829/month (300% FBR, individual).

$2,000 (individual), $3,000 (couple).

Part of HealthChoice Illinois; consumer-directed options available.

Medicare Savings Program (MSP)

Illinois Medicare Savings Program

Age 65+ or disabled, Illinois resident, Medicare Part A/B.

~$2,510/month (QMB), ~$3,380/month (SLMB), ~$3,598/month (QI)—individual.

$9,430 (individual), $14,130 (couple).

Three tiers; no waitlist.

Senior Community Service Employment Program (SCSEP)

Illinois SCSEP

Age 55+, unemployed, low-income, Illinois resident.

~$1,983/month (125% FPL).

Not specified; income-focused.

Priority for veterans, rural residents.

Optional State Supplementation (OSS)

Illinois Optional State Supplementation

Age 65+ or disabled, Illinois resident, in approved facility, SSI recipient or low-income.

~$1,004/month (including SSI).

$2,000 (individual), $3,000 (couple).

~$50-$500/month based on facility type.

VA Aid and Attendance (A&A) and Housebound Benefits

Illinois VA Aid and Attendance/Housebound

Age 65+ or disabled veteran/spouse, Illinois resident, wartime service, need for ADL help (A&A) or homebound.

Net income < ~$1,984/month (veteran with dependent, A&A); pension offsets income.

~$155,356 (net worth limit).

High veteran demand in urban/rural areas.