Canyon Vista Post-Acute

Nursing Home in Clark County

CMS overall rating Info The Overall CMS Rating is scored from 1 to 5 stars and combines results from health inspections, staffing levels, and quality measures. Health inspections carry the most weight. Staffing and quality scores can increase or decrease the final rating based on performance compared to state and national standards.

Overview of Canyon Vista Post-acute

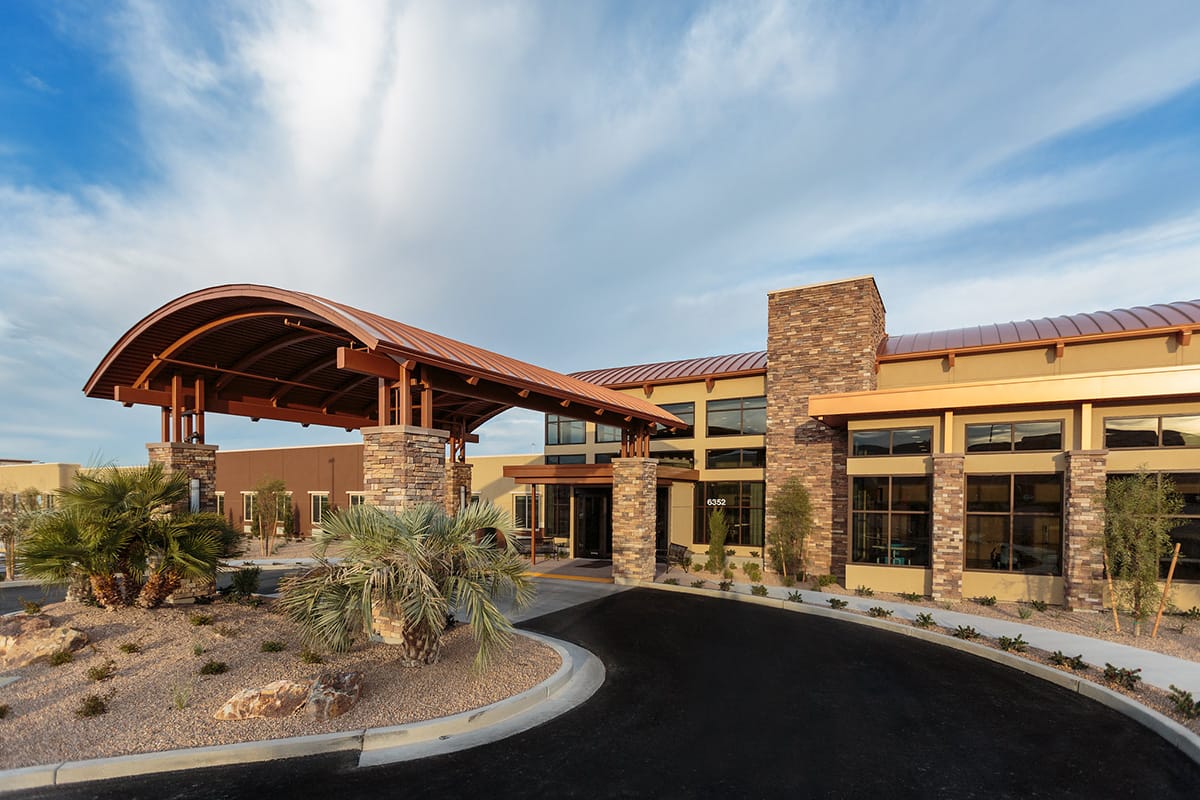
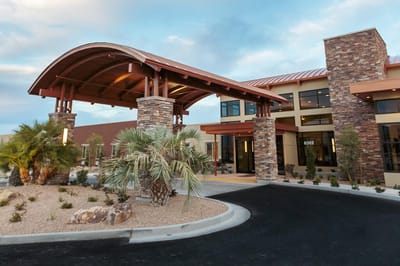
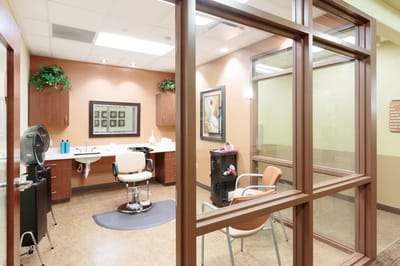
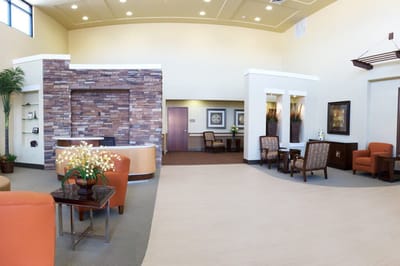
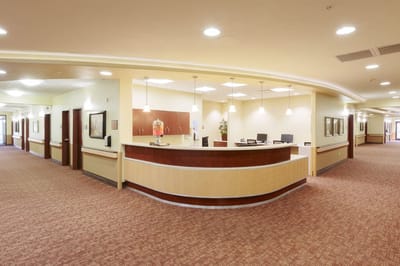
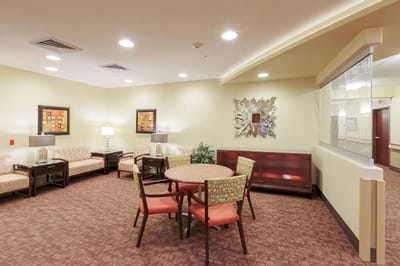
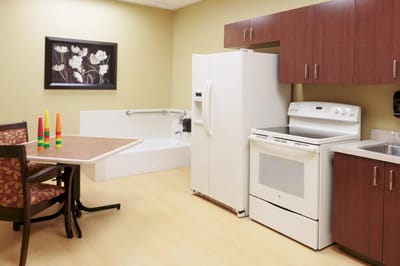
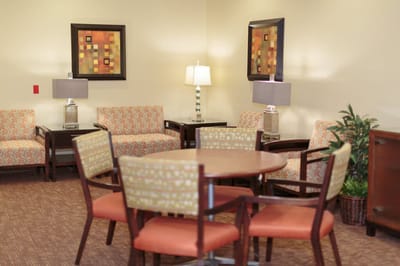
Experience the best of your golden years with Canyon Vista Post-acute, a distinguished community set near Southern Hills Hospital and Medical Center in Las Vegas, NV, offering skilled nursing and rehabilitation. With comprehensive care options, including behavioral health, wound care, memory care, respite care, sub-acute care, and hospice services, residents are guaranteed to find the care they need. Here, residents ease their worries with a compassionate and highly trained team attending to their needs 24/7. The community also assists residents and their families with their social needs to jump back into their lives without worries.

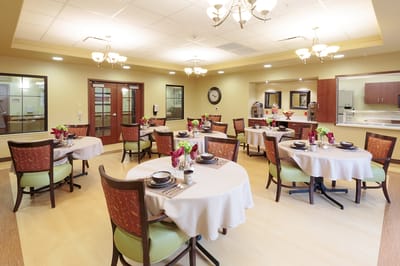
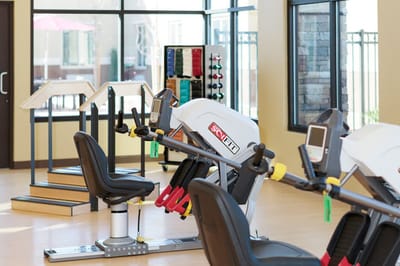
Enriching programs and stimulating activities are also conducted, allowing residents to live actively and remain socially engaged. Delightful and healthy meals are also served to meet residents’ dietary needs and preferences. Live a blissful retirement accompanied by the community’s dedicated care and state-of-the-art amenities.

(702) 541-6200

Quality ratings

Measured by Centers for Medicare & Medicaid Services (CMS)

Overall rating Info The Overall CMS Rating combines results from health inspections, staffing levels and quality measures. Health inspections carry the most weight. Staffing and quality scores can increase or decrease the final rating based on performance compared to state and national standards.
3/5 ▲ 0.3 Nevada average: 2.7/5
Health Inspection Info Based on the results of the facility's three most recent standard inspections and any complaint investigations. CMS reviews the number, scope, and severity of deficiencies, with more recent findings weighted more heavily.
2/5 ▼ 0.6 Nevada average: 2.6/5
Staffing Info Measures average nursing staff hours per resident per day, including Registered Nurses (RNs) and total nursing staff. Ratings are adjusted based on the level of care residents require and are compared to state and national benchmarks.
2/5 ▼ 0.8 Nevada average: 2.8/5
Quality Measures Info Based on clinical and physical health indicators reported to CMS, such as hospital readmissions, falls, pressure ulcers, and improvements in mobility. These measures reflect how well residents' health needs are being managed.
5/5 ▲ 1.3 Nevada average: 3.7/5

Staffing hours breakdown

Info Daily nursing hours per resident by staff type, reported to CMS. Higher is generally better — compare this facility to state and national averages to see where staffing stands.

Hours per resident per day — compared to Nevada state averages

Total nursing care / resident Info This home is ranked 34th out of 36 homes in Nevada.

Total adjusted nursing hours per resident per day, combining RN, LPN, and aide time. CMS adjusts this for case-mix so facilities can be fairly compared.
3h 2m per day
Rank #34 / 36Nurse hours — state benchmarkedThis home is ranked 34th out of 36 homes in Nevada.Shows adjusted nurse hours per resident per day benchmarked to the Nevada average, with a ranking across 36 Nevada SNFs. More hours mean more direct care. The national average is about 3.5 hrs; below 3.0 is a red flag.
This facility Nevada avg (3h 34m per day)
vs Nevada avg
-15%

0 of 5 metrics below state avg

Standout metric Physical Therapist is +160% above state avg
Staff type Hours / day vs state avg
Registered Nurse (RN) Info RNs hold the highest nursing license and can assess residents, interpret test results, and direct care plans. More RN hours per day often signals stronger clinical oversight and faster response to health changes. 1h 32m per day ▲ 44% State avg: 1h 4m per day · National avg: 41m per day
Nurse Aide Info Certified Nurse Aides (CNAs) provide the most direct day-to-day assistance: bathing, dressing, feeding, and mobility. Nurse aide hours are typically the largest staffing category and directly affect residents' quality of life. 2h 27m per day ▲ 3% State avg: 2h 23m per day · National avg: 2h 21m per day
Total Nursing (Weekend) Info Combined nursing hours (RN + LPN + Nurse Aide) per resident per day on weekends. Staffing often drops on weekends — this figure reveals whether the facility maintains adequate coverage outside of weekday hours. 3h 58m per day ▲ 3% State avg: 3h 51m per day · National avg: 3h 26m per day
Physical Therapist Info Hours per resident per day provided by licensed Physical Therapists (PTs) or PT Assistants. PT services help residents recover mobility after injury or illness and are especially important for post-acute (short-stay) rehabilitation. 13m per day ▲ 160% State avg: 5m per day · National avg: 4m per day
RN (Weekend) Info Registered nurse hours specifically on weekends. Facilities sometimes reduce RN presence on Saturdays and Sundays — a low weekend RN figure compared to weekday hours can indicate reduced clinical oversight when most administrative staff are absent. 1h 23m per day ▲ 63% State avg: 51m per day · National avg: 29m per day

Capacity and availability

Avg. Length of Stay
25 days

Who this home usually serves

TYPE OF STAY

Primarily short stays

Residents typically stay for brief periods, with frequent admissions and discharges throughout the year.

Might be optimal for
Post-acute recovery Temporary care Transitional stays

Breakdown by payment type

Medicare

19% of new residents, usually for short-term rehab.

Typical stay 25 days

Private pay

80% of new residents, often for short stays.

Typical stay 21 days

Finances and operations

Privately-owned community
Home revenue
$34.5M
Profit
$2.1M
Privately-owned community
Home revenue
$34.5M Rank #6 / 39Revenue — state benchmarkedThis home is ranked 6th out of 39 homes in Nevada.Shows this facility's annual revenue compared to the Nevada SNF average. Higher revenue generally means more resources for staffing and capital — read alongside Payroll %.
Profit
$2.1M
Payroll costs Info The portion of the home's budget spent on staff, including nurses, caregivers, and other employees who support care and operations. Rank #7 / 39Payroll — state benchmarkedThis home is ranked 7th out of 39 homes in Nevada.Shows total annual staff payroll benchmarked to the Nevada average. Higher payroll investment relative to peers often signals better staffing and less reliance on cheaper contract labor.
$10.6M
30.7% of revenue Rank #30 / 39Payroll % — state benchmarkedThis home is ranked 30th out of 39 homes in Nevada.Shows payroll as a percentage of revenue versus the Nevada average. Well-run SNFs often land around 55–65%. Below 25% may signal understaffing or heavy agency use — read with Staffing ratings.
Other operating costs Info All remaining costs needed to run the home, such as food, utilities, building maintenance, supplies and administrative expenses.
$21.8M
Total costs $32.4M
Bed community size
120-bed community
A larger shared setting that may offer more common spaces and organized community services.
Years in operation
10 years in operation
A community with a solid operating history and experience delivering ongoing care.
Walk Score
Walk Score: 36 / 100 Rank #25 / 34Walk Score — state benchmarkedThis home is ranked 25th out of 34 homes in Nevada.Shows how walkable this facility's neighborhood is compared to the average Walk Score across Nevada SNFs. Higher scores benefit residents, families, and staff.
Somewhat walkable. A few nearby services may be reachable on foot, but most trips require transportation.

About this community

Occupancy

Occupancy rate
102%
Rank #10 / 39Occupancy rate — state benchmarkedThis home is ranked 10th out of 39 homes in Nevada.Shows this facility's occupancy rate versus the Nevada average, with its statewide rank out of 39. Higher occupancy signals strong local demand and financial stability.
Higher than the Nevada average: 81.5%
Occupied beds
122 / 120
Average residents 92 per day

License Details

Facility TypeFacility For Skilled Nursing
StatusActive
IssuanceNovember 5, 2015
ExpirationDecember 31, 2026
AwardsBest Nursing Homes – Short-Term Rehabilitation award from U.S. News

Ownership & Operating Entity

Canyon Vista Post-Acute is administrated by Joshua Roberts.

Type Of Units

Independent Living
0 units
Assisted Living Beds (Low Income) Units designated for residents who qualify for low-income assistance programs.
0 units
SNF (Skilled Nursing)
120 units
Total beds
120 units

Payment & Insurance

1 service
Accept Medicare

Therapy & Rehabilitation

3 services
Rehabilitation Services
Respite Care
Short-Term Rehab

Staffing & Medical

1 service
24-Hour Staffing

Amenities & Lifestyle

State-Of-The-Art Rehab Gym
Spacious Courtyards
Common Areas
Salon Services
ActivitiesAn engaging daily schedule allows patients to be as active and social as they want to be.
Specific ProgramsActivities, Respiratory Therapy, Pain Management, Dietary Program, Sub-Acute Care, Complex Wound Care, Alzheimer’s & Dementia Care, Hospice Services, Behavioral Health, Diabetes Care
Operating HoursMonday – Friday: 24/7; Weekends: 24/7

Dining & Nutrition

Food DescriptionMeals are created to meet the specific dietary and therapeutic needs of patients.
Meals IncludedYes
Special DietsYes

What does this home offer?

Accepts Medicaid icon

Accept Medicaid: Yes

Total residents icon

Total Residents: 117 Residents

Housing options icon

Housing Options: Private / Semi-private Rooms

Building type icon
Building type icon

Building Type: 2-story
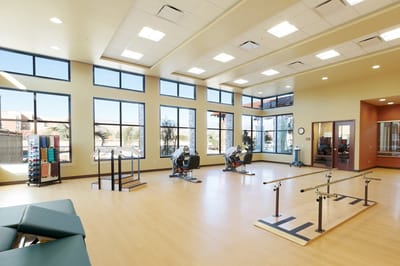
Dining services icon

Dining Services

Health Programs icon

Health Programs

Types of Care at Canyon Vista Post-Acute

Nursing Home

Contact Canyon Vista Post-Acute

Access & Eligibility

Ways to qualify for care at this community, including accepted programs and payment options.

Medicare Accepted

This facility is certified for eligible Medicare services.

Payment & Funding Options

Medicare Long-term care insurance

Inspection History

In Nevada, the Department of Health and Human Services, Bureau of Health Care Quality and Compliance performs unannounced onsite surveys to evaluate resident safety and care quality.

56 visits/inspections Info Inspections are mandatory, regular evaluations conducted by state health departments or regulatory agencies. They ensure the community provides safe, compliant care, covering areas like resident health, staff and management.

Nevada average: 21 inspections

Latest inspection

Date March 6, 2025

253 deficiencies

Deficiencies indicate regulatory issues. A higher number implies the facility had several areas requiring improvement.

Nevada average: 62 deficiencies

Inspection Report Summary for Canyon Vista Post-Acute

The most recent inspection on December 5, 2025, identified deficiencies related to delays in providing resident medical records and inadequate discharge medication documentation and education. Earlier inspections showed a pattern of deficiencies involving care planning, call light response, nephrostomy tube care, pain management, medication administration, and infection control, with some substantiated complaints and corrective actions implemented. Notable issues included failure to maintain timely call light responses, incomplete care plans for residents with specific needs, and lapses in medication and nutrition management. Several complaint investigations were substantiated, but enforcement actions such as fines or license suspensions were not listed in the available reports. The facility’s inspection history shows ongoing challenges with resident care documentation and responsiveness, with some improvements noted in follow-up surveys but persistent issues over time.

Health Inspection History

Inspections
Total health inspections 5

Nevada average 5.1


Last Health inspection on Mar 2025

Total health citations
36 Rank #23 / 38Health citations — state benchmarkedThis home is ranked 23rd out of 38 homes in Nevada.Shows this facility's total health deficiency citations benchmarked to the Nevada state average, with a ranking across all 38 NV SNFs. Lower citation counts earn a better rank.

Nevada average 36.2

Citations per inspection
7.2

Nevada average 7.08


Health citations are formal notices following inspections when they fail to comply with safety and care standards.

23 of 36 citations resulted from standard inspections; 7 of 36 resulted from complaint investigations; and 6 of 36 came from combined inspections (standard and complaint).

Breakdown of citation severity (last 3 years)
Critical Health citations More info
1 Rank #1 / 17Severe citations — state benchmarkedThis home is ranked 1st out of 17 homes in Nevada.Shows citations where actual resident harm occurred, compared to the Nevada average and ranked across 17 SNFs statewide. Even a single severe citation is significant — lower is always better.
900% worse than Nevada average

Nevada average: 0.1


Serious Health citations More info 0
100% better than Nevada average

Nevada average: 0.5

1 critical citation More info Nevada average: 0.1

0 serious citations More info Nevada average: 0.5

35 moderate citations More info Nevada average: 35

0 minor citations More info Nevada average: 0.5
Citations history (last 3 years)
Environmental moderate citation Info Issues related to building safety, cleanliness, maintenance, and overall living conditions. Mar 06, 2025
Corrected

Nutrition moderate citation Info Issues related to food quality, meal service, and resident's nutritional needs. Mar 06, 2025
Corrected

Pharmacy moderate citation Info Issues related to medication management, including how drugs are stored, administered, and monitored. Mar 06, 2025
Corrected

Quality of Care moderate citation Info Issues related to how well residents receive appropriate treatment and support for their medical and daily care needs. Mar 06, 2025
Corrected

Compare Nursing Homes around Clark County The information below is reported by the Nevada Department of Health and Human Services, Bureau of Health Care Quality and Compliance.

5 facilities compared · CMS & NV Dept. of Health data · Updated Apr 2026

Filter by care type
College Park Rehabilitation Center
NH

Nursing Home Licensed facility providing 24/7 skilled nursing care for residents with complex, ongoing medical needs. Staffed by RNs, LPNs, and CNAs. Inspected and star-rated annually by CMS. Accepts Medicare (short-term rehab) and Medicaid (long-term care).

North Las Vegas (East Cheyenne Avenue) 98 86.6% +6% 2.78 +2% -31% 1 19 3.8 0 91 - 46 Aufiero, Lauren $17.4M $6.4M 36.9% 295055
Henderson Health and Rehab
NH

Nursing Home Licensed facility providing 24/7 skilled nursing care for residents with complex, ongoing medical needs. Staffed by RNs, LPNs, and CNAs. Inspected and star-rated annually by CMS. Accepts Medicare (short-term rehab) and Medicaid (long-term care).

Henderson (Valley View) 266 89.1% +9% 3.66 -9% -9% 1 37 4.6 1 237 - 22 Anderson, Seth $34.9M $13.7M 39.3% 295037
Coronado Ridge Skilled Nursing and Rehabilitation Center
NH

Nursing Home Licensed facility providing 24/7 skilled nursing care for residents with complex, ongoing medical needs. Staffed by RNs, LPNs, and CNAs. Inspected and star-rated annually by CMS. Accepts Medicare (short-term rehab) and Medicaid (long-term care).

Henderson 121 85.9% +5% - - +2% - 0 29 4.1 0 - - 72 Jensen, Rhett $25.4M $8.3M 32.5% 295099
Canyon Vista Post-Acute
NH

Nursing Home Licensed facility providing 24/7 skilled nursing care for residents with complex, ongoing medical needs. Staffed by RNs, LPNs, and CNAs. Inspected and star-rated annually by CMS. Accepts Medicare (short-term rehab) and Medicaid (long-term care).

Las Vegas (Rhodes Ranch) 120 91.6% +12% 3.03 +50% -25% 2 36 7.2 1 118 - 36 Nevada Opco Llc $34.5M $10.6M 30.7% 295093
El Jen Healthcare and Rehabilitation Services
NH

Nursing Home Licensed facility providing 24/7 skilled nursing care for residents with complex, ongoing medical needs. Staffed by RNs, LPNs, and CNAs. Inspected and star-rated annually by CMS. Accepts Medicare (short-term rehab) and Medicaid (long-term care).

Las Vegas (Rancho) 144 95.2% +17% 4.36 -48% +8% 0 58 5.8 2 138 A+ 41 El Jen Snf Operations Holdings Llc $18.9M $9.3M 49.2% 295008

Financial Assistance for
Nursing Home in Nevada

Get Financial aid guidance

Home and Community Based Waiver

Nevada Medicaid HCBW

Age 65+ or disabled
General Nevada resident, Medicaid-eligible, nursing home-level care need.
Income Limits (2025) ~$2,829/month 300% FBR, individual
Asset Limits $2,000 (individual), $3,000 (couple).
NV

High urban demand (e.g., Las Vegas); rural challenges.

Benefits
Personal care (5-7 hours/day) Respite (240 hours/year) Home modifications ($1,500 avg.) Meals ($6/meal)

Nevada Senior Services Program

NV SSP

Age 60+
General Nevada resident, at risk of decline.
Income Limits ~$1,800/month individual, varies
Asset Limits $5,000 individual
NV

Limited funding; rural focus.

Benefits
In-home care (3-5 hours/week) Respite (up to 10 days/year) Transportation (~5 trips/month)

Personal Care Services (PCS)

Nevada Personal Care Services

Age 19+ (65+ for seniors focus)
General Nevada resident, Medicaid-eligible, needs help with 1+ ADL.
Income Limits (2025) ~$967/month (individual); spenddown allowed.
Asset Limits $2,000 (individual), $3,000 (couple).
NV

Self-directed (family can be paid); statewide via DHHS.

Benefits
Personal care (4-6 hours/day) Limited homemaker services Respite (~200 hours/year)

Senior Rx Program

Nevada Senior Rx Program

Age 65+
General Nevada resident, enrolled in Medicare Part D, income below limit.
Income Limits (2025) ~$2,510/month (individual), ~$3,380/month (couple).
Asset Limits Not assessed.
NV

Covers up to $38.75/month premium; funded by tobacco settlement.

Benefits
Prescription drug premium assistance (~$465/year) Reducing out-of-pocket costs

Medicare Savings Program (MSP)

Nevada Medicare Savings Program

Age 65+ or disabled
General Nevada resident, Medicare Part A/B.
Income Limits (2025) ~$2,510/month (QMB), ~$3,380/month (SLMB), ~$3,598/month (QI)—individual.
Asset Limits $9,430 (individual), $14,130 (couple).
NV

Three tiers; no waitlist; includes Extra Help for Part D.

Benefits
Covers Part B premiums ($174.70/month) Deductibles ($240/year) Copays (~20%)

Nevada Caregiver Support Program (via NFCSP)

Nevada Caregiver Support Program

Age
General Caregivers of 60+ needing care or 55+ caregivers of others; Nevada resident; functional needs (2+ ADLs).
Income Limits (2025) Prioritizes ~$24,980/year (individual); no strict cap.
Asset Limits Not assessed; need-based.
NV

5 AAAs; prioritizes rural, low-income caregivers.

Benefits
Respite (4-6 hours/week or 5 days/year) Adult day care ($60/day) Training Supplies (~$500/year)

VA Aid and Attendance (A&A) and Housebound Benefits

Nevada VA Aid and Attendance/Housebound

Age 65+ or disabled veteran/spouse
General Nevada resident, wartime service, need for ADL help (A&A) or homebound.
Income Limits (2025) Net income < ~$1,984/month (veteran with dependent, A&A); pension offsets income.
Asset Limits ~$155,356 net worth limit
NV

High veteran demand in urban/rural areas.

Benefits
Cash (~$1,433-$2,642/month veteran, ~$951-$1,318 spouse) for care costs (e.g., in-home, assisted living)

Places of interest near Canyon Vista Post-Acute

Address 16.6 miles from city center Info Estimated distance in miles from Las Vegas's city center to Canyon Vista Post-Acute's address, calculated via Google Maps.

Calculate Travel Distance to Canyon Vista Post-Acute

Add your location

Address

Staffing Data (Q2 2025)

This data corresponds to Q2 2025 and is based on CMS Payroll-Based Journal.

Total staff 207
Employees 205
Contractors 2
Staff to resident ratio 1.80:1
15% better than Nevada average

Nevada average ratio: 1.57:1

Avg staff/day 79
Average shift 9.2 hours
5% better than Nevada average

Nevada average: 8.8 hours

Total staff hours (quarter) 66,240
Nursing staff breakdown
Registered Nurse

Manages medical care and health needs.

Total count 44
Average shift length Info Average shift length. Calculated as total hours divided by days worked and average staff per day. 9.3 hours

No contractors work on this role.

Licensed Practical Nurse

Assists with medical care and medications.

Total count 26
Average shift length Info Average shift length. Calculated as total hours divided by days worked and average staff per day. 9.9 hours

No contractors work on this role.

Certified Nursing Assistant

Helps with daily care and mobility.

Total count 75
Average shift length Info Average shift length. Calculated as total hours divided by days worked and average staff per day. 10.3 hours

No contractors work on this role.

Contractor staffing

Total hours from contractors

0.5%

364 contractor hours this quarter

Medical Director: 1 Occupational Therapy Assistant: 1
Staff by category
Certified Nursing Assistant 75 0 75 24,246 91 100% 10.3
Registered Nurse 44 0 44 13,496 91 100% 9.3
Licensed Practical Nurse 26 0 26 9,668 91 100% 9.9
Speech Language Pathologist 11 0 11 3,499 91 100% 8
Physical Therapy Assistant 10 0 10 3,079 89 98% 8
Physical Therapy Aide 7 0 7 2,640 90 99% 8.2
Respiratory Therapy Technician 6 0 6 2,153 91 100% 8.4
Qualified Social Worker 5 0 5 1,245 78 86% 7.5
RN Director of Nursing 4 0 4 1,204 66 73% 8.1
Other Dietary Services Staff 4 0 4 975 88 97% 6.8
Dental Services Staff 4 0 4 886 64 70% 7
Clinical Nurse Specialist 2 0 2 709 75 82% 8.1
Therapeutic Recreation Specialist 2 0 2 536 65 71% 7.6
Dietitian 1 0 1 528 64 70% 8.2
Administrator 1 0 1 512 64 70% 8
Mental Health Service Worker 2 0 2 317 48 53% 6.2
Medical Director 0 1 1 293 39 43% 7.5
Occupational Therapy Aide 1 0 1 186 25 27% 7.4
Occupational Therapy Assistant 0 1 1 71 25 27% 2.8
75 Certified Nursing Assistant
% of Days 100%
44 Registered Nurse
% of Days 100%
26 Licensed Practical Nurse
% of Days 100%
11 Speech Language Pathologist
% of Days 100%
10 Physical Therapy Assistant
% of Days 98%
7 Physical Therapy Aide
% of Days 99%
6 Respiratory Therapy Technician
% of Days 100%
5 Qualified Social Worker
% of Days 86%
4 RN Director of Nursing
% of Days 73%
4 Other Dietary Services Staff
% of Days 97%
4 Dental Services Staff
% of Days 70%
2 Clinical Nurse Specialist
% of Days 82%
2 Therapeutic Recreation Specialist
% of Days 71%
1 Dietitian
% of Days 70%
1 Administrator
% of Days 70%
2 Mental Health Service Worker
% of Days 53%
1 Medical Director
% of Days 43%
1 Occupational Therapy Aide
% of Days 27%
1 Occupational Therapy Assistant
% of Days 27%

Facility Characteristics

Source: CMS Long-Term Care Facility Characteristics (Data as of Jan 2026)

Total residents 115
Medicare
71
61.7% of residents
Medicaid
2
1.7% of residents
Private pay or other
42
36.5% of residents

Quality of care over time

These measures show how residents usually do over time at this home, based on health outcomes and preventive care.

Short-stay resident measures
Significantly above average Nevada avg: 3.1 Info CMS star rating based on short-stay quality measure performance. 5 stars = much above average, 1 star = much below average.
Pneumococcal Vaccine Info Percent of short-stay residents assessed and appropriately given the pneumococcal vaccine 98.1%
17% better than Nevada average

Nevada average: 83.9%

Antipsychotic medication increase Info Percent of short-stay residents who newly received an antipsychotic medication 0.4%
81% better than Nevada average

Nevada average: 2.0%

Influenza Vaccine Info Percent of short-stay residents assessed and appropriately given the seasonal influenza vaccine 93.8%
16% better than Nevada average

Nevada average: 80.7%

Re-hospitalized after SNF stay Info Percentage of short-stay residents who were re-hospitalized after their nursing home admission. 17.3%
26% better than Nevada average

Nevada average: 23.4%

Emergency department visits Info Percentage of short-stay residents who had an outpatient emergency department visit. 9.0%
8% better than Nevada average

Nevada average: 9.8%

Falls with major injury Info Percentage of SNF residents who experience falls with major injury during their stay. 0.7%
5% better than Nevada average

Nevada average: 0.8%

Ability to care for self at discharge Info Percentage of residents at or above expected ability to care for themselves at discharge. 80.1%
49% better than Nevada average

Nevada average: 53.7%

Successful return to home or community Info Rate of successful return to home or community from a skilled nursing facility. 54.9%
9% better than Nevada average

Nevada average: 50.6%

Penalties and fines

Federal penalties imposed by CMS for regulatory violations, including civil money penalties (fines) and denials of payment for new Medicare/Medicaid admissions.

Source: CMS Penalties Database (Data as of Jan 2026)

Total fines amount $45K
32% higher than Nevada average

Nevada average: $34K

Number of fines 2 Rank #11 / 15Federal fines — state benchmarkedThis home is ranked 11th out of 15 homes in Nevada.Shows this facility's CMS fine count alongside the Nevada average, and where it ranks among all 15 skilled nursing facilities in the state. Fewer fines mean a better rank.
42% more fines than Nevada average

Nevada average: 1.4

Payment Denials Info Serious action where Medicare and/or Medicaid temporarily stops payments for new residents until issues are fixed. 0
100% fewer payment denials than Nevada average

Nevada average: 0.1

Fines amount comparison
This facility $45K
Nevada average $34K
Penalty History

Penalties are imposed by CMS for violations of federal nursing home regulations.

Civil Money Penalty Info Fines imposed for noncompliance, which can be assessed per day or per instance of violation. Mar 6, 2025
$35K
Civil Money Penalty Info Fines imposed for noncompliance, which can be assessed per day or per instance of violation. Jan 27, 2023
$10K

Last updated: Jan 2026

Guides for Better Senior Living

Care Cost Calculator: See Prices in Your Area

Nursing Home Data Explorer

Don’t Wait Too Long: 7 Red Flag Signs Your Parent Needs Assisted Living Now

The True Cost of Assisted Living in 2025 – And How Families Are Paying For It

Understanding Senior Living Costs: Pricing Models, Discounts & Financial Assistance

Tour Icon
Planning a tour? Check our touring checklist.
Chat Icon
Thinking of living here? We can help you speak to a current resident
Explore Open Rooms
1 Contact details
2 What type of senior care service are you looking for?
3 What budget do you have in mind for senior care?
4 How soon do you need to find care?
5 Additional details

Thank you for your interest!

Our team will be in touch shortly to help with next steps.