Care-Age Of Brookfield
Nursing Home, Assisted Living & Palliative Care · Brookfield, WI
CMS overall rating Info CMS (the Centers for Medicare & Medicaid Services) is the federal agency that rates nursing home quality. Its Overall Rating runs from 1 to 5 stars, combining health inspections, staffing, and quality measures, with inspections weighted most heavily.

Care-Age Of Brookfield

Nursing Home, Assisted Living & Palliative Care · Brookfield, WI
CMS overall rating Info CMS (the Centers for Medicare & Medicaid Services) is the federal agency that rates nursing home quality. Its Overall Rating runs from 1 to 5 stars, combining health inspections, staffing, and quality measures, with inspections weighted most heavily.
Calculator: See prices in your area
Care-Age Of Brookfield accepts Medicare, Medicaid, and private pay.

Overview of Care-Age of Brookfield

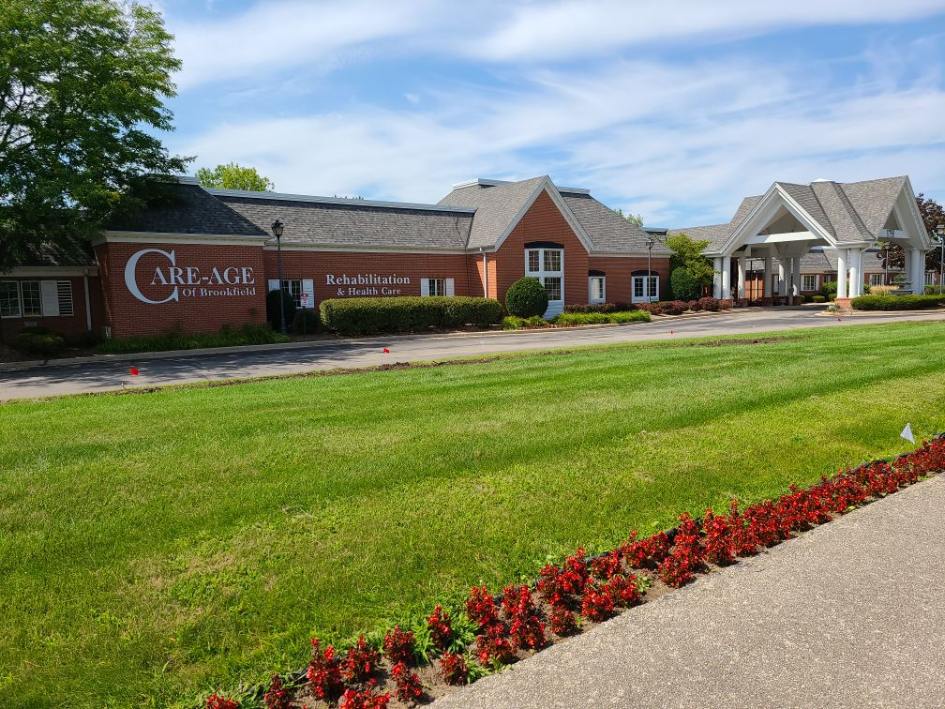
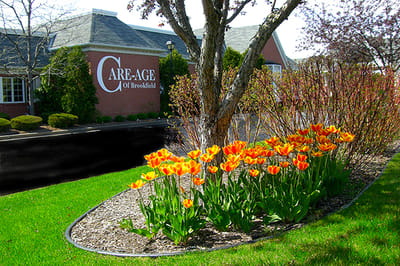
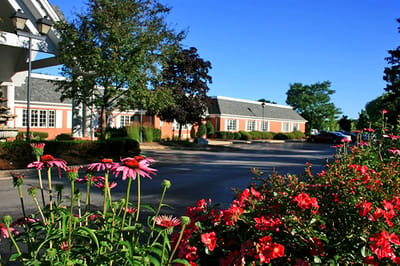
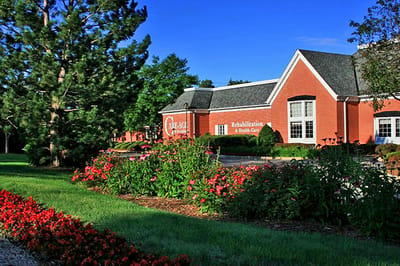
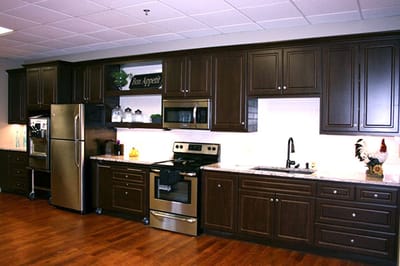
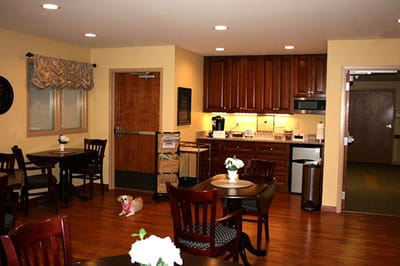
Care-Age of Brookfield is a privately-owned and operated nursing home in Brookfield, WI, offering rehabilitation, long-term care, and hospice care. Here, older adults are well-cared for, accompanied by a supportive and home-like environment. With 24-hour care, well-balanced meals, and life enrichment programs, residents receive the utmost attention and care. The community also works closely with residents to provide the best possible care based on their needs and habits.

Arts and crafts, happy hour, and baking workshops are among the many activities dedicated to enhancing residents’ memory and helping them stay active. With a cozy lounge and spacious rooms, residents can rest and move around comfortably. Situated in the peaceful residential area of Brookfield, the community ensures older adults have a stress-free retirement. As one of the trusted choices for senior living in Wisconsin, this nursing home ensures older adults live to their potential in retirement.

Quality ratings

Measured by Centers for Medicare & Medicaid Services (CMS)

Overall rating Info The Overall CMS Rating combines results from health inspections, staffing levels and quality measures. Health inspections carry the most weight. Staffing and quality scores can increase or decrease the final rating based on performance compared to state and national standards.
▼ 66.7% Below WI avg. ▼ 66.7% Below WI avg.WI average: 3.0Click the badge to see the full State ranking.Click here to see the full State ranking.
Health Inspection Info Based on the results of the facility's three most recent standard inspections and any complaint investigations. CMS reviews the number, scope, and severity of deficiencies, with more recent findings weighted more heavily.
▼ 64.3% Below WI avg. ▼ 64.3% Below WI avg.WI average: 2.8Click the badge to see the full State ranking.Click here to see the full State ranking.
Staffing Info Measures average nursing staff hours per resident per day, including Registered Nurses (RNs) and total nursing staff. Ratings are adjusted based on the level of care residents require and are compared to state and national benchmarks.
▼ 44.8% Below WI avg. ▼ 44.8% Below WI avg.WI average: 3.6Click the badge to see the full State ranking.Click here to see the full State ranking.
Quality Measures Info Based on clinical and physical health indicators reported to CMS, such as hospital readmissions, falls, pressure ulcers, and improvements in mobility. These measures reflect how well residents' health needs are being managed.
▼ 35.7% Below WI avg. ▼ 35.7% Below WI avg.WI average: 3.1Click the badge to see the full State ranking.Click here to see the full State ranking.

Staffing hours breakdown

Info Daily nursing hours per resident by staff type, reported to CMS. Higher is generally better — compare this facility to state and national averages to see where staffing stands.

Hours per resident per day — compared to Wisconsin state averages

Total nursing care / resident Info This home is ranked 84th out of 178 homes in Wisconsin for nurse hours. Total adjusted nursing hours per resident per day, combining RN, LPN, and aide time. CMS adjusts this for case-mix so facilities can be fairly compared.
4h 15m per day
Rank #84 / 178Nurse hours — State benchmarkedThis home is ranked 84th out of 178 homes in Wisconsin. Shows adjusted nurse hours per resident per day benchmarked to the Wisconsin average, with a ranking across 178 Wisconsin facilities. More hours mean more direct care. The national average is about 3.5 hrs; below 3.0 is a red flag.Rankings are based only on facilities in Wisconsin that report data for that category. Facilities without available data are excluded from the ranking.Click the rank badge to see the full State ranking.Click here to see the full State ranking.
This facility Wisconsin avg (4h 17m per day)
vs Wisconsin avg
-1%

2 of 6 metrics below state avg

Standout metric LPN / LVN is +38% above state avg
Staff typeHours / Day / Residentvs state avg
Registered Nurse (RN) Info RNs hold the highest nursing license and can assess residents, interpret test results, and direct care plans. More RN hours per day often signals stronger clinical oversight and faster response to health changes. 42m per day ▼ 28% State avg: 58m per day · National avg: 41m per day
LPN / LVN Info Licensed Practical Nurses (LPNs) or Licensed Vocational Nurses (LVNs) deliver routine hands-on care — medication administration, wound dressing, and monitoring vital signs. They work under RN supervision and make up a large share of daily bedside care. 53m per day ▲ 38% State avg: 38m per day · National avg: 52m per day
Nurse Aide Info Certified Nurse Aides (CNAs) provide the most direct day-to-day assistance: bathing, dressing, feeding, and mobility. Nurse aide hours are typically the largest staffing category and directly affect residents' quality of life. 2h 34m per day ■ Avg State avg: 2h 35m per day · National avg: 2h 21m per day
Weekend Total Nursing Info Combined nursing hours (RN + LPN + Nurse Aide) per resident per day on weekends. Staffing often drops on weekends — this figure reveals whether the facility maintains adequate coverage outside of weekday hours. 3h 42m per day ■ Avg State avg: 3h 43m per day · National avg: 3h 26m per day
Physical Therapist Info Hours per resident per day provided by licensed Physical Therapists (PTs) or PT Assistants. PT services help residents recover mobility after injury or illness and are especially important for post-acute (short-stay) rehabilitation. 4m per day ▲ 9% State avg: 4m per day · National avg: 4m per day
Weekend RN Info Registered nurse hours specifically on weekends. Facilities sometimes reduce RN presence on Saturdays and Sundays — a low weekend RN figure compared to weekday hours can indicate reduced clinical oversight when most administrative staff are absent. 21m per day ▼ 46% State avg: 39m per day · National avg: 29m per day

Capacity and availability

This home usually has availability

Lower occupancy than the Wisconsin average: 70%
Occupancy rate
58.2% Rank #338 / 434Occupancy rate — State benchmarkedThis home is ranked 338th out of 434 homes in Wisconsin. Shows this facility's occupancy rate versus the Wisconsin average, with its Statewide rank out of 434. Higher occupancy signals strong local demand and financial stability.Rankings are based only on facilities in Wisconsin that report data for that category. Facilities without available data are excluded from the ranking.Click the rank badge to see the full State ranking.Click here to see the full State ranking.
Avg. Length of Stay
52 days
Bed community size
110-bed community Rank #46 / 496Bed count — State benchmarkedThis home is ranked 46th out of 496 homes in Wisconsin. Shows this facility's certified or reported bed count compared to other Wisconsin facilities. Larger communities may offer more amenities, programs, and on-site services for residents and families.Rankings are based only on facilities in Wisconsin that report data for that category. Facilities without available data are excluded from the ranking.Click the rank badge to see the full State ranking.Click here to see the full State ranking.
A larger shared setting that may offer more common spaces and organized community services.
Walk Score
Walk Score: 9 / 100 Rank #512 / 580Walk Score — State benchmarkedThis home is ranked 512th out of 580 homes in Wisconsin. Shows how walkable this facility's neighborhood is compared to the average Walk Score across Wisconsin facilities. Higher scores benefit residents, families, and staff.Rankings are based only on facilities in Wisconsin that report data for that category. Facilities without available data are excluded from the ranking.Click the rank badge to see the full State ranking.Click here to see the full State ranking.
Car-dependent. Most errands require a car, with limited nearby walkable options.

Contact Care-Age Of Brookfield

Staffing Data

Reporting period: October 1 – December 31, 2025 (Q4 2025). Source: CMS Payroll-Based Journal report.

Total staff 374
Employees 146
Contractors 228
Staff to resident ratio 6.56 : 1
164% more staff per resident than Wisconsin average
Wisconsin average ratio: 2.48 : 1 Wisconsin average ratio: 2.48 : 1See full Wisconsin ranking
Avg staff/day 49
Average shift 7.3 hours
0% compared with Wisconsin average
Wisconsin average: 7.3 hours Wisconsin average shift: 7.3 hoursSee full Wisconsin ranking
Total staff hours (quarter) 32,784

Nursing staff breakdown

Q4 2025 · Oct 1 – Dec 31 More info This data comes from the CMS Payroll-Based Journal report covering October 1 – December 31, 2025.
Registered Nurse

Manages medical care and health needs.

RN Staff Info 8 total: 7 full-time employees and 1 contractor. 8
Average shift length Info Average shift length. Calculated as total hours divided by days worked and average staff per day. 7 hours
Licensed Practical Nurse

Assists with medical care and medications.

LPN Staff Info 61 total: 20 full-time employees and 41 contractors. 61
Average shift length Info Average shift length. Calculated as total hours divided by days worked and average staff per day. 8.1 hours
Certified Nursing Assistant

Helps with daily care and mobility.

CNA Staff Info 240 total: 81 full-time employees and 159 contractors. 240
Average shift length Info Average shift length. Calculated as total hours divided by days worked and average staff per day. 7 hours

Contractor staffing

Q4 2025 · Oct 1 – Dec 31 More info This data comes from the CMS Payroll-Based Journal report covering October 1 – December 31, 2025.

Total hours from contractors

17.1%

5,616 contractor hours this quarter

Certified Nursing Assistant: 159 Licensed Practical Nurse: 41 Speech Language Pathologist: 9 Physical Therapy Assistant: 6 Respiratory Therapy Technician: 5 Physical Therapy Aide: 4 Qualified Social Worker: 2 Clinical Nurse Specialist: 1 Registered Nurse: 1

Staff by category

Q4 2025 · Oct 1 – Dec 31 More info This data comes from the CMS Payroll-Based Journal report covering October 1 – December 31, 2025.
Certified Nursing Assistant8115924016,58392100%7
Licensed Practical Nurse2041615,66092100%8.1
Clinical Nurse Specialist101112,0606773%8
Registered Nurse7181,95792100%7
Other Dietary Services Staff5051,0958592%6.1
Dental Services Staff9098916571%7.9
Physical Therapy Assistant0667197480%6.8
Dietitian7076476672%7.5
Administrator1014966267%8
Nurse Practitioner1014926166%8.1
Mental Health Service Worker2024815560%7.9
Respiratory Therapy Technician0554706470%7.2
Speech Language Pathologist0994396874%6.4
Physical Therapy Aide0443534953%6.7
Qualified Social Worker0223476065%5.8
Occupational Therapy Aide1014867%8
Other Social Services Staff1014055%8.1
RN Director of Nursing101811%8
240 Certified Nursing Assistant
% of Days 100%
61 Licensed Practical Nurse
% of Days 100%
11 Clinical Nurse Specialist
% of Days 73%
8 Registered Nurse
% of Days 100%
5 Other Dietary Services Staff
% of Days 92%
9 Dental Services Staff
% of Days 71%
6 Physical Therapy Assistant
% of Days 80%
7 Dietitian
% of Days 72%
1 Administrator
% of Days 67%
1 Nurse Practitioner
% of Days 66%
2 Mental Health Service Worker
% of Days 60%
5 Respiratory Therapy Technician
% of Days 70%
9 Speech Language Pathologist
% of Days 74%
4 Physical Therapy Aide
% of Days 53%
2 Qualified Social Worker
% of Days 65%
1 Occupational Therapy Aide
% of Days 7%
1 Other Social Services Staff
% of Days 5%
1 RN Director of Nursing
% of Days 1%

Penalties and fines

Federal penalties imposed by CMS for regulatory violations, including civil money penalties (fines) and denials of payment for new Medicare/Medicaid admissions.

Source: CMS Penalties Database (Data as of Jan 2026)

Total fines amount $10K Rank #1 / 180Federal fines — State benchmarkedThis home is ranked 1st out of 180 homes in Wisconsin. Shows this facility's cumulative CMS federal fine dollars versus the Wisconsin average among facilities with fines, and where it ranks among 180 facilities in the pool. Lower total dollars mean a better rank.Rankings are based only on facilities in Wisconsin that report data for that category. Facilities without available data are excluded from the ranking.Click the rank badge to see the full State ranking.Click here to see the full State ranking.
90% lower than Wisconsin average

Wisconsin average: $95K

Number of fines 1
52% fewer fines than Wisconsin average

Wisconsin average: 2.1

Payment Denials Info Serious action where Medicare and/or Medicaid temporarily stops payments for new residents until issues are fixed. 0
100% fewer payment denials than Wisconsin average

Wisconsin average: 0.7

Fines amount comparison
This facility $10K
Wisconsin average $95K

No penalties in the past 3 years

No civil money penalties or payment denials were reported in the last 3 years.

Quality of care over time

These measures show how residents usually do over time at this home, based on health outcomes and preventive care.

High-risk clinical events score Info A composite score based on pressure ulcers, falls with injury, weight loss, walking ability decline, and activities of daily living decline. 16.0
52% worse than Wisconsin average

Wisconsin average: 10.5

Functional decline score Info A composite score based on activities of daily living decline, walking ability decline, and incontinence. 33.2
50% worse than Wisconsin average

Wisconsin average: 22.1

Long-stay resident measures
Below average Info CMS star rating based on long-stay quality measure performance. 5 stars = significantly above average, 1 star = significantly below average.
Need for Help with Daily Activities Increased Info Percent of long-stay residents whose need for help with daily activities has increased 25.4%
44% worse than Wisconsin average

Wisconsin average: 17.6%

Walking Ability Worsened Info Percent of long-stay residents whose ability to move independently worsened 35.3%
55% worse than Wisconsin average

Wisconsin average: 22.8%

Low Risk Residents with Bowel/Bladder Incontinence Info Percent of low risk long-stay residents who lose control of their bowels or bladder 38.8%
49% worse than Wisconsin average

Wisconsin average: 26.0%

Falls with Major Injury Info Percent of long-stay residents experiencing one or more falls with major injury 3.8%
19% worse than Wisconsin average

Wisconsin average: 3.2%

High Risk Residents with Pressure Ulcers Info Percent of long-stay high risk residents with pressure ulcers 9.2%
68% worse than Wisconsin average

Wisconsin average: 5.4%

Urinary Tract Infection Info Percent of long-stay residents with a urinary tract infection 4.4%
37% worse than Wisconsin average

Wisconsin average: 3.2%

Lost Too Much Weight Info Percent of long-stay residents who lose too much weight 6.1%
25% worse than Wisconsin average

Wisconsin average: 4.9%

Depressive Symptoms Info Percent of long-stay residents who have depressive symptoms 0.0%
100% better than Wisconsin average

Wisconsin average: 5.0%

Antipsychotic Use Info Percent of long-stay residents who received an antipsychotic medication 15.7%
In line with Wisconsin average

Wisconsin average: 16.1%

Pneumococcal Vaccine Info Percent of long-stay residents assessed and appropriately given the pneumococcal vaccine 100.0%
In line with Wisconsin average

Wisconsin average: 95.9%

Influenza Vaccine Info Percent of long-stay residents assessed and appropriately given the seasonal influenza vaccine 100.0%
5% better than Wisconsin average

Wisconsin average: 95.0%

Hospitalizations per 1,000 days Info Number of hospitalizations per 1,000 long-stay resident days. 2.60
61% worse than Wisconsin average

Wisconsin average: 1.61

ED visits per 1,000 days Info Number of outpatient emergency department visits per 1,000 long-stay resident days. 1.66
24% better than Wisconsin average

Wisconsin average: 2.19

Short-stay resident measures
Average Info CMS star rating based on short-stay quality measure performance. 5 stars = much above average, 1 star = much below average.
Pneumococcal Vaccine Info Percent of short-stay residents assessed and appropriately given the pneumococcal vaccine 91.5%
5% better than Wisconsin average

Wisconsin average: 87.3%

Antipsychotic medication increase Info Percent of short-stay residents who newly received an antipsychotic medication 1.5%
22% worse than Wisconsin average

Wisconsin average: 1.2%

Influenza Vaccine Info Percent of short-stay residents assessed and appropriately given the seasonal influenza vaccine 86.6%
5% better than Wisconsin average

Wisconsin average: 82.2%

Re-hospitalized after SNF stay Info Percentage of short-stay residents who were re-hospitalized after their nursing home admission. 29.9%
32% worse than Wisconsin average

Wisconsin average: 22.7%

Emergency department visits Info Percentage of short-stay residents who had an outpatient emergency department visit. 3.3%
78% better than Wisconsin average

Wisconsin average: 15.0%

Falls with major injury Info Percentage of SNF residents who experience falls with major injury during their stay. 0.0%
100% better than Wisconsin average

Wisconsin average: 0.8%

Ability to care for self at discharge Info Percentage of residents at or above expected ability to care for themselves at discharge. 33.7%
37% worse than Wisconsin average

Wisconsin average: 53.7%

Successful return to home or community Info Rate of successful return to home or community from a skilled nursing facility. 47.2%
7% worse than Wisconsin average

Wisconsin average: 50.6%

Breakdown by payment type

Medicare

33% of new residents, usually for short-term rehab.

Typical stay 19 days

Private pay

62% of new residents, often for short stays.

Typical stay 1 - 2 months

Medicaid

5% of new residents, often for long-term daily care.

Typical stay 10 - 11 months

Facility Characteristics

Source: CMS Long-Term Care Facility Characteristics (Data as of Jan 2026)

Total residents 57
Medicare
8
14% of residents
Medicaid
22
38.6% of residents
Private pay or other
27
47.4% of residents
Programs & Services
Residents Group

Residents meet regularly to discuss policies, care quality, and activities

Active Resident Council

Organized group of residents that meets regularly to discuss facility policies, quality of life, and activities.

Finances and operations

Based on CMS SNF Cost Report for fiscal year ending in 12/2023.

For-profit
Corporation
Net patient revenue Info Net patient revenue — what the home actually collects for resident care, after contractual allowances, bad debt and discounts are subtracted from its gross charges (CMS cost report, Worksheet G-3). It covers resident care only; money the home earns from other sources is shown separately as "Other income."
$9.6M
Net patient income Info Net patient income: net patient revenue minus the home's total operating expenses. A positive figure means it earns more from resident care than it spends to deliver it; a negative figure means the opposite. It excludes non-operating "other income."
$284.8K
For-profit Corporation
Net patient revenue Info Net patient revenue — what the home actually collects for resident care, after contractual allowances, bad debt and discounts are subtracted from its gross charges (CMS cost report, Worksheet G-3). It covers resident care only; money the home earns from other sources is shown separately as "Other income."
$9.6M Rank #80 / 183Revenue — State benchmarkedThis home is ranked 80th out of 183 homes in Wisconsin. Shows this facility's annual revenue compared to the Wisconsin average. Higher revenue generally means more resources for staffing and capital — read alongside Payroll %.Rankings are based only on facilities in Wisconsin that report data for that category. Facilities without available data are excluded from the ranking.Click the rank badge to see the full State ranking.Click here to see the full State ranking.
Net patient income Info Net patient income: net patient revenue minus the home's total operating expenses. A positive figure means it earns more from resident care than it spends to deliver it; a negative figure means the opposite. It excludes non-operating "other income."
$284.8K
Other income Info Money the home earns outside of resident care — such as investments, grants, rentals and other non-operating sources (CMS cost report, Worksheet G-3). It is tracked separately from net patient revenue: it is not part of that figure, and it is not included in net patient income.
$19.0K
Payroll costs Info Staff salaries plus wage-related costs — benefits such as payroll taxes, health insurance and retirement — from the home's own accounting records (CMS cost report, Worksheet A). Contract or agency labor is counted separately, under other operating costs. Rank #45 / 183Payroll — State benchmarkedThis home is ranked 45th out of 183 homes in Wisconsin. Shows total annual staff payroll benchmarked to the Wisconsin average. Higher payroll investment relative to peers often signals better staffing and less reliance on cheaper contract labor.Rankings are based only on facilities in Wisconsin that report data for that category. Facilities without available data are excluded from the ranking.Click the rank badge to see the full State ranking.Click here to see the full State ranking.
$6.5M 67.5% of net patient revenue Info Payroll as a share of revenue: staff salaries and wage-related benefits divided by net patient revenue. A higher figure means more of each revenue dollar goes to staff pay. Rank #26 / 183Payroll % — State benchmarkedThis home is ranked 26th out of 183 homes in Wisconsin. Shows payroll as a percentage of revenue versus the Wisconsin average. Well-run Wisconsin facilities typically land around 62–74% — the top third Statewide. Below 25% may signal understaffing or heavy agency use — read with Staffing ratings.Rankings are based only on facilities in Wisconsin that report data for that category. Facilities without available data are excluded from the ranking.Click the rank badge to see the full State ranking.Click here to see the full State ranking.
Other operating costs Info Everything it costs to run the home apart from payroll — food, utilities, supplies, maintenance, contract labor and administration. Calculated as total operating expense minus payroll (staff salaries and wage-related benefits).
$2.8M
Total costs Info The home's total operating expense for the year — all the costs of running it, salaries included (CMS cost report, Worksheet G-3).
$9.3M

What does this home offer?

Housing options icon

Housing Options: Private Rooms

Building type icon
Building type icon

Building Type: Single-story

Beauty services icon

Beauty Services

Exercise program icon

Exercise Programs

Housekeeping icon
Housekeeping icon

Housekeeping Services

Recreational activities icon

Recreational Activities

Music and Arts Classes icon

Music and Arts Classes

Social and recreational activities icon

Social and Recreational Activities

Meal Preparation icon

Meal Preparation

Who this home usually serves

TYPE OF STAY

Primarily short stays

Residents typically stay for brief periods, with frequent admissions and discharges throughout the year.

Most new residents arrive under private pay (62% of admissions), and a typical private pay stay runs around 1 - 2 months.

Admissions
485 total

Coverage residents most often arrive under.

Medicare 33%
Private pay 62%
Medicaid 5%
Discharges
446 total

Coverage residents most often leave under.

Medicare 25%
Private pay 69%
Medicaid 6%

Places of interest near Care-Age Of Brookfield

Address 2.6 miles from city center Info Estimated distance in miles from Brookfield's city center to Care-Age Of Brookfield's address, calculated via Google Maps.

Calculate Travel Distance to Care-Age Of Brookfield

Add your location

Address

Compare Nursing Homes around Brookfield

The information below is reported by the Wisconsin Department of Health Services, Division of Quality Assurance.

Care-Age Of Brookfield
NH
AL
PC
Brookfield -
110
Facility 110
WI AVG 61
Rank #46 / 496
-
9
Facility 9
WI AVG 42
Rank #512 / 580
Private Rooms
Congregational Home
NH
AL
HC
IL
MC
Brookfield (Grantosa) $8,467 - $8,467
21
Facility 21
WI AVG 61
Rank #448 / 496
-
20
Facility 20
WI AVG 42
Rank #447 / 580
Private Rooms
Aria of Brookfield
NH
Brookfield (Barrington Woods) -
170
Facility 170
WI AVG 61
Rank #8 / 496
-
10
Facility 10
WI AVG 42
Rank #499 / 580
-

Financial Assistance for
Nursing Home in Wisconsin

Care-Age Of Brookfield is located in Brookfield, Wisconsin.
Here are the financial assistance programs available to residents in Wisconsin.

Get Financial aid guidance

Family Care Program

WI Medicaid Family Care

Age 65+ or disabled
General Wisconsin resident, Medicaid-eligible, long-term care need.
Income Limits (2025) ~$2,829/month 300% FBR, individual
Asset Limits $2,000 (individual), $3,000 (couple).
WI

Managed care model; rural/urban balance.

Benefits
Personal care (5-7 hours/day) Respite (240 hours/year) Adult day care ($65/day) Home modifications ($1,500 avg.)

Wisconsin Caregiver Support Program

WI NFCSP Respite

Age Caregiver of someone 60+ (or with dementia)
General Wisconsin resident.
Income Limits No strict limit; prioritizes low-income.
Asset Limits Not applicable.
WI

High rural demand; ADRC coordination.

Benefits
In-home respite (4-6 hours/day) Adult day care (~$65/day) Short-term facility care (up to 5 days)

IRIS (Include, Respect, I Self-Direct)

Wisconsin IRIS

Age 65+ (or disabled 18+)
General WI resident, Medicaid-eligible, NFLOC.
Income Limits (2025) ~$2,829/month; QIT optional.
Asset Limits $2,000 (individual), $3,000 (couple).
WI

Flexible budget; serves ~20,000; participant hires caregivers.

Benefits
Personal care (custom hours) Respite Home mods Equipment Transportation Support services

SeniorCare Prescription Drug Assistance

Wisconsin SeniorCare

Age 65+
General WI resident, US citizen/qualified immigrant, not on full Medicaid.
Income Limits (2025) ~$24,980-$34,980/year (Level 1-2B, individual); varies by level.
Asset Limits None.
WI

Four benefit levels; serves ~50,000 annually.

Benefits
$5 generic/$15 brand copays (Level 1); deductibles ($500-$850) for higher levels; covers most Rx drugs

Medicare Savings Program (MSP)

Wisconsin Medicare Savings Program

Age 65+ or disabled
General WI resident, Medicare Part A/B.
Income Limits (2025) ~$2,510/month (QMB), ~$3,380/month (SLMB), ~$3,598/month (QI)—individual.
Asset Limits $9,430 (individual), $14,130 (couple).
WI

Includes Extra Help for Part D; no waitlist.

Benefits
Covers Part B premiums ($174.70/month) Deductibles ($240/year) Copays (~20%)

Wisconsin Home Energy Assistance Program (WHEAP)

Wisconsin WHEAP

Age 60+ prioritized
General WI resident, low-income household.
Income Limits (2025) ~$3,970/month 185% FPL
Asset Limits Not assessed.
WI

Covers gas, electric, wood; crisis aid available.

Benefits
Heating/electric aid ($300-$1,000/season) Crisis aid ($500 max) Weatherization

VA Aid and Attendance (A&A) and Housebound Benefits

Wisconsin VA Aid and Attendance/Housebound

Age 65+ or disabled veteran/spouse
General WI resident, wartime service, ADL help (A&A) or homebound.
Income Limits (2025) Net income < ~$1,984/month (veteran with dependent, A&A); pension offsets income.
Asset Limits ~$155,356 net worth
WI

High rural veteran use; supports care costs.

Benefits
Cash (~$1,433-$2,642/month veteran, ~$951-$1,318 spouse) for care costs

Property Tax Deferral Loan Program

Wisconsin Property Tax Deferral Loan

Age 65+
General WI resident, homeowner, live in home 6+ months/year.
Income Limits (2025) ~$24,980/year household
Asset Limits Home equity < $500,000; limited other assets.
WI

Saves ~$500-$1,500/year; interest ~2%-3%.

Benefits
Deferred tax payment (~$500-$1,500/year avg.)

Senior Farmers’ Market Nutrition Program (SFMNP)

Wisconsin SFMNP

Age 60+
General WI resident, low-income.
Income Limits (2025) ~$2,322/month 185% FPL
Asset Limits Not assessed.
WI

Vouchers (~$45/season); serves ~15,000 annually.

Benefits
Vouchers (~$45/season) for produce at farmers’ markets

Frequently Asked Questions about Care-Age Of Brookfield

Is Care-Age Of Brookfield in a walkable area?

Care-Age Of Brookfield has a walk score of 9. Car-dependent. Most errands require a car, with limited nearby walkable options.

What is the occupancy rate at Care-Age Of Brookfield?

Care-Age Of Brookfield's occupancy is 58.2%.

Does Care-Age Of Brookfield operate as a for-profit or non-profit?

Care-Age Of Brookfield is registered as a for-profit.

Are there photos of Care-Age Of Brookfield?

Yes — there are 7 photos of Care-Age Of Brookfield in the photo gallery on this page.

What is the address of Care-Age Of Brookfield?

Care-Age Of Brookfield is located at 1755 N Barker Rd, Brookfield, WI 53045.

What is the phone number of Care-Age Of Brookfield?

(262) 821-3939 will put you in contact with the team at Care-Age Of Brookfield.

Is Care-Age Of Brookfield Medicare or Medicaid certified?

Yes — Care-Age Of Brookfield is a CMS-certified provider of Medicare and Medicaid.

Guides for Better Senior Living

Care Cost Calculator: See Prices in Your Area

Nursing Home Data Explorer

Don’t Wait Too Long: 7 Red Flag Signs Your Parent Needs Assisted Living Now

The True Cost of Assisted Living in 2025 – And How Families Are Paying For It

Understanding Senior Living Costs: Pricing Models, Discounts & Financial Assistance