The Leonard Florence Center
Nursing Home & Care Home · Middlesex County, MA
CMS overall rating Info The Overall CMS Rating is scored from 1 to 5 stars and combines results from health inspections, staffing levels, and quality measures. Health inspections carry the most weight. Staffing and quality scores can increase or decrease the final rating based on performance compared to state and national standards.

The Leonard Florence Center

Nursing Home & Care Home · Middlesex County, MA
CMS overall rating Info The Overall CMS Rating is scored from 1 to 5 stars and combines results from health inspections, staffing levels, and quality measures. Health inspections carry the most weight. Staffing and quality scores can increase or decrease the final rating based on performance compared to state and national standards.
Calculator: See prices in your area
The Leonard Florence Center accepts Medicare, Medicaid, and private pay.

Overview of The Leonard Florence Center

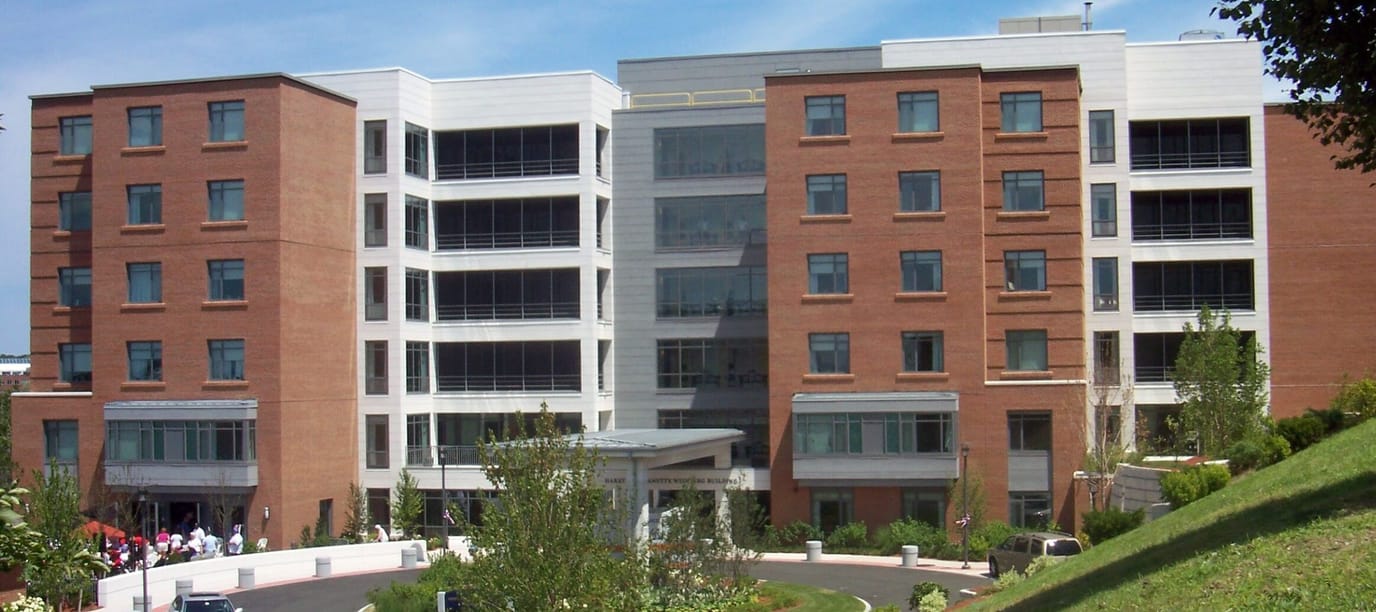
Enjoy a combination of comfort and quality care with The Leonard Florence Center, a compassionate community in Chelsea, MA, offering excellent short-term rehabilitation and long-term care. They cater to an intimate number of residents to guarantee focused and personalized care. In addition to daily living assistance and nursing care, residents here have access to regular in-house physician and nurse visits for added comfort and care. Therapy services and treatment plans are tailor-made to match residents’ unique needs and requirements to ensure they effectively improve their conditions.

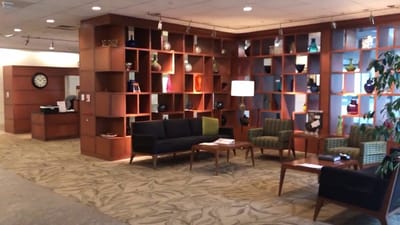
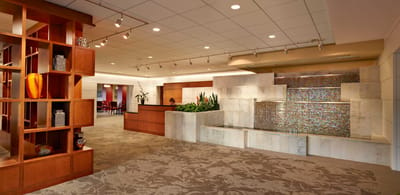
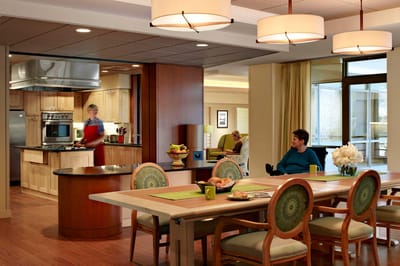
Residents also enjoy the comfort of having cozy and spacious accommodations with private baths for their convenience. To ensure residents maintain healthy diets and proper nutrition, they consistently serve them delicious and well-balanced meals tailored to their dietary needs and preferences. Amenities like a salon, library, cafe, spa, and outdoor patios are also available to enhance residents’ comforts and living conditions. At The Leonard Florence Center, residents are well-equipped to thrive against their conditions in a warm and nurturing environment.

(617) 887-0001

Quality ratings

Measured by Centers for Medicare & Medicaid Services (CMS)

Overall rating Info The Overall CMS Rating combines results from health inspections, staffing levels and quality measures. Health inspections carry the most weight. Staffing and quality scores can increase or decrease the final rating based on performance compared to state and national standards.
▲ 72.4% Above MA avg. ▲ 72.4% Above MA avg.Click the badge to see the full State ranking.Click here to see the full State ranking.
Health Inspection Info Based on the results of the facility's three most recent standard inspections and any complaint investigations. CMS reviews the number, scope, and severity of deficiencies, with more recent findings weighted more heavily.
▲ 75.7% Above MA avg. ▲ 75.7% Above MA avg.Click the badge to see the full State ranking.Click here to see the full State ranking.
Staffing Info Measures average nursing staff hours per resident per day, including Registered Nurses (RNs) and total nursing staff. Ratings are adjusted based on the level of care residents require and are compared to state and national benchmarks.
▲ 66.7% Above MA avg. ▲ 66.7% Above MA avg.Click the badge to see the full State ranking.Click here to see the full State ranking.
Quality Measures Info Based on clinical and physical health indicators reported to CMS, such as hospital readmissions, falls, pressure ulcers, and improvements in mobility. These measures reflect how well residents' health needs are being managed.
▲ 25.8% Above MA avg. ▲ 25.8% Above MA avg.Click the badge to see the full State ranking.Click here to see the full State ranking.

Staffing hours breakdown

Info Daily nursing hours per resident by staff type, reported to CMS. Higher is generally better — compare this facility to state and national averages to see where staffing stands.

Hours per resident per day — compared to Massachusetts state averages

Total nursing care / resident Info This home is ranked 10th out of 89 homes in Massachusetts. Total adjusted nursing hours per resident per day, combining RN, LPN, and aide time. CMS adjusts this for case-mix so facilities can be fairly compared.
4h 46m per day
Rank #10 / 89Nurse hours — State benchmarkedThis home is ranked 10th out of 89 homes in Massachusetts. Shows adjusted nurse hours per resident per day benchmarked to the Massachusetts average, with a ranking across 89 Massachusetts SNFs. More hours mean more direct care. The national average is about 3.5 hrs; below 3.0 is a red flag.Click the rank badge to see the full State ranking.Click here to see the full State ranking.
This facility Massachusetts avg (3h 56m per day)
vs Massachusetts avg
+21%

0 of 6 metrics below state avg

Standout metric Physical Therapist is +150% above state avg
Staff typeHours / Day / Residentvs state avg
Registered Nurse (RN) Info RNs hold the highest nursing license and can assess residents, interpret test results, and direct care plans. More RN hours per day often signals stronger clinical oversight and faster response to health changes. 1h 26m per day ▲ 121% State avg: 39m per day · National avg: 41m per day
LPN / LVN Info Licensed Practical Nurses (LPNs) or Licensed Vocational Nurses (LVNs) deliver routine hands-on care — medication administration, wound dressing, and monitoring vital signs. They work under RN supervision and make up a large share of daily bedside care. 57m per day ■ Avg State avg: 58m per day · National avg: 52m per day
Nurse Aide Info Certified Nurse Aides (CNAs) provide the most direct day-to-day assistance: bathing, dressing, feeding, and mobility. Nurse aide hours are typically the largest staffing category and directly affect residents' quality of life. 5h 14m per day ▲ 131% State avg: 2h 16m per day · National avg: 2h 21m per day
Weekend Total Nursing Info Combined nursing hours (RN + LPN + Nurse Aide) per resident per day on weekends. Staffing often drops on weekends — this figure reveals whether the facility maintains adequate coverage outside of weekday hours. 7h 17m per day ▲ 111% State avg: 3h 27m per day · National avg: 3h 26m per day
Physical Therapist Info Hours per resident per day provided by licensed Physical Therapists (PTs) or PT Assistants. PT services help residents recover mobility after injury or illness and are especially important for post-acute (short-stay) rehabilitation. 10m per day ▲ 150% State avg: 4m per day · National avg: 4m per day
Weekend RN Info Registered nurse hours specifically on weekends. Facilities sometimes reduce RN presence on Saturdays and Sundays — a low weekend RN figure compared to weekday hours can indicate reduced clinical oversight when most administrative staff are absent. 1h 7m per day ▲ 139% State avg: 28m per day · National avg: 29m per day

Types of Care at The Leonard Florence Center

Care Home

Capacity and availability

This home is often near full

Occupancy higher than 95% suggests steady demand, but availability may be limited.

Higher occupancy than the Massachusetts average: 82%
Occupancy rate 96.7% Rank #4 / 92Occupancy rate — State benchmarkedThis home is ranked 4th out of 92 homes in Massachusetts. Shows this facility's occupancy rate versus the Massachusetts average, with its Statewide rank out of 92. Higher occupancy signals strong local demand and financial stability.Click the rank badge to see the full State ranking.Click here to see the full State ranking.
Avg. Length of Stay 98 days
Occupancy rate
96.7% Rank #4 / 92Occupancy rate — State benchmarkedThis home is ranked 4th out of 92 homes in Massachusetts. Shows this facility's occupancy rate versus the Massachusetts average, with its Statewide rank out of 92. Higher occupancy signals strong local demand and financial stability.Click the rank badge to see the full State ranking.Click here to see the full State ranking.
Avg. Length of Stay
98 days
Walk Score
Walk Score: 88 / 100 Rank #63 / 499Walk Score — State benchmarkedThis home is ranked 63rd out of 499 homes in Massachusetts. Shows how walkable this facility's neighborhood is compared to the average Walk Score across Massachusetts SNFs. Higher scores benefit residents, families, and staff.Click the rank badge to see the full State ranking.Click here to see the full State ranking.
Very walkable. Most errands can be accomplished on foot, and many essentials are within a short walk.

Contact The Leonard Florence Center

Staffing Data

Reporting period: October 1 – December 31, 2025 (Q4 2025). Source: CMS Payroll-Based Journal report.

Total staff 218
Employees 216
Contractors 2
Staff to resident ratio 2.22:1
34% better than Massachusetts average
Massachusetts average ratio: 1.66:1 Massachusetts average ratio: 1.66:1See full Massachusetts ranking
Avg staff/day 101
Average shift 8.6 hours
9% better than Massachusetts average
Massachusetts average: 7.9 hours Massachusetts average shift: 7.9 hoursSee full Massachusetts ranking
Total staff hours (quarter) 79,785

Nursing staff breakdown

Q4 2025 · Oct 1 – Dec 31 More info This data comes from the CMS Payroll-Based Journal report covering October 1 – December 31, 2025.
Registered Nurse

Manages medical care and health needs.

RN Staff 28
Average shift length Info Average shift length. Calculated as total hours divided by days worked and average staff per day. 8.7 hours

No contractors work on this role.

Licensed Practical Nurse

Assists with medical care and medications.

LPN Staff 21
Average shift length Info Average shift length. Calculated as total hours divided by days worked and average staff per day. 8.2 hours

No contractors work on this role.

Certified Nursing Assistant

Helps with daily care and mobility.

CNA Staff 108
Average shift length Info Average shift length. Calculated as total hours divided by days worked and average staff per day. 8.7 hours

No contractors work on this role.

Contractor staffing

Q4 2025 · Oct 1 – Dec 31 More info This data comes from the CMS Payroll-Based Journal report covering October 1 – December 31, 2025.

Total hours from contractors

0.1%

74 contractor hours this quarter

Occupational Therapy Assistant: 1 Medical Director: 1

Staff by category

Q4 2025 · Oct 1 – Dec 31 More info This data comes from the CMS Payroll-Based Journal report covering October 1 – December 31, 2025.
Certified Nursing Assistant108010845,22092100%8.7
Registered Nurse280289,68892100%8.7
Licensed Practical Nurse210217,73892100%8.2
Qualified Activities Professional220227,15892100%9.3
Clinical Nurse Specialist5052,4736773%8.6
Respiratory Therapy Technician100101,4848491%7.1
RN Director of Nursing3031,2388997%9.5
Other Dietary Services Staff4041,2076773%7.6
Dental Services Staff2027927177%8
Qualified Social Worker2025706470%6.3
Administrator1014966267%8
Nurse Practitioner1014886166%8
Physical Therapy Aide2024065863%7
Occupational Therapy Aide2023544246%8.4
Physical Therapy Assistant3032344852%4.7
Mental Health Service Worker1011521921%8
Occupational Therapy Assistant0114267%7
Medical Director01132910%3.6
Speech Language Pathologist1011222%5.8
108 Certified Nursing Assistant
% of Days 100%
28 Registered Nurse
% of Days 100%
21 Licensed Practical Nurse
% of Days 100%
22 Qualified Activities Professional
% of Days 100%
5 Clinical Nurse Specialist
% of Days 73%
10 Respiratory Therapy Technician
% of Days 91%
3 RN Director of Nursing
% of Days 97%
4 Other Dietary Services Staff
% of Days 73%
2 Dental Services Staff
% of Days 77%
2 Qualified Social Worker
% of Days 70%
1 Administrator
% of Days 67%
1 Nurse Practitioner
% of Days 66%
2 Physical Therapy Aide
% of Days 63%
2 Occupational Therapy Aide
% of Days 46%
3 Physical Therapy Assistant
% of Days 52%
1 Mental Health Service Worker
% of Days 21%
1 Occupational Therapy Assistant
% of Days 7%
1 Medical Director
% of Days 10%
1 Speech Language Pathologist
% of Days 2%

Penalties and fines

Federal penalties imposed by CMS for regulatory violations, including civil money penalties (fines) and denials of payment for new Medicare/Medicaid admissions.

Source: CMS Penalties Database

No penalties in the past 3 years

No civil money penalties or payment denials were reported in the last 3 years.

Quality of care over time

These measures show how residents usually do over time at this home, based on health outcomes and preventive care.

High-risk clinical events score Info A composite score based on pressure ulcers, falls with injury, weight loss, walking ability decline, and activities of daily living decline. 10.5
In line with Massachusetts average

Massachusetts average: 10.2

Functional decline score Info A composite score based on activities of daily living decline, walking ability decline, and incontinence. 14.4
28% better than Massachusetts average

Massachusetts average: 20.0

Long-stay resident measures
Above average Massachusetts avg: 3.6 Info CMS star rating based on long-stay quality measure performance. 5 stars = significantly above average, 1 star = significantly below average.
Need for Help with Daily Activities Increased Info Percent of long-stay residents whose need for help with daily activities has increased 12.8%
31% better than Massachusetts average

Massachusetts average: 18.7%

Walking Ability Worsened Info Percent of long-stay residents whose ability to move independently worsened 23.8%
23% worse than Massachusetts average

Massachusetts average: 19.3%

Low Risk Residents with Bowel/Bladder Incontinence Info Percent of low risk long-stay residents who lose control of their bowels or bladder 6.5%
70% better than Massachusetts average

Massachusetts average: 22.1%

Falls with Major Injury Info Percent of long-stay residents experiencing one or more falls with major injury 3.6%
In line with Massachusetts average

Massachusetts average: 3.6%

High Risk Residents with Pressure Ulcers Info Percent of long-stay high risk residents with pressure ulcers 10.0%
115% worse than Massachusetts average

Massachusetts average: 4.7%

Urinary Tract Infection Info Percent of long-stay residents with a urinary tract infection 0.3%
84% better than Massachusetts average

Massachusetts average: 2.1%

Lost Too Much Weight Info Percent of long-stay residents who lose too much weight 2.1%
59% better than Massachusetts average

Massachusetts average: 5.2%

Depressive Symptoms Info Percent of long-stay residents who have depressive symptoms 36.8%
244% worse than Massachusetts average

Massachusetts average: 10.7%

Antipsychotic Use Info Percent of long-stay residents who received an antipsychotic medication 15.7%
23% better than Massachusetts average

Massachusetts average: 20.3%

Pneumococcal Vaccine Info Percent of long-stay residents assessed and appropriately given the pneumococcal vaccine 91.6%
In line with Massachusetts average

Massachusetts average: 91.9%

Influenza Vaccine Info Percent of long-stay residents assessed and appropriately given the seasonal influenza vaccine 100.0%
5% better than Massachusetts average

Massachusetts average: 94.8%

Hospitalizations per 1,000 days Info Number of hospitalizations per 1,000 long-stay resident days. 2.59
39% worse than Massachusetts average

Massachusetts average: 1.86

ED visits per 1,000 days Info Number of outpatient emergency department visits per 1,000 long-stay resident days. 0.76
51% better than Massachusetts average

Massachusetts average: 1.54

Short-stay resident measures
Above average Massachusetts avg: 3.2 Info CMS star rating based on short-stay quality measure performance. 5 stars = much above average, 1 star = much below average.
Pneumococcal Vaccine Info Percent of short-stay residents assessed and appropriately given the pneumococcal vaccine 98.0%
28% better than Massachusetts average

Massachusetts average: 76.7%

Antipsychotic medication increase Info Percent of short-stay residents who newly received an antipsychotic medication 0.4%
72% better than Massachusetts average

Massachusetts average: 1.3%

Influenza Vaccine Info Percent of short-stay residents assessed and appropriately given the seasonal influenza vaccine 87.0%
12% better than Massachusetts average

Massachusetts average: 77.7%

Re-hospitalized after SNF stay Info Percentage of short-stay residents who were re-hospitalized after their nursing home admission. 27.0%
5% worse than Massachusetts average

Massachusetts average: 25.8%

Emergency department visits Info Percentage of short-stay residents who had an outpatient emergency department visit. 8.7%
26% better than Massachusetts average

Massachusetts average: 11.8%

Falls with major injury Info Percentage of SNF residents who experience falls with major injury during their stay. 0.3%
66% better than Massachusetts average

Massachusetts average: 0.8%

Ability to care for self at discharge Info Percentage of residents at or above expected ability to care for themselves at discharge. 42.1%
22% worse than Massachusetts average

Massachusetts average: 53.7%

Successful return to home or community Info Rate of successful return to home or community from a skilled nursing facility. 67.8%
34% better than Massachusetts average

Massachusetts average: 50.6%

Breakdown by payment type

Medicare

93% of new residents, usually for short-term rehab.

Typical stay 19 days

Private pay

6% of new residents, often for short stays.

Typical stay 10 months

Medicaid

1% of new residents, often for long-term daily care.

Typical stay 17 - 18 years

Facility Characteristics

Source: CMS Long-Term Care Facility Characteristics (Data as of Jan 2026)

Total residents 98
Medicare
20
20.4% of residents
Medicaid
60
61.2% of residents
Private pay or other
18
18.4% of residents
Programs & Services
Residents Group

Residents meet regularly to discuss policies, care quality, and activities

Nurse Aide Training

State-approved Nurse Aide Training and Competency Evaluation Program on-site

Active Resident Council

Organized group of residents that meets regularly to discuss facility policies, quality of life, and activities.

Finances and operations

Voluntary non-profit community
Home revenue
$26.1M
Surplus of revenue
$2.1M
Voluntary non-profit community
Home revenue
$26.1M Rank #26 / 92Revenue — State benchmarkedThis home is ranked 26th out of 92 homes in Massachusetts. Shows this facility's annual revenue compared to the Massachusetts SNF average. Higher revenue generally means more resources for staffing and capital — read alongside Payroll %.Click the rank badge to see the full State ranking.Click here to see the full State ranking.
Surplus of revenue
$2.1M
Payroll costs Info The portion of the home's budget spent on staff, including nurses, caregivers, and other employees who support care and operations. Rank #16 / 92Payroll — State benchmarkedThis home is ranked 16th out of 92 homes in Massachusetts. Shows total annual staff payroll benchmarked to the Massachusetts average. Higher payroll investment relative to peers often signals better staffing and less reliance on cheaper contract labor.Click the rank badge to see the full State ranking.Click here to see the full State ranking.
$14.3M
54.8% of revenue Rank #27 / 92Payroll % — State benchmarkedThis home is ranked 27th out of 92 homes in Massachusetts. Shows payroll as a percentage of revenue versus the Massachusetts average. Well-run Massachusetts SNFs typically land around 54–65% — the top third Statewide. Below 25% may signal understaffing or heavy agency use — read with Staffing ratings.Click the rank badge to see the full State ranking.Click here to see the full State ranking.
Other operating costs Info All remaining costs needed to run the home, such as food, utilities, building maintenance, supplies and administrative expenses.
$9.4M
Total costs $23.7M

What does this home offer?

Housing options icon

Housing Options: Private Rooms

Building type icon
Building type icon

Building Type: Mid-rise

Dining services icon

Dining Services

Beauty services icon

Beauty Services

Recreational activities icon

Recreational Activities

Exercise program icon

Exercise Programs

Who this home usually serves

TYPE OF STAY

Mostly short-term rehab stays

Most residents typically stay for a few weeks or months before returning home or moving on.

Places of interest near The Leonard Florence Center

Address 1.3 miles from city center Info Estimated distance in miles from Chelsea's city center to The Leonard Florence Center's address, calculated via Google Maps.

Calculate Travel Distance to The Leonard Florence Center

Add your location

Address

Financial Assistance for
Nursing Home in Massachusetts

The Leonard Florence Center is located in Chelsea, Massachusetts.
Here are the financial assistance programs available to residents in Massachusetts.

Get Financial aid guidance

Home Care Program

MassHealth Home Care

Age 60+
General Massachusetts resident, at risk of nursing home placement.
Income Limits (2025) ~$1,500/month individual, varies by region
Asset Limits $2,000 individual, excludes home, car
MA

Coordinated through Aging Services Access Points (ASAPs); high demand in urban areas.

Benefits
In-home care (3-5 hours/day) Homemaker services Respite care (up to 14 days/year) Adult day care (~$75/day)

Frail Elder Waiver

Massachusetts Medicaid FE Waiver

Age 65+
General Massachusetts resident, Medicaid-eligible, nursing home-level care need.
Income Limits (2025) ~$2,829/month 300% FBR, individual
Asset Limits $2,000 (individual), $3,000 (couple).
MA

Requires clinical eligibility determination.

Benefits
Personal care (5-7 hours/day) Respite care (240 hours/year) Adult day care (~$75/day) Home health services

Senior Care Options (SCO)

Massachusetts Senior Care Options

Age 65+
General Massachusetts resident, eligible for MassHealth (Medicare optional), nursing home-level care need.
Income Limits (2025) ~$2,829/month (300% FBR, individual); QIT allowed.
Asset Limits $2,000 (individual), $3,000 (couple) (excludes home up to $713,000, car).
MA

Not available in Dukes/Nantucket Counties; multiple SCO providers (e.g., CCA, Tufts).

Benefits
Personal care (5-7 hours/day) Medical care Respite (240 hours/year) Adult

Medicare Savings Program (MSP)

Massachusetts Medicare Savings Program (MassHealth Buy-In)

Age 65+ or disabled
General Massachusetts resident, Medicare Part A/B.
Income Limits (2025) ~$2,510/month (QMB), ~$3,380/month (SLMB), ~$3,598/month (QI)—individual.
Asset Limits $9,430 (individual), $14,130 (couple).
MA

Three tiers; no waitlist; includes Extra Help for Part D.

Benefits
Covers Part B premiums ($174.70/month) Deductibles ($240/year) Copays (~20%)

National Family Caregiver Support Program (NFCSP) Respite

Massachusetts NFCSP Respite Care

Age
General Caregivers of 60+ needing care or 55+ caregivers of others; Massachusetts resident; functional needs (2+ ADLs).
Income Limits (2025) Prioritizes ~$24,980/year (individual); no strict cap.
Asset Limits Not assessed; need-based.
MA

27 ASAPs; prioritizes low-income, rural caregivers.

Benefits
Respite (4-6 hours/week or 5 days/year) Adult day care ($60/day) Caregiver training Supplies (~$500/year)

Prescription Advantage

Massachusetts Prescription Advantage

Age 65+ or disabled
General Massachusetts resident, enrolled in Medicare Part D (or ineligible for Medicare).
Income Limits (2025) No strict limit; copays vary by income ~$24,980-$75,000/year individual
Asset Limits Not assessed.
MA

Supplements Medicare Part D; no enrollment fee for low-income.

Benefits
Covers prescription copays ($5-$40/drug) Fills coverage gaps Catastrophic cost protection ($4,000+ covered)

VA Aid and Attendance (A&A) and Housebound Benefits

Massachusetts VA Aid and Attendance/Housebound

Age 65+ or disabled veteran/spouse
General Massachusetts resident, wartime service, need for ADL help (A&A) or homebound.
Income Limits (2025) Net income < ~$1,984/month (veteran with dependent, A&A); pension offsets income.
Asset Limits ~$155,356 net worth limit
MA

High veteran demand statewide.

Benefits
Cash (~$1,433-$2,642/month veteran, ~$951-$1,318 spouse) for care costs (e.g., in-home, assisted living)

Compare Nursing Home around Middlesex County

The information below is reported by the Massachusetts Executive Office of Elder Affairs and Department of Public Health.

4 facilities compared · CMS & MA Dept. of Health data

Filter by care type
The Leonard Florence Center
NH

Nursing Home Licensed facility providing 24/7 skilled nursing care for residents with complex, ongoing medical needs. Staffed by RNs, LPNs, and CNAs. Inspected and star-rated annually by CMS. Accepts Medicare (short-term rehab) and Medicaid (long-term care).

CH

Care Homes

Chelsea (Admirals Hill)100 96.7% +18%4.76 0%+21%$0134.3-95- 88 Adam Ernst$26.1M$14.3M54.8%225775
CareOne at Concord
NH

Nursing Home Licensed facility providing 24/7 skilled nursing care for residents with complex, ongoing medical needs. Staffed by RNs, LPNs, and CNAs. Inspected and star-rated annually by CMS. Accepts Medicare (short-term rehab) and Medicaid (long-term care).

CH

Care Homes

MC

Memory Care Secured, specialized care for people living with Alzheimer's or dementia. Staff trained in cognitive impairment, with higher staff-to-resident ratios and an environment designed to reduce confusion and wandering risk.

Concord (Old Road To Nine Acre Corner)135 85.3% +4%3.85 -77%-2%$7.9k41.31119- 24 -$29.6M$10.8M36.6%225663
Carleton-Willard Village
NH

Nursing Home Licensed facility providing 24/7 skilled nursing care for residents with complex, ongoing medical needs. Staffed by RNs, LPNs, and CNAs. Inspected and star-rated annually by CMS. Accepts Medicare (short-term rehab) and Medicaid (long-term care).

CH

Care Homes

IL

Independent Living Lifestyle-focused communities for older adults offering dining, activities, and transportation with minimal personal care. Best for active, independent seniors who want community without medical support.

Bedford179 73.3% -11%5.34 +7%+36%$25.5k112.8594A+ 6 Carleton Willard Homes Inc$56.0M$23.1M41.2%225273
Sudbury Pines Extended Care
NH

Nursing Home Licensed facility providing 24/7 skilled nursing care for residents with complex, ongoing medical needs. Staffed by RNs, LPNs, and CNAs. Inspected and star-rated annually by CMS. Accepts Medicare (short-term rehab) and Medicaid (long-term care).

CH

Care Homes

HC

Home Care Professional care delivered in the person's own home — from companionship and errands to skilled nursing and therapy. Allows seniors to age in place. Medicare covers skilled home health when medically necessary.

Sudbury92 92.3% +13%4.10 -43%+4%$0389.5-87- 43 Roberta Henderson$12.8M$7.3M57%225531

Frequently Asked Questions about The Leonard Florence Center

What neighborhood is The Leonard Florence Center in?

The Leonard Florence Center is in the Admirals Hill neighborhood.

Is The Leonard Florence Center in a walkable area?

The Leonard Florence Center has a walk score of 88. Very walkable. Most errands can be accomplished on foot, and many essentials are within a short walk.

What is the address of The Leonard Florence Center?

The Leonard Florence Center is located at 165 Captains Row, Chelsea, MA 02150.

What is the phone number of The Leonard Florence Center?

(617) 887-0001 will put you in contact with the team at The Leonard Florence Center.

Is The Leonard Florence Center Medicare or Medicaid certified?

Yes — The Leonard Florence Center is a CMS-certified provider of Medicare and Medicaid.

Guides for Better Senior Living

Care Cost Calculator: See Prices in Your Area

Nursing Home Data Explorer

Don’t Wait Too Long: 7 Red Flag Signs Your Parent Needs Assisted Living Now

The True Cost of Assisted Living in 2025 – And How Families Are Paying For It

Understanding Senior Living Costs: Pricing Models, Discounts & Financial Assistance

Explore Open Rooms
1 Contact details
2 What type of senior care service are you looking for?
3 What budget do you have in mind for senior care?
4 How soon do you need to find care?
5 Additional details

Thank you for your interest!

Our team will be in touch shortly to help with next steps.