Carleton-Willard Village
Nursing Home, Care Home & Independent Living · Middlesex County, MA
CMS overall rating Info CMS (the Centers for Medicare & Medicaid Services) is the federal agency that rates nursing home quality. Its Overall Rating runs from 1 to 5 stars, combining health inspections, staffing, and quality measures, with inspections weighted most heavily.

Carleton-Willard Village

Nursing Home, Care Home & Independent Living · Middlesex County, MA
CMS overall rating Info CMS (the Centers for Medicare & Medicaid Services) is the federal agency that rates nursing home quality. Its Overall Rating runs from 1 to 5 stars, combining health inspections, staffing, and quality measures, with inspections weighted most heavily.
Calculator: See prices in your area
Carleton-Willard Village accepts Medicare, Medicaid, and private pay.

Overview of Carleton-Willard Village

Experience the finest things in retirement living with Carleton-Willard Village, a non-profit community in Bedford, MA, dedicated to offering skilled nursing care, rehabilitation, and assisted living. Residents enjoy utmost comfort and safety in their well-appointed accommodations with easy access to cozy common areas and amenities like their hair salon, auditorium, and the Victoria Café. Dedicated to helping residents live their best lives without worries, the community provides them with comprehensive care services, including daily living assistance, therapy services, and more.

Those living with memory conditions will thrive in a safe and secure environment with access to a multi-level activity program designed to give them enriching experiences that nurture their overall well-being. Dining is a cozy and satisfying experience in the community with its flexible dining options and well-prepared meals that suit residents’ individual dietary needs and preferences.

Quality ratings

Measured by Centers for Medicare & Medicaid Services (CMS)

Overall rating Info The Overall CMS Rating combines results from health inspections, staffing levels and quality measures. Health inspections carry the most weight. Staffing and quality scores can increase or decrease the final rating based on performance compared to state and national standards.
▲ 38.0% Above MA avg. ▲ 38.0% Above MA avg.MA average: 2.9Click the badge to see the full State ranking.Click here to see the full State ranking.
Health Inspection Info Based on the results of the facility's three most recent standard inspections and any complaint investigations. CMS reviews the number, scope, and severity of deficiencies, with more recent findings weighted more heavily.
▼ 29.7% Below MA avg. ▼ 29.7% Below MA avg.MA average: 2.8Click the badge to see the full State ranking.Click here to see the full State ranking.
Staffing Info Measures average nursing staff hours per resident per day, including Registered Nurses (RNs) and total nursing staff. Ratings are adjusted based on the level of care residents require and are compared to state and national benchmarks.
▲ 66.7% Above MA avg. ▲ 66.7% Above MA avg.MA average: 3.0Click the badge to see the full State ranking.Click here to see the full State ranking.
Quality Measures Info Based on clinical and physical health indicators reported to CMS, such as hospital readmissions, falls, pressure ulcers, and improvements in mobility. These measures reflect how well residents' health needs are being managed.
▲ 57.3% Above MA avg. ▲ 57.3% Above MA avg.MA average: 3.2Click the badge to see the full State ranking.Click here to see the full State ranking.

Staffing hours breakdown

Info Daily nursing hours per resident by staff type, reported to CMS. Higher is generally better — compare this facility to state and national averages to see where staffing stands.

Hours per resident per day — compared to Massachusetts state averages

Total nursing care / resident Info This home is ranked 6th out of 93 homes in Massachusetts for nurse hours. Total adjusted nursing hours per resident per day, combining RN, LPN, and aide time. CMS adjusts this for case-mix so facilities can be fairly compared.
5h 20m per day
Rank #6 / 93Nurse hours — State benchmarkedThis home is ranked 6th out of 93 homes in Massachusetts. Shows adjusted nurse hours per resident per day benchmarked to the Massachusetts average, with a ranking across 93 Massachusetts facilities. More hours mean more direct care. The national average is about 3.5 hrs; below 3.0 is a red flag.Ranking totals vary by category as each rank only includes facilities that report data for that metric. Homes missing that data point aren't included in the ranking.Click the rank badge to see the full State ranking.Click here to see the full State ranking.
This facility Massachusetts avg (3h 56m per day)
vs Massachusetts avg
+36%

1 of 6 metrics below state avg

Standout metric Physical Therapist is +112% above state avg
Staff typeHours / Day / Residentvs state avg
Registered Nurse (RN) Info RNs hold the highest nursing license and can assess residents, interpret test results, and direct care plans. More RN hours per day often signals stronger clinical oversight and faster response to health changes. 1h 2m per day ▲ 59% State avg: 39m per day · National avg: 41m per day
LPN / LVN Info Licensed Practical Nurses (LPNs) or Licensed Vocational Nurses (LVNs) deliver routine hands-on care — medication administration, wound dressing, and monitoring vital signs. They work under RN supervision and make up a large share of daily bedside care. 47m per day ▼ 19% State avg: 58m per day · National avg: 52m per day
Nurse Aide Info Certified Nurse Aides (CNAs) provide the most direct day-to-day assistance: bathing, dressing, feeding, and mobility. Nurse aide hours are typically the largest staffing category and directly affect residents' quality of life. 3h 18m per day ▲ 46% State avg: 2h 16m per day · National avg: 2h 21m per day
Weekend Total Nursing Info Combined nursing hours (RN + LPN + Nurse Aide) per resident per day on weekends. Staffing often drops on weekends — this figure reveals whether the facility maintains adequate coverage outside of weekday hours. 4h 53m per day ▲ 41% State avg: 3h 27m per day · National avg: 3h 26m per day
Physical Therapist Info Hours per resident per day provided by licensed Physical Therapists (PTs) or PT Assistants. PT services help residents recover mobility after injury or illness and are especially important for post-acute (short-stay) rehabilitation. 8m per day ▲ 112% State avg: 4m per day · National avg: 4m per day
Weekend RN Info Registered nurse hours specifically on weekends. Facilities sometimes reduce RN presence on Saturdays and Sundays — a low weekend RN figure compared to weekday hours can indicate reduced clinical oversight when most administrative staff are absent. 57m per day ▲ 102% State avg: 28m per day · National avg: 29m per day

Capacity and availability

Avg. Length of Stay
243 days
Bed community size
179-bed community Rank #12 / 280Bed count — State benchmarkedThis home is ranked 12th out of 280 homes in Massachusetts. Shows this facility's certified or reported bed count compared to other Massachusetts facilities. Larger communities may offer more amenities, programs, and on-site services for residents and families.Ranking totals vary by category as each rank only includes facilities that report data for that metric. Homes missing that data point aren't included in the ranking.Click the rank badge to see the full State ranking.Click here to see the full State ranking.
A large-scale community that may provide a wide range of amenities, services, and structured programs.
Walk Score
Walk Score: 6 / 100 Rank #485 / 499Walk Score — State benchmarkedThis home is ranked 485th out of 499 homes in Massachusetts. Shows how walkable this facility's neighborhood is compared to the average Walk Score across Massachusetts facilities. Higher scores benefit residents, families, and staff.Ranking totals vary by category as each rank only includes facilities that report data for that metric. Homes missing that data point aren't included in the ranking.Click the rank badge to see the full State ranking.Click here to see the full State ranking.
Car-dependent. Most errands require a car, with limited nearby walkable options.
BBB Rating
BBB Rating: A+ (Not Accredited)
An independent rating from the Better Business Bureau based on factors such as complaint history, transparency, and business practices.
How BBB ratings work

About this community

Awards

AwardsNursing Homes Magazine and Sage Best In Category award, MassAging’s Program Innovation of the Year award

Type Of Units

Low Income Rooms Yes/No from payment or funding tags indicating low-income accessibility options in state disclosures—not a determination of personal eligibility.
No
Total beds
179 units

Staffing

Key information about the people who lead and staff this community.

Leadership

ContactMs. Barbara Doyle, C.E.O.

Therapy & Rehabilitation

1 service
Rehabilitation Services

Additional Services

1 service
Home Care

Amenities & Lifestyle

Garden
Housekeeping
Branded ProgramsCW At Home
Wellness ProgramThe Aquatic and Fitness Center offers a unique and expanded fitness program designed for Residents throughout the full continuum of care.
Specific ProgramsCampus Map, Printable Directions, Login for Residents, Login for Employees
Religious ServicesYes

Pricing & Financial Information

Starting Price$1,092,091 per month

Contact Carleton-Willard Village

Inspection History

In Massachusetts, the Executive Office of Elder Affairs (for assisted living facilities) and the Department of Public Health (for nursing homes) are the agencies authorized to inspect and report on facility safety.

Since 2022 · 4 years of data 11 citations 6 inspections

Inspection Scorecard Info This scorecard compares key inspection, citation, and complaint metrics at this facility against the Massachusetts state average. Metrics rated ≥15% worse than average are highlighted in red; those ≥15% better are highlighted in green.

Since 2022 vs. Massachusetts state average
Overall vs. MA average 1 Worse Metrics worse than Massachusetts average:
• Citations per inspection (157% above)
3 Better Metrics better than Massachusetts average:
• Total citations (21% below)
• Citations per year (20% below)
• Total inspections (71% below)
Latest Inspection June 10, 2025 Complaint Investigation

Citations Info Citations are formal regulatory issues recorded during state inspections.

This FacilityMA Averagevs. MA Avg
Total citations Info Formal regulatory issues recorded by inspectors across all inspection types. 1114 This facility has 21% fewer total citations than a typical Massachusetts nursing home (11 vs. MA avg 14).↓ 21% better
Citations per year Info Average citations per year since 2022. 2.83.5 This facility has 20% fewer citations per year than a typical Massachusetts nursing home (2.8 vs. MA avg 3.5).↓ 20% better
Citations per inspection Info Average citations per inspection. 1.80.7 This facility has 157% more citations per inspection than a typical Massachusetts nursing home (1.8 vs. MA avg 0.7).↑ 157% worse

Inspections Info State inspections evaluate whether the facility meets health and safety standards.

This FacilityMA Averagevs. MA Avg
Total inspections Info Combined count of all routine and focused inspections. Excludes complaint investigations. 621 This facility has 71% fewer total inspections than a typical Massachusetts nursing home (6 vs. MA avg 21).↓ 71% better

Health Inspection History

Inspections since 2023
Total health inspections 4

Massachusetts average 4.5


Last Health inspection on Jun 2025

Total health citations
11 Rank #9 / 93Health citations — State benchmarkedThis home is ranked 9th out of 93 homes in Massachusetts. Shows this facility's total health deficiency citations benchmarked to the Massachusetts State average, with a ranking across all 93 MA facilities. Lower citation counts earn a better rank.Ranking totals vary by category as each rank only includes facilities that report data for that metric. Homes missing that data point aren't included in the ranking.Click the rank badge to see the full State ranking.Click here to see the full State ranking.

Massachusetts average 32.7

Citations per inspection
2.75 Rank #6 / 93Citations per inspection — State benchmarkedThis home is ranked 6th out of 93 homes in Massachusetts. Shows average deficiency citations per CMS inspection for this facility versus the Massachusetts mean across 93 facilities with citation data. Lower is better.Ranking totals vary by category as each rank only includes facilities that report data for that metric. Homes missing that data point aren't included in the ranking.Click the rank badge to see the full State ranking.Click here to see the full State ranking.

Massachusetts average 7.24


Health citations are formal notices following inspections when they fail to comply with safety and care standards.

2 of 11 citations resulted from standard inspections; and 9 of 11 resulted from complaint investigations.

Breakdown of citation severity (last 3 years)
Critical health citations
3
900% worse than Massachusetts average

Massachusetts average: 0.3


Serious health citations
2
33% worse than Massachusetts average

Massachusetts average: 1.5

3 critical citations Massachusetts average: 0.3

2 serious citations Massachusetts average: 1.5

6 moderate citations Massachusetts average: 29.7

0 minor citations Massachusetts average: 1.3
Citations history (last 3 years)
Abuse/Neglect critical citation Jun 10, 2025
Corrected

Quality of Care critical citation Jun 10, 2025
Corrected

Care Planning critical citation Jun 10, 2025
Corrected

Pharmacy moderate citation Feb 07, 2025
Corrected

Staffing Data

Reporting period: October 1 – December 31, 2025 (Q4 2025). Source: CMS Payroll-Based Journal report.

Total staff 205
Employees 190
Contractors 15
Staff to resident ratio 2.11 : 1
27% more staff per resident than Massachusetts average
Massachusetts average ratio: 1.66 : 1 Massachusetts average ratio: 1.66 : 1See full Massachusetts ranking
Avg staff/day 77
Average shift 7.6 hours
0% compared with Massachusetts average
Massachusetts average: 7.9 hours Massachusetts average shift: 7.9 hoursSee full Massachusetts ranking
Total staff hours (quarter) 54,108

Nursing staff breakdown

Q4 2025 · Oct 1 – Dec 31 More info This data comes from the CMS Payroll-Based Journal report covering October 1 – December 31, 2025.
Registered Nurse

Manages medical care and health needs.

RN Staff Info 28 total: 21 full-time employees and 7 contractors. 28
Average shift length Info Average shift length. Calculated as total hours divided by days worked and average staff per day. 7.7 hours
Licensed Practical Nurse

Assists with medical care and medications.

LPN Staff Info 23 total: 20 full-time employees and 3 contractors. 23
Average shift length Info Average shift length. Calculated as total hours divided by days worked and average staff per day. 7.2 hours
Certified Nursing Assistant

Helps with daily care and mobility.

CNA Staff Info 90 total: 87 full-time employees and 3 contractors. 90
Average shift length Info Average shift length. Calculated as total hours divided by days worked and average staff per day. 7.7 hours

Contractor staffing

Q4 2025 · Oct 1 – Dec 31 More info This data comes from the CMS Payroll-Based Journal report covering October 1 – December 31, 2025.

Total hours from contractors

0.7%

405 contractor hours this quarter

Registered Nurse: 7 Certified Nursing Assistant: 3 Licensed Practical Nurse: 3 Medical Director: 1 Occupational Therapy Assistant: 1

Staff by category

Q4 2025 · Oct 1 – Dec 31 More info This data comes from the CMS Payroll-Based Journal report covering October 1 – December 31, 2025.
Certified Nursing Assistant8739028,59592100%7.7
Registered Nurse217286,16992100%7.7
Licensed Practical Nurse203235,22392100%7.2
Other Dietary Services Staff200202,87492100%7.3
Clinical Nurse Specialist9092,28592100%8.7
RN Director of Nursing3031,5329098%8.2
Respiratory Therapy Technician9091,2238390%6.1
Physical Therapy Assistant5051,1967480%7
Mental Health Service Worker3038776470%8
Qualified Social Worker2028106368%7.9
Dietitian2026516267%6.8
Speech Language Pathologist2024866874%6.7
Physical Therapy Aide1014796166%7.8
Administrator1014645863%8
Nurse Practitioner1014645863%8
Occupational Therapy Aide1013855054%7.7
Feeding Assistant3033184650%6.9
Medical Director011521314%4
Occupational Therapy Assistant0112567%4.2
90 Certified Nursing Assistant
% of Days 100%
28 Registered Nurse
% of Days 100%
23 Licensed Practical Nurse
% of Days 100%
20 Other Dietary Services Staff
% of Days 100%
9 Clinical Nurse Specialist
% of Days 100%
3 RN Director of Nursing
% of Days 98%
9 Respiratory Therapy Technician
% of Days 90%
5 Physical Therapy Assistant
% of Days 80%
3 Mental Health Service Worker
% of Days 70%
2 Qualified Social Worker
% of Days 68%
2 Dietitian
% of Days 67%
2 Speech Language Pathologist
% of Days 74%
1 Physical Therapy Aide
% of Days 66%
1 Administrator
% of Days 63%
1 Nurse Practitioner
% of Days 63%
1 Occupational Therapy Aide
% of Days 54%
3 Feeding Assistant
% of Days 50%
1 Medical Director
% of Days 14%
1 Occupational Therapy Assistant
% of Days 7%

Penalties and fines

Includes penalties issued in 2024-2025

Federal penalties imposed by CMS for regulatory violations, including civil money penalties (fines) and denials of payment for new Medicare/Medicaid admissions.

Source: CMS Penalties Database (Data as of Jan 2026)

Total fines amount $25K Rank #74 / 94Federal fines — State benchmarkedThis home is ranked 74th out of 94 homes in Massachusetts. Shows this facility's cumulative CMS federal fine dollars versus the Massachusetts average among facilities with fines, and where it ranks among 94 facilities in the pool. Lower total dollars mean a better rank.Ranking totals vary by category as each rank only includes facilities that report data for that metric. Homes missing that data point aren't included in the ranking.Click the rank badge to see the full State ranking.Click here to see the full State ranking.
65% lower than Massachusetts average

Massachusetts average: $72K

Number of fines 2
17% more fines than Massachusetts average

Massachusetts average: 1.7

Payment Denials Info Serious action where Medicare and/or Medicaid temporarily stops payments for new residents until issues are fixed. 0
100% fewer payment denials than Massachusetts average

Massachusetts average: 0.1

Fines amount comparison
This facility $25K
Massachusetts average $72K
Penalty History

Penalties are imposed by CMS for violations of federal nursing home regulations.

2 penalties in the past 3 years

Multiple penalties were reported in the last 3 years.

Civil Money Penalty Info Fines imposed for noncompliance, which can be assessed per day or per instance of violation. Jun 10, 2025
$17K
Civil Money Penalty Info Fines imposed for noncompliance, which can be assessed per day or per instance of violation. May 29, 2024
$9K

Last updated: Jan 2026

Quality of care over time

These measures show how residents usually do over time at this home, based on health outcomes and preventive care.

High-risk clinical events score Info A composite score based on pressure ulcers, falls with injury, weight loss, walking ability decline, and activities of daily living decline. 8.1
21% better than Massachusetts average

Massachusetts average: 10.2

Functional decline score Info A composite score based on activities of daily living decline, walking ability decline, and incontinence. 15.3
24% better than Massachusetts average

Massachusetts average: 20.0

Long-stay resident measures
Significantly above average Info CMS star rating based on long-stay quality measure performance. 5 stars = significantly above average, 1 star = significantly below average.
Need for Help with Daily Activities Increased Info Percent of long-stay residents whose need for help with daily activities has increased 15.5%
17% better than Massachusetts average

Massachusetts average: 18.7%

Walking Ability Worsened Info Percent of long-stay residents whose ability to move independently worsened 14.5%
25% better than Massachusetts average

Massachusetts average: 19.3%

Low Risk Residents with Bowel/Bladder Incontinence Info Percent of low risk long-stay residents who lose control of their bowels or bladder 15.8%
29% better than Massachusetts average

Massachusetts average: 22.1%

Falls with Major Injury Info Percent of long-stay residents experiencing one or more falls with major injury 2.9%
20% better than Massachusetts average

Massachusetts average: 3.6%

High Risk Residents with Pressure Ulcers Info Percent of long-stay high risk residents with pressure ulcers 4.0%
14% better than Massachusetts average

Massachusetts average: 4.7%

Urinary Tract Infection Info Percent of long-stay residents with a urinary tract infection 1.5%
30% better than Massachusetts average

Massachusetts average: 2.1%

Lost Too Much Weight Info Percent of long-stay residents who lose too much weight 3.7%
29% better than Massachusetts average

Massachusetts average: 5.2%

Depressive Symptoms Info Percent of long-stay residents who have depressive symptoms 0.3%
97% better than Massachusetts average

Massachusetts average: 10.7%

Antipsychotic Use Info Percent of long-stay residents who received an antipsychotic medication 11.5%
43% better than Massachusetts average

Massachusetts average: 20.3%

Pneumococcal Vaccine Info Percent of long-stay residents assessed and appropriately given the pneumococcal vaccine 98.9%
8% better than Massachusetts average

Massachusetts average: 91.9%

Influenza Vaccine Info Percent of long-stay residents assessed and appropriately given the seasonal influenza vaccine 98.9%
In line with Massachusetts average

Massachusetts average: 94.8%

Hospitalizations per 1,000 days Info Number of hospitalizations per 1,000 long-stay resident days. 1.04
44% better than Massachusetts average

Massachusetts average: 1.86

ED visits per 1,000 days Info Number of outpatient emergency department visits per 1,000 long-stay resident days. 1.12
27% better than Massachusetts average

Massachusetts average: 1.54

Short-stay resident measures
Significantly above average Info CMS star rating based on short-stay quality measure performance. 5 stars = much above average, 1 star = much below average.
Pneumococcal Vaccine Info Percent of short-stay residents assessed and appropriately given the pneumococcal vaccine 86.5%
13% better than Massachusetts average

Massachusetts average: 76.7%

Antipsychotic medication increase Info Percent of short-stay residents who newly received an antipsychotic medication 0.0%
100% better than Massachusetts average

Massachusetts average: 1.3%

Influenza Vaccine Info Percent of short-stay residents assessed and appropriately given the seasonal influenza vaccine 88.6%
14% better than Massachusetts average

Massachusetts average: 77.7%

Re-hospitalized after SNF stay Info Percentage of short-stay residents who were re-hospitalized after their nursing home admission. 15.3%
41% better than Massachusetts average

Massachusetts average: 25.8%

Emergency department visits Info Percentage of short-stay residents who had an outpatient emergency department visit. 4.4%
63% better than Massachusetts average

Massachusetts average: 11.8%

Falls with major injury Info Percentage of SNF residents who experience falls with major injury during their stay. 0.0%
100% better than Massachusetts average

Massachusetts average: 0.8%

Ability to care for self at discharge Info Percentage of residents at or above expected ability to care for themselves at discharge. 50.8%
5% worse than Massachusetts average

Massachusetts average: 53.7%

Successful return to home or community Info Rate of successful return to home or community from a skilled nursing facility. 40.8%
19% worse than Massachusetts average

Massachusetts average: 50.6%

Breakdown by payment type

Medicare

48% of new residents, usually for short-term rehab.

Typical stay 1 - 2 months

Private pay

49% of new residents, often for short stays.

Typical stay 1 - 2 years

Medicaid

3% of new residents, often for long-term daily care.

Typical stay 7 years

Facility Characteristics

Source: CMS Long-Term Care Facility Characteristics (Data as of Jan 2026)

Total residents 97
Medicare
3
3.1% of residents
Medicaid
22
22.7% of residents
Private pay or other
72
74.2% of residents
Programs & Services
Residents Group

Residents meet regularly to discuss policies, care quality, and activities

Family Member Group

Family members meet regularly to discuss policies, care quality, and activities

CCRC

Part of a Continuing Care Retirement Community offering multiple care levels

Active Family Council

Organized group of family members that meets regularly to discuss facility policies, resident care, and activities.

Active Resident Council

Organized group of residents that meets regularly to discuss facility policies, quality of life, and activities.

Finances and operations

Based on CMS SNF Cost Report for fiscal year ending in 12/2023.

Governmental community
Operated by a subsidized facility district.
Net patient revenue Info Net patient revenue — what the home actually collects for resident care, after contractual allowances, bad debt and discounts are subtracted from its gross charges (CMS cost report, Worksheet G-3). It covers resident care only; money the home earns from other sources is shown separately as "Other income."
$39.8M
Net patient income Info Net patient income: net patient revenue minus the home's total operating expenses. A positive figure means it earns more from resident care than it spends to deliver it; a negative figure means the opposite. It excludes non-operating "other income."
-$1.7M
Governmental community Operated by a subsidized facility district.
Net patient revenue Info Net patient revenue — what the home actually collects for resident care, after contractual allowances, bad debt and discounts are subtracted from its gross charges (CMS cost report, Worksheet G-3). It covers resident care only; money the home earns from other sources is shown separately as "Other income."
$39.8M Rank #2 / 96Revenue — State benchmarkedThis home is ranked 2nd out of 96 homes in Massachusetts. Shows this facility's annual revenue compared to the Massachusetts average. Higher revenue generally means more resources for staffing and capital — read alongside Payroll %.Ranking totals vary by category as each rank only includes facilities that report data for that metric. Homes missing that data point aren't included in the ranking.Click the rank badge to see the full State ranking.Click here to see the full State ranking.
Net patient income Info Net patient income: net patient revenue minus the home's total operating expenses. A positive figure means it earns more from resident care than it spends to deliver it; a negative figure means the opposite. It excludes non-operating "other income."
-$1.7M
Other income Info Money the home earns outside of resident care — such as investments, grants, rentals and other non-operating sources (CMS cost report, Worksheet G-3). It is tracked separately from net patient revenue: it is not part of that figure, and it is not included in net patient income.
$6.7M
Payroll costs Info Staff salaries plus wage-related costs — benefits such as payroll taxes, health insurance and retirement — from the home's own accounting records (CMS cost report, Worksheet A). Contract or agency labor is counted separately, under other operating costs. Rank #3 / 96Payroll — State benchmarkedThis home is ranked 3rd out of 96 homes in Massachusetts. Shows total annual staff payroll benchmarked to the Massachusetts average. Higher payroll investment relative to peers often signals better staffing and less reliance on cheaper contract labor.Ranking totals vary by category as each rank only includes facilities that report data for that metric. Homes missing that data point aren't included in the ranking.Click the rank badge to see the full State ranking.Click here to see the full State ranking.
$21.3M 53.5% of net patient revenue Info Payroll as a share of revenue: staff salaries and wage-related benefits divided by net patient revenue. A higher figure means more of each revenue dollar goes to staff pay. Rank #80 / 96Payroll % — State benchmarkedThis home is ranked 80th out of 96 homes in Massachusetts. Shows payroll as a percentage of revenue versus the Massachusetts average. Well-run Massachusetts facilities typically land around 54–65% — the top third Statewide. Below 25% may signal understaffing or heavy agency use — read with Staffing ratings.Ranking totals vary by category as each rank only includes facilities that report data for that metric. Homes missing that data point aren't included in the ranking.Click the rank badge to see the full State ranking.Click here to see the full State ranking.
Other operating costs Info Everything it costs to run the home apart from payroll — food, utilities, supplies, maintenance, contract labor and administration. Calculated as total operating expense minus payroll (staff salaries and wage-related benefits).
$20.2M
Total costs Info The home's total operating expense for the year — all the costs of running it, salaries included (CMS cost report, Worksheet G-3).
$41.5M

What does this home offer?

Housing options icon

Housing Options: 1 Bed / 2 Bed Apartments

Building type icon
Building type icon

Building Type: Single-story

Beauty services icon

Beauty Services

Transportation services icon

Transportation Services

Housekeeping icon
Housekeeping icon

Housekeeping Services

Recreational activities icon

Recreational Activities

Exercise program icon

Exercise Programs

Who this home usually serves

TYPE OF STAY

Mix of rehab and long-term care

This home supports both short-term rehab and long-term care, with residents staying for a wide range of durations.

New residents most often arrive under private pay (49% of admissions), and a typical private pay stay runs around 1 - 2 years.

Admissions
137 total

Coverage residents most often arrive under.

Medicare 48%
Private pay 49%
Medicaid 3%
Discharges
189 total

Coverage residents most often leave under.

Medicare 32%
Private pay 61%
Medicaid 7%

Managed by Jeffrey R. Williams

Executive Director

Jeffrey R. Williams is an experienced executive with a distinguished career in financial services and education across Greater China. He was the inaugural Executive Director and General Manager of Harvard Center (Shanghai) Co., Ltd., Harvard University’s base of operations in China. Jeff has held senior roles at Citibank, American Express, and Standard Chartered Bank, and serves as an advisor and director for multiple organizations in Asia.

Places of interest near Carleton-Willard Village

Address 1.8 miles from city center Info Estimated distance in miles from Bedford's city center to Carleton-Willard Village's address, calculated via Google Maps.

Calculate Travel Distance to Carleton-Willard Village

Add your location

Address

Financial Assistance for
Nursing Home in Massachusetts

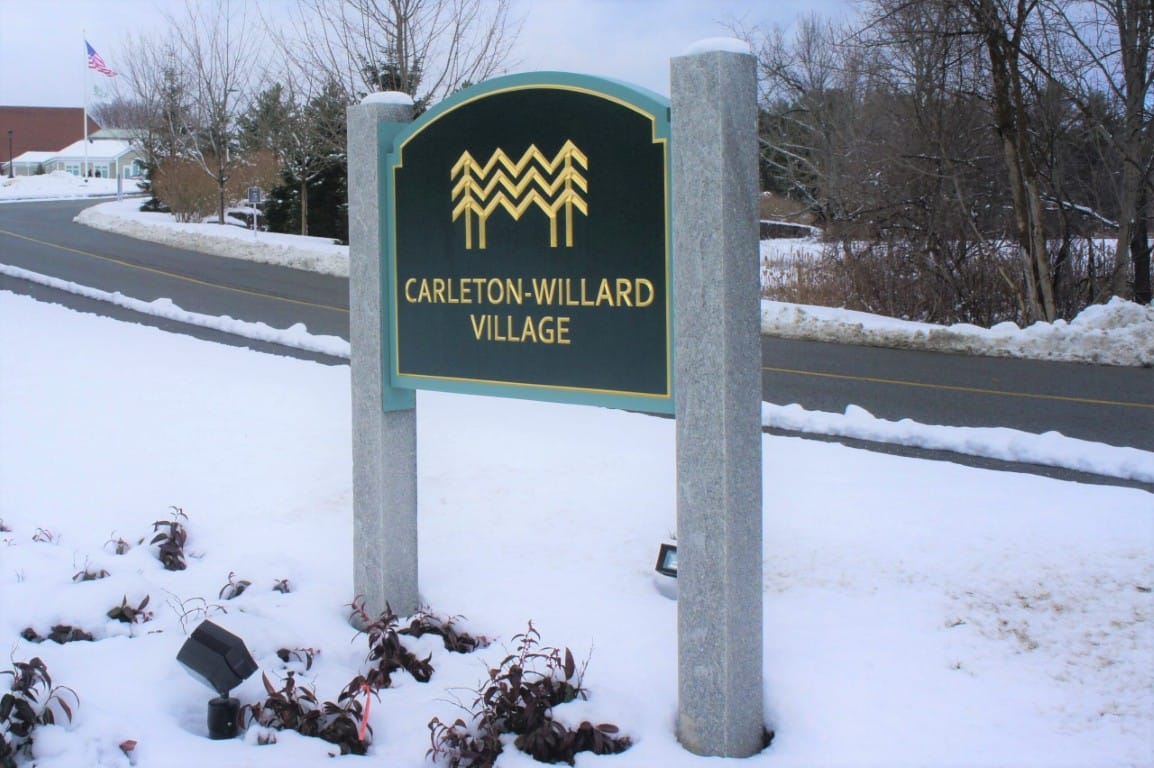
Carleton-Willard Village is located in Bedford, Massachusetts.
Here are the financial assistance programs available to residents in Massachusetts.

Get Financial aid guidance

Home Care Program

MassHealth Home Care

Age 60+
General Massachusetts resident, at risk of nursing home placement.
Income Limits (2025) ~$1,500/month individual, varies by region
Asset Limits $2,000 individual, excludes home, car
MA

Coordinated through Aging Services Access Points (ASAPs); high demand in urban areas.

Benefits
In-home care (3-5 hours/day) Homemaker services Respite care (up to 14 days/year) Adult day care (~$75/day)

Frail Elder Waiver

Massachusetts Medicaid FE Waiver

Age 65+
General Massachusetts resident, Medicaid-eligible, nursing home-level care need.
Income Limits (2025) ~$2,829/month 300% FBR, individual
Asset Limits $2,000 (individual), $3,000 (couple).
MA

Requires clinical eligibility determination.

Benefits
Personal care (5-7 hours/day) Respite care (240 hours/year) Adult day care (~$75/day) Home health services

Senior Care Options (SCO)

Massachusetts Senior Care Options

Age 65+
General Massachusetts resident, eligible for MassHealth (Medicare optional), nursing home-level care need.
Income Limits (2025) ~$2,829/month (300% FBR, individual); QIT allowed.
Asset Limits $2,000 (individual), $3,000 (couple) (excludes home up to $713,000, car).
MA

Not available in Dukes/Nantucket Counties; multiple SCO providers (e.g., CCA, Tufts).

Benefits
Personal care (5-7 hours/day) Medical care Respite (240 hours/year) Adult

Medicare Savings Program (MSP)

Massachusetts Medicare Savings Program (MassHealth Buy-In)

Age 65+ or disabled
General Massachusetts resident, Medicare Part A/B.
Income Limits (2025) ~$2,510/month (QMB), ~$3,380/month (SLMB), ~$3,598/month (QI)—individual.
Asset Limits $9,430 (individual), $14,130 (couple).
MA

Three tiers; no waitlist; includes Extra Help for Part D.

Benefits
Covers Part B premiums ($174.70/month) Deductibles ($240/year) Copays (~20%)

National Family Caregiver Support Program (NFCSP) Respite

Massachusetts NFCSP Respite Care

Age
General Caregivers of 60+ needing care or 55+ caregivers of others; Massachusetts resident; functional needs (2+ ADLs).
Income Limits (2025) Prioritizes ~$24,980/year (individual); no strict cap.
Asset Limits Not assessed; need-based.
MA

27 ASAPs; prioritizes low-income, rural caregivers.

Benefits
Respite (4-6 hours/week or 5 days/year) Adult day care ($60/day) Caregiver training Supplies (~$500/year)

Prescription Advantage

Massachusetts Prescription Advantage

Age 65+ or disabled
General Massachusetts resident, enrolled in Medicare Part D (or ineligible for Medicare).
Income Limits (2025) No strict limit; copays vary by income ~$24,980-$75,000/year individual
Asset Limits Not assessed.
MA

Supplements Medicare Part D; no enrollment fee for low-income.

Benefits
Covers prescription copays ($5-$40/drug) Fills coverage gaps Catastrophic cost protection ($4,000+ covered)

VA Aid and Attendance (A&A) and Housebound Benefits

Massachusetts VA Aid and Attendance/Housebound

Age 65+ or disabled veteran/spouse
General Massachusetts resident, wartime service, need for ADL help (A&A) or homebound.
Income Limits (2025) Net income < ~$1,984/month (veteran with dependent, A&A); pension offsets income.
Asset Limits ~$155,356 net worth limit
MA

High veteran demand statewide.

Benefits
Cash (~$1,433-$2,642/month veteran, ~$951-$1,318 spouse) for care costs (e.g., in-home, assisted living)

Frequently Asked Questions about Carleton-Willard Village

Is Carleton-Willard Village in a walkable area?

Carleton-Willard Village has a walk score of 6. Car-dependent. Most errands require a car, with limited nearby walkable options.

What is the occupancy rate at Carleton-Willard Village?

Carleton-Willard Village's occupancy is 73.3%.

Are there photos of Carleton-Willard Village?

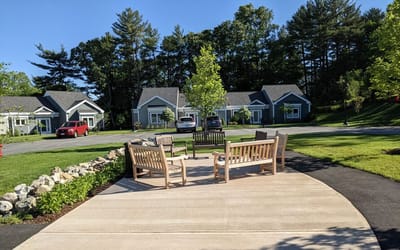
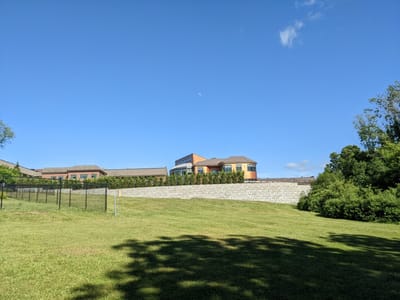
Yes — there are 3 photos of Carleton-Willard Village in the photo gallery on this page.

What is the address of Carleton-Willard Village?

Carleton-Willard Village is located at 100 Old Billerica Road, Bedford, MA 01730.

What is the phone number of Carleton-Willard Village?

(781) 275-8700 will put you in contact with the team at Carleton-Willard Village.

Is Carleton-Willard Village Medicare or Medicaid certified?

Yes — Carleton-Willard Village is a CMS-certified provider of Medicare and Medicaid.

Guides for Better Senior Living

Care Cost Calculator: See Prices in Your Area

Nursing Home Data Explorer

Don’t Wait Too Long: 7 Red Flag Signs Your Parent Needs Assisted Living Now

The True Cost of Assisted Living in 2025 – And How Families Are Paying For It

Understanding Senior Living Costs: Pricing Models, Discounts & Financial Assistance