


CareVilla Briggs Chaney
Assisted Living, Memory Care, Palliative Care & Respite Care · Silver Spring, MD


CareVilla Briggs Chaney
Assisted Living, Memory Care, Palliative Care & Respite Care · Silver Spring, MD
Overview of Carevilla Briggs Chaney
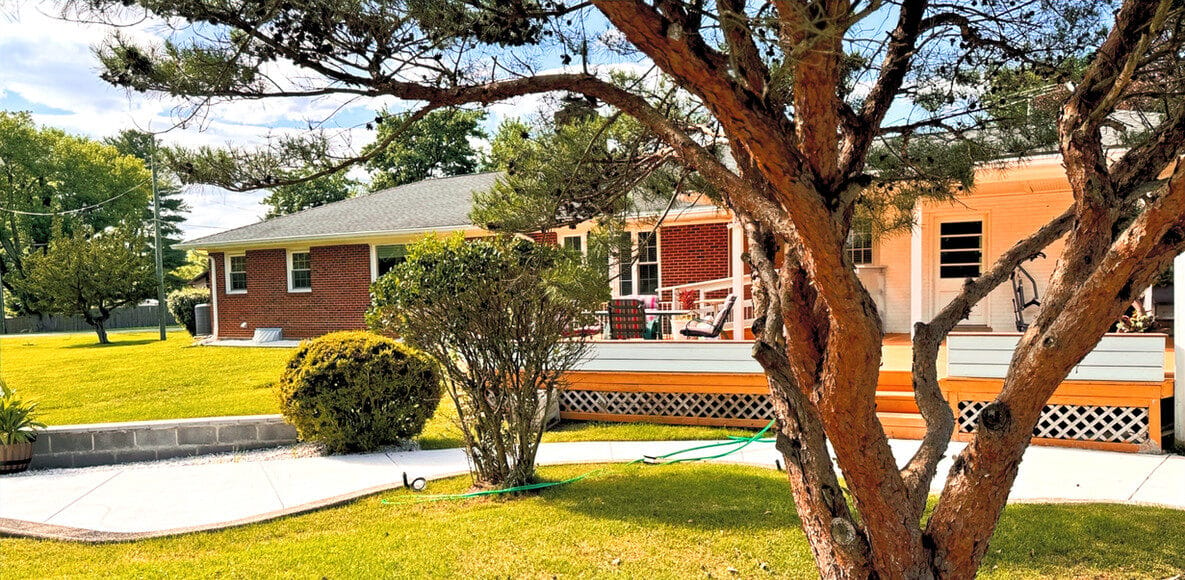
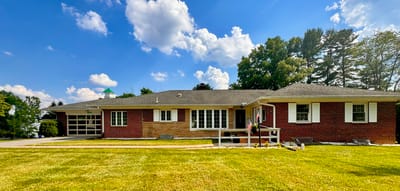
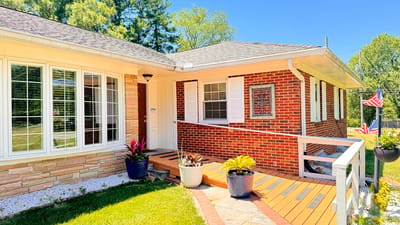
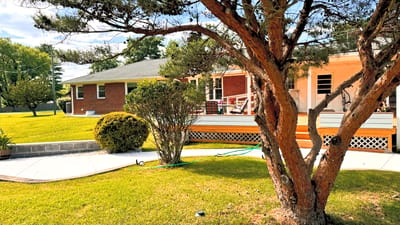
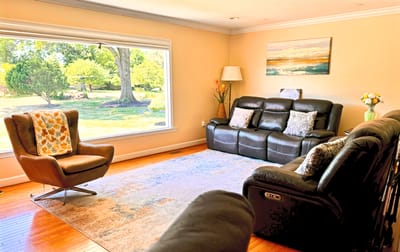
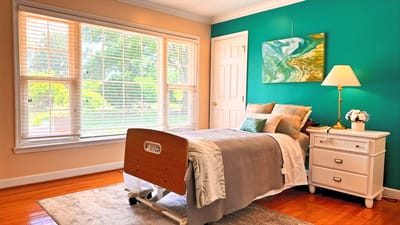
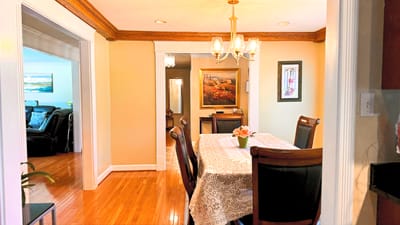
Ideally located in the peaceful neighborhood of Briggs Chaney Road, Silver Spring, MD, Carevilla Briggs Chaney is an idyllic retreat that offers assisted living, memory care, palliative care, and short-term care. The community is committed to enhancing residents’ well-being, providing residents with top-notch care and assistance tailored to their unique needs 24/7. Housekeeping, laundry, and state-of-the-art security systems are also provided for residents to live a worry-free retirement.
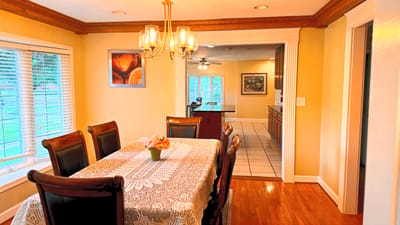
Stimulating activities and engaging programs are conducted, promoting belongingness for residents to stay active and socially engaged. Here, residents enjoy healthy and delicious meals that cater to dietary needs and preferences. Continence management, medication management, diagnosis management, and mobility assistance are also provided to ensure residents are well-cared for. With its cozy spaces and top-notch care, residents are guaranteed to live their golden years with ease.
Walk Score: 2 / 100 Rank #940 / 985Walk Score — State benchmarkedThis home is ranked 940th out of 985 homes in Maryland. Shows how walkable this facility's neighborhood is compared to the average Walk Score across Maryland facilities. Higher scores benefit residents, families, and staff.Click the rank badge to see the full State ranking.Click here to see the full State ranking.
Car-dependent. Most errands require a car, with limited nearby walkable options.
About this community
Rehabilitation Services
Respite Care
Licensed Nurses/CNAs
24-Hour Staffing
Palliative Care
24/7 Aides
24/7 Nursing Support
24/7 Call Bell System
Wander Guard
Laundry
Housekeeping
Personal Hygiene
Mobility & Transfer
Feeding & Meal Prep
Continence Management
Appointment Management
Entertainment
Diagnosis Management
Recreation
Touring HoursMonday-Sunday: 9:30 AM - 6 PM
What does this home offer?
Housing Options: Private / Shared Rooms
Building Type: Single-story
Transportation Services
Housekeeping Services
Recreational Activities
Exercise Programs
CareVilla Briggs Chaney Reviews
Kim Waterworth
My husband was a resident here until he passed . I can’t express how wonderful the care was at Care Villa. We truly became part of the family. After rehab did nothing for him, the best PT got him up, standing, and walking again. Home cooked meals! Welcoming atmosphere. And peace of mind for me knowing he was safe , respected, and definitely cared for.What do you like most about living here?
Answer: My husband was safe, clean, cared for, and content.
Are there enough caregivers to handle the residents' needs, especially during emergencies?
Answer: Yes
Are the common areas pleasant and comfortable for socializing or relaxing?
Answer: Yes
How would you rate the quality and variety of the meals? (1-5)
Answer: 5
Are special diets handled well?
Answer: Yes
Is the dining schedule flexible enough to meet your preferences?
Answer: Yes
How do you feel about the level of social interaction available with other residents?
Answer: Good
How was the units offered in this community?
Answer: Single or double
Do you feel safe living in this community?
Answer: Yes
How well do you think the community handles emergencies or unexpected events?
Answer: Excellently
Are there any hidden fees or unexpected charges?
Answer: No
Would you recommend this community to others looking for senior living options?
Answer: Already have recommended.
Is there anything you wish you knew before moving in?
Answer: No
Places of interest near CareVilla Briggs Chaney
![]() 9.8 miles from city center
9.8 miles from city center
![]() Estimated distance in miles from Silver Spring's city center to CareVilla Briggs Chaney's address, calculated via Google Maps.
Estimated distance in miles from Silver Spring's city center to CareVilla Briggs Chaney's address, calculated via Google Maps.
Calculate Travel Distance to CareVilla Briggs Chaney
Add your location
Financial Assistance for
Assisted Living in Maryland
CareVilla Briggs Chaney is located in Silver Spring, Maryland.
Here are the financial assistance programs available to residents in Maryland.
Compare Assisted Living around Silver Spring
The information below is reported by the Maryland Department of Health, Office of Health Care Quality.
| Sunrise of Chevy Chase |
AL Assisted Living A licensed, long-term care setting for seniors or individuals with disabilities who need help with daily activities — like bathing, dressing, and medication management — but not 24-hour skilled nursing. Offers housing, meals, and around-the-clock support while aiming to maximize resident independence.
MC Memory Care Secured, specialized care for people living with Alzheimer's or dementia. Staff trained in cognitive impairment, with higher staff-to-resident ratios and an environment designed to reduce confusion and wandering risk. | Silver Spring (Rock Creek Gardens) | 196
Facility
196
MD AVG
43
Rank
#10 / 697 | No |
71
Facility
71
MD AVG
43
Rank
#175 / 985 | Private / Shared Rooms | 8
Facility
8
MD AVG
21
Rank
#162 / 208 |
58% Male Residents — State Benchmarked 58% of residents are male, compared to the Maryland average of 31%. An unusually high male share for assisted living, where most facilities skew heavily female. |
42% Female Residents — State Benchmarked 42% of residents are female, compared to the Maryland average of 69%. An unusually low female share — most assisted living facilities have 65–75% female residents. |
69% White Residents — State Benchmarked 69% of residents are reported as White, compared to the Maryland average of 81%. A lower White share than the Maryland average — the community may draw a more diverse resident mix relative to other facilities in Maryland. |
28% African American Residents — State Benchmarked 28% of residents are reported as African American or Black, compared to the Maryland average of 13%. A higher African American share than the typical Maryland average — useful context when comparing cultural fit and community composition. |
3% Other Ethnicity Residents — State Benchmarked 3% of residents fall into categories other than White or African American (combined), compared to the Maryland average of 6%. This column aggregates Hispanic, Asian, multiracial, and any other labeled groups that are not classified as White or African American. Reported subgroups in this total: Hispanic (2%), Asian (1%). |
12% Residents Age 65–74 — State Benchmarked 12% of residents are 65–74, compared to the Maryland average of 13%. In line with the statewide profile for this youngest senior bracket in assisted living. |
39% Residents Age 75–84 — State Benchmarked 39% of residents are 75–84, compared to the Maryland average of 31%. A high concentration in this mid-range bracket, where residents typically need moderate support with daily activities. |
42% Residents Age 85–94 — State Benchmarked 42% of residents are 85–94, compared to the Maryland average of 44%. This is typically the most common age bracket in assisted living — this facility is in line with the statewide norm. |
6% Residents Age 95+ — State Benchmarked 6% of residents are 95 or older, compared to the Maryland average of 16%. Most residents here have not yet reached the oldest-old bracket, suggesting a younger overall community. |
| Brightview Crofton Riverwalk |
AL Assisted Living A licensed, long-term care setting for seniors or individuals with disabilities who need help with daily activities — like bathing, dressing, and medication management — but not 24-hour skilled nursing. Offers housing, meals, and around-the-clock support while aiming to maximize resident independence.
IL Independent Living Lifestyle-focused communities for older adults offering dining, activities, and transportation with minimal personal care. Best for active, independent seniors who want community without medical support.
MC Memory Care Secured, specialized care for people living with Alzheimer's or dementia. Staff trained in cognitive impairment, with higher staff-to-resident ratios and an environment designed to reduce confusion and wandering risk. | Crofton | 92
Facility
92
MD AVG
43
Rank
#155 / 697 | Yes |
45
Facility
45
MD AVG
43
Rank
#475 / 985 | Private / Shared Rooms | 6
Facility
6
MD AVG
21
Rank
#176 / 208 |
27% Male Residents — State Benchmarked 27% of residents are male, compared to the Maryland average of 31%. This facility caters to a majority female resident pool (73% female), consistent with the broader assisted living trend where women significantly outnumber men. |
73% Female Residents — State Benchmarked 73% of residents are female, compared to the Maryland average of 69%. Women comprise the large majority, consistent with national assisted living demographics where women live longer and enter care facilities at higher rates. |
0% White Residents — State Benchmarked 0% of residents are reported as White, compared to the Maryland average of 81%. A lower White share than the Maryland average — the community may draw a more diverse resident mix relative to other facilities in Maryland. |
0% African American Residents — State Benchmarked 0% of residents are reported as African American or Black, compared to the Maryland average of 13%. A lower African American share than is typical in Maryland; local markets still vary widely. |
100% Other Ethnicity Residents — State Benchmarked 100% of residents fall into categories other than White or African American (combined), compared to the Maryland average of 6%. This column aggregates Hispanic, Asian, multiracial, and any other labeled groups that are not classified as White or African American. Reported subgroups in this total: Other (100%). | - | - | - | - |
| Sunrise of Silver Spring |
AL Assisted Living A licensed, long-term care setting for seniors or individuals with disabilities who need help with daily activities — like bathing, dressing, and medication management — but not 24-hour skilled nursing. Offers housing, meals, and around-the-clock support while aiming to maximize resident independence.
MC Memory Care Secured, specialized care for people living with Alzheimer's or dementia. Staff trained in cognitive impairment, with higher staff-to-resident ratios and an environment designed to reduce confusion and wandering risk. | Silver Spring (New Hampshire Avenue) | 84
Facility
84
MD AVG
43
Rank
#170 / 697 | Yes |
40
Facility
40
MD AVG
43
Rank
#523 / 985 | Private / Shared Rooms | 24
Facility
24
MD AVG
21
Rank
#92 / 208 |
31% Male Residents — State Benchmarked 31% of residents are male, compared to the Maryland average of 31%. This facility caters to a majority female resident pool (69% female), consistent with the broader assisted living trend where women significantly outnumber men. |
69% Female Residents — State Benchmarked 69% of residents are female, compared to the Maryland average of 69%. Women comprise the large majority, consistent with national assisted living demographics where women live longer and enter care facilities at higher rates. |
53% White Residents — State Benchmarked 53% of residents are reported as White, compared to the Maryland average of 81%. A lower White share than the Maryland average — the community may draw a more diverse resident mix relative to other facilities in Maryland. |
39% African American Residents — State Benchmarked 39% of residents are reported as African American or Black, compared to the Maryland average of 13%. A higher African American share than the typical Maryland average — useful context when comparing cultural fit and community composition. |
9% Other Ethnicity Residents — State Benchmarked 9% of residents fall into categories other than White or African American (combined), compared to the Maryland average of 6%. This column aggregates Hispanic, Asian, multiracial, and any other labeled groups that are not classified as White or African American. Reported subgroups in this total: Asian (4%), Hawaiian/Pacific Islander (3%), Hispanic (1%). |
4% Residents Age 65–74 — State Benchmarked 4% of residents are 65–74, compared to the Maryland average of 13%. Fewer younger seniors suggests the resident population skews older, likely requiring higher acuity care and more hands-on support. |
43% Residents Age 75–84 — State Benchmarked 43% of residents are 75–84, compared to the Maryland average of 31%. A high concentration in this mid-range bracket, where residents typically need moderate support with daily activities. |
37% Residents Age 85–94 — State Benchmarked 37% of residents are 85–94, compared to the Maryland average of 44%. The population here skews younger than the statewide norm, which may indicate a more active, lower-acuity community. |
14% Residents Age 95+ — State Benchmarked 14% of residents are 95 or older, compared to the Maryland average of 16%. In line with the statewide profile for the oldest resident bracket. |
| Seaton Silver Spring |
AL Assisted Living A licensed, long-term care setting for seniors or individuals with disabilities who need help with daily activities — like bathing, dressing, and medication management — but not 24-hour skilled nursing. Offers housing, meals, and around-the-clock support while aiming to maximize resident independence.
IL Independent Living Lifestyle-focused communities for older adults offering dining, activities, and transportation with minimal personal care. Best for active, independent seniors who want community without medical support.
RC Respite Care Short-term temporary care — days to weeks — to give family caregivers a break. Full care provided during the stay. Often used after hospitalization or to trial a facility before a permanent placement decision. | Silver Spring (Homecrest Road) | 55
Facility
55
MD AVG
43
Rank
#218 / 697 | Yes |
33
Facility
33
MD AVG
43
Rank
#597 / 985 | Private / Shared Rooms | 36
Facility
36
MD AVG
21
Rank
#16 / 208 |
15% Male Residents — State Benchmarked 15% of residents are male, compared to the Maryland average of 31%. This facility caters to a majority female resident pool (85% female), consistent with the broader assisted living trend where women significantly outnumber men. |
85% Female Residents — State Benchmarked 85% of residents are female, compared to the Maryland average of 69%. Women comprise the large majority, consistent with national assisted living demographics where women live longer and enter care facilities at higher rates. |
79% White Residents — State Benchmarked 79% of residents are reported as White, compared to the Maryland average of 81%. Close to the average for this category among assisted living facilities in Maryland with reported race/ethnicity data. |
21% African American Residents — State Benchmarked 21% of residents are reported as African American or Black, compared to the Maryland average of 13%. A higher African American share than the typical Maryland average — useful context when comparing cultural fit and community composition. |
0% Other Ethnicity Residents — State Benchmarked 0% of residents fall into categories other than White or African American (combined), compared to the Maryland average of 6%. This column aggregates Hispanic, Asian, multiracial, and any other labeled groups that are not classified as White or African American. |
9% Residents Age 65–74 — State Benchmarked 9% of residents are 65–74, compared to the Maryland average of 13%. Fewer younger seniors suggests the resident population skews older, likely requiring higher acuity care and more hands-on support. |
21% Residents Age 75–84 — State Benchmarked 21% of residents are 75–84, compared to the Maryland average of 31%. Below the state norm — the resident mix may skew either younger or older than this typical middle bracket. |
38% Residents Age 85–94 — State Benchmarked 38% of residents are 85–94, compared to the Maryland average of 44%. The population here skews younger than the statewide norm, which may indicate a more active, lower-acuity community. |
32% Residents Age 95+ — State Benchmarked 32% of residents are 95 or older, compared to the Maryland average of 16%. A high proportion of the oldest-old suggests strong end-of-life care experience and very-high-acuity capabilities. |
| CareVilla Briggs Chaney |
AL Assisted Living A licensed, long-term care setting for seniors or individuals with disabilities who need help with daily activities — like bathing, dressing, and medication management — but not 24-hour skilled nursing. Offers housing, meals, and around-the-clock support while aiming to maximize resident independence.
MC Memory Care Secured, specialized care for people living with Alzheimer's or dementia. Staff trained in cognitive impairment, with higher staff-to-resident ratios and an environment designed to reduce confusion and wandering risk.
PC Palliative Care
RC Respite Care Short-term temporary care — days to weeks — to give family caregivers a break. Full care provided during the stay. Often used after hospitalization or to trial a facility before a permanent placement decision. | Silver Spring | 5 Residents | No |
2
Facility
2
MD AVG
43
Rank
#940 / 985 | Private / Shared Rooms | - | - | - | - | - | - | - | - | - | - |
Frequently Asked Questions about CareVilla Briggs Chaney
Is CareVilla Briggs Chaney in a walkable area?
CareVilla Briggs Chaney has a walk score of 2. Car-dependent. Most errands require a car, with limited nearby walkable options.
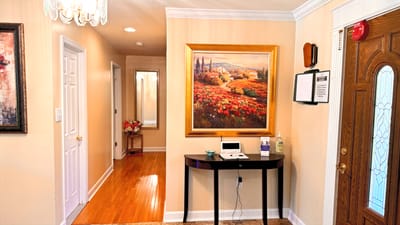
Are there photos of CareVilla Briggs Chaney?
Yes — there are 11 photos of CareVilla Briggs Chaney in the photo gallery on this page.
What is the address of CareVilla Briggs Chaney?
CareVilla Briggs Chaney is located at 1801 Briggs Chaney Road, Silver Spring, MD 20905.
What is the phone number of CareVilla Briggs Chaney?
(301) 384-2372 will put you in contact with the team at CareVilla Briggs Chaney.
Is CareVilla Briggs Chaney Medicare or Medicaid certified?
CareVilla Briggs Chaney is not currently listed as a CMS-certified provider of Medicare or Medicaid.
Guides for Better Senior Living
Care Cost Calculator: See Prices in Your Area
Nursing Home Data Explorer
Don’t Wait Too Long: 7 Red Flag Signs Your Parent Needs Assisted Living Now
The True Cost of Assisted Living in 2025 – And How Families Are Paying For It
Understanding Senior Living Costs: Pricing Models, Discounts & Financial Assistance
Contact Us

Updated on
Feedback
Write a review for CareVilla Briggs Chaney
Rate your overall experience with this community
Explore Open Rooms
1
Contact details
2
What type of senior care service are you looking for?
3
What budget do you have in mind for senior care?
4
How soon do you need to find care?
5
Additional details
Thank you for your interest!
Our team will be in touch shortly to help with next steps.
Need Help?
Let us help you or a loved one find the perfect senior home.
