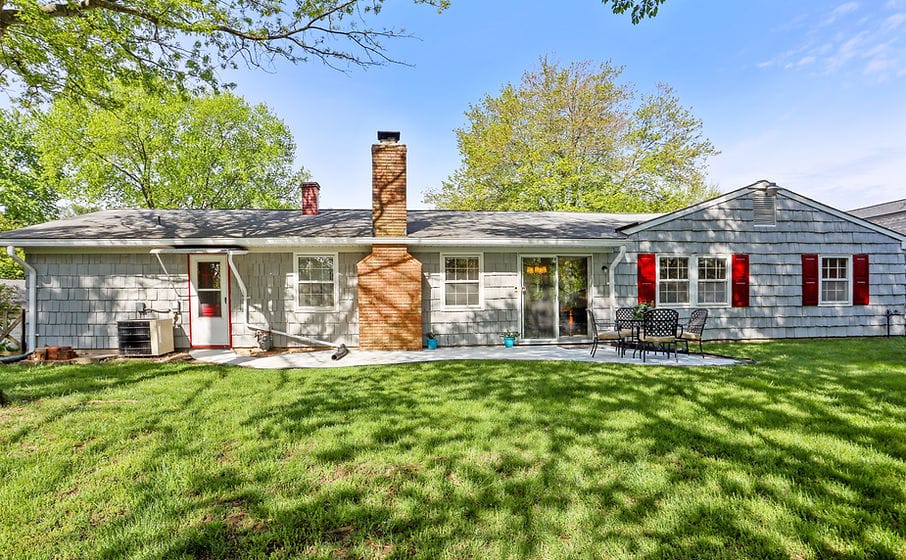
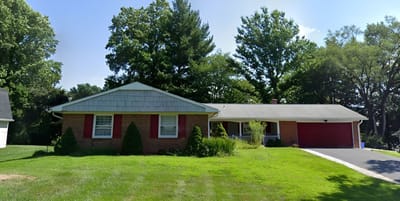
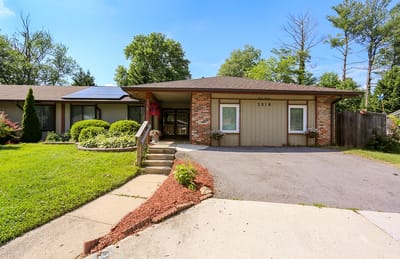
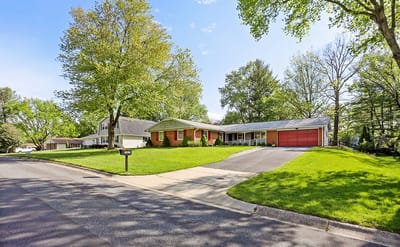
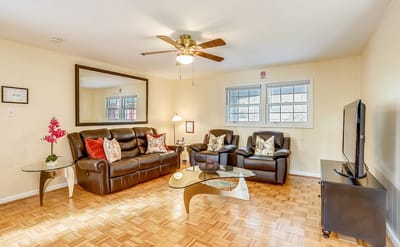
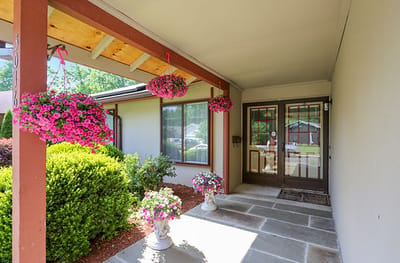
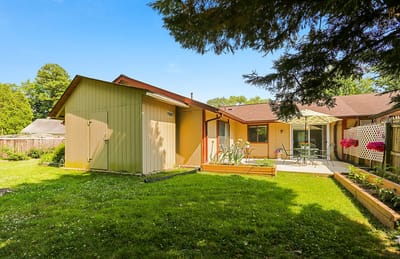
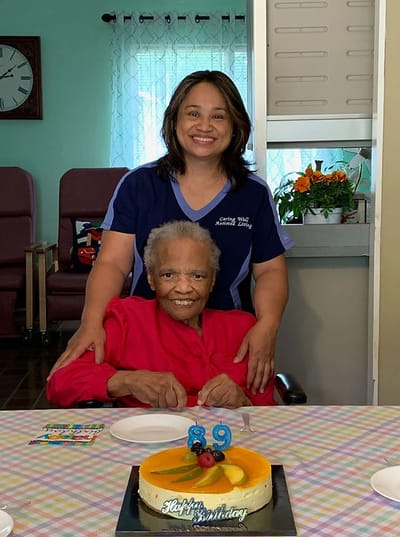

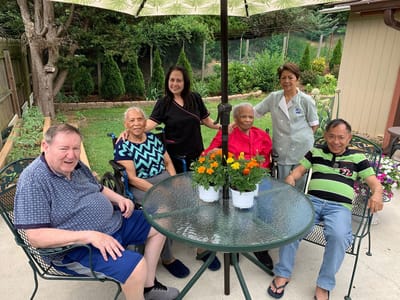
Smaller home · May offer a more intimate, personalized care environment.
Caring Well at Blazer Lane
Surrounded by convenient local amenities including Bel Pre Healthcare Center in Silver Spring, MD, Caring Well at Blazer Lane is an astounding community that offers assisted living. With its quaint and specially designed spaces, the community strives to accommodate up to five residents. A compassionate and highly trained team also cares for residents’ personal needs and other household responsibilities to ensure a maintenance-free lifestyle.
Empowering residents to remain socially engaged and active, the community conducts fun activities and engaging programs tailored to their leisure and wellness. Here, special diets are also accommodated with delightful and healthy meals for a satisfactory dining experience. Incontinence care, medication administration, and transportation services are provided for comfort and convenience. The community is a great choice for those who need assistance to live their day-to-day activities in retirement with its dedicated care and friendly environment.
Community insights.
About this community
What does this home offer?
No pets allowed
Housing Options: Private / Shared Rooms
Building Type: Single-story
Housekeeping Services
Recreational Activities
Places of interest near Caring Well at Blazer Lane
6.5 miles from city center
Estimated distance in miles from Silver Spring's city center to Caring Well at Blazer Lane's address, calculated via Google Maps.
Calculate Travel Distance to Caring Well at Blazer Lane
Add your location
Compare Assisted Living around Silver Spring
Info below is compiled from the MD Dept. of Health (OHCQ), senior community websites & trusted data sources such as Walk Score & BBB.
Communities are listed from highest to lowest based on our ranking methodology.
Care Types in This Table
AL (Assisted Living):
Housing with help for daily activities like bathing, dressing, and medication, without 24-hour skilled nursing.
NH (Nursing Home):
24/7 skilled nursing care for residents with complex, ongoing medical needs.
SNF (Skilled Nursing Facility):
Round-the-clock nursing care, often for recovery after surgery, injury, or illness.
MC (Memory Care):
Secured, specialized care for people living with Alzheimer's or dementia.
RC (Respite Care):
Short-term temporary care that gives family caregivers a break.
IL (Independent Living):
Community living with dining, activities, and transportation for active seniors who need little personal care.
HOS (Hospice Care):
Comfort-focused care for those with a terminal illness, prioritizing quality of life over treatment.
PC (Palliative Care):
Comfort-focused care for serious illness at any stage, including alongside curative treatment.
|
City and state of the facility. Used for mapping and state-average comparisons.
|
Licensed bed capacity (maximum allowed). Not the same as how many beds are currently filled.
|
Indicates whether residents are allowed to have pets in the facility.
|
Third-party neighborhood walkability score (0–100). Convenience/context metric, not a healthcare quality measure.
|
Description of bed or unit types offered (e.g. assisted living, memory care), as reported in state or facility disclosures.
|
Number of years the company has been in operation.
|
Percentage of residents reported as male in state demographics, shown as a whole-number percent.
|
Percentage of residents reported as female in state demographics, shown as a whole-number percent.
|
Share of residents reported as White in the state-published race/ethnicity breakdown for this facility, shown as a whole-number percent. Parsed from the same source as the profile demographics section.
|
Share of residents reported as African American or Black in the state breakdown, shown as a whole-number percent. Labels in the raw data are normalized to this bucket for compare.
|
Combined share of all race/ethnicity groups that are not classified as White or African American (e.g. Hispanic, Asian, multiracial, and other labeled categories), summed to a single whole-number percent.
|
Share of residents aged 65–74 in reported demographics, as a whole-number percentage of residents.
|
Share of residents aged 75–84 in reported demographics, as a whole-number percentage of residents.
|
Share of residents aged 85–94 in reported demographics, as a whole-number percentage of residents.
|
Share of residents aged 95 or older in reported demographics, as a whole-number percentage of residents.
| |
|---|---|---|---|---|---|---|---|---|---|---|---|---|---|---|---|---|
| Sunrise of Chevy Chase | AL MC | Silver Spring (Rock Creek Gardens) | 196
Facility
196
MD AVG
42
Rank
#10 / 684 | No |
71
Facility
71
MD AVG
45
Rank
#175 / 953 | Studio / 1 Bed / 2 Bed | 8
Facility
8
MD AVG
21
Rank
#164 / 210 |
58% Male Residents — State Benchmarked 58% of residents are male, compared to the Maryland average of 31%. An unusually high male share for assisted living, where most facilities skew heavily female. |
42% Female Residents — State Benchmarked 42% of residents are female, compared to the Maryland average of 69%. An unusually low female share — most assisted living facilities have 65–75% female residents. |
69% White Residents — State Benchmarked 69% of residents are reported as White, compared to the Maryland average of 81%. A lower White share than the Maryland average — the community may draw a more diverse resident mix relative to other facilities in Maryland. |
28% African American Residents — State Benchmarked 28% of residents are reported as African American or Black, compared to the Maryland average of 13%. A higher African American share than the typical Maryland average — useful context when comparing cultural fit and community composition. |
3% Other Ethnicity Residents — State Benchmarked 3% of residents fall into categories other than White or African American (combined), compared to the Maryland average of 6%. This column aggregates Hispanic, Asian, multiracial, and any other labeled groups that are not classified as White or African American. Reported subgroups in this total: Hispanic (2%), Asian (1%). |
12% Residents Age 65–74 — State Benchmarked 12% of residents are 65–74, compared to the Maryland average of 13%. In line with the statewide profile for this youngest senior bracket in assisted living. |
39% Residents Age 75–84 — State Benchmarked 39% of residents are 75–84, compared to the Maryland average of 31%. A high concentration in this mid-range bracket, where residents typically need moderate support with daily activities. |
42% Residents Age 85–94 — State Benchmarked 42% of residents are 85–94, compared to the Maryland average of 44%. This is typically the most common age bracket in assisted living — this facility is in line with the statewide norm. |
6% Residents Age 95+ — State Benchmarked 6% of residents are 95 or older, compared to the Maryland average of 16%. Most residents here have not yet reached the oldest-old bracket, suggesting a younger overall community. |
| Sunrise of Silver Spring | AL HOS MC RC | Silver Spring | 84
Facility
84
MD AVG
42
Rank
#159 / 684 | Yes |
40
Facility
40
MD AVG
45
Rank
#523 / 953 | Studio / 1 Bed / 2 Bed | 24
Facility
24
MD AVG
21
Rank
#93 / 210 |
31% Male Residents — State Benchmarked 31% of residents are male, compared to the Maryland average of 31%. This facility caters to a majority female resident pool (69% female), consistent with the broader assisted living trend where women significantly outnumber men. |
69% Female Residents — State Benchmarked 69% of residents are female, compared to the Maryland average of 69%. Women comprise the large majority, consistent with national assisted living demographics where women live longer and enter care facilities at higher rates. |
53% White Residents — State Benchmarked 53% of residents are reported as White, compared to the Maryland average of 81%. A lower White share than the Maryland average — the community may draw a more diverse resident mix relative to other facilities in Maryland. |
39% African American Residents — State Benchmarked 39% of residents are reported as African American or Black, compared to the Maryland average of 13%. A higher African American share than the typical Maryland average — useful context when comparing cultural fit and community composition. |
9% Other Ethnicity Residents — State Benchmarked 9% of residents fall into categories other than White or African American (combined), compared to the Maryland average of 6%. This column aggregates Hispanic, Asian, multiracial, and any other labeled groups that are not classified as White or African American. Reported subgroups in this total: Asian (4%), Hawaiian/Pacific Islander (3%), Hispanic (1%). |
4% Residents Age 65–74 — State Benchmarked 4% of residents are 65–74, compared to the Maryland average of 13%. Fewer younger seniors suggests the resident population skews older, likely requiring higher acuity care and more hands-on support. |
43% Residents Age 75–84 — State Benchmarked 43% of residents are 75–84, compared to the Maryland average of 31%. A high concentration in this mid-range bracket, where residents typically need moderate support with daily activities. |
37% Residents Age 85–94 — State Benchmarked 37% of residents are 85–94, compared to the Maryland average of 44%. The population here skews younger than the statewide norm, which may indicate a more active, lower-acuity community. |
14% Residents Age 95+ — State Benchmarked 14% of residents are 95 or older, compared to the Maryland average of 16%. In line with the statewide profile for the oldest resident bracket. |
| Bedford Court, a CCRC | AL HOS IL MC NH RC SNF | Silver Spring | 76
Facility
76
MD AVG
42
Rank
#173 / 684 | Yes |
64
Facility
64
MD AVG
45
Rank
#261 / 953 | Studio / 1 Bed | 34
Facility
34
MD AVG
21
Rank
#22 / 210 |
15% Male Residents — State Benchmarked 15% of residents are male, compared to the Maryland average of 31%. This facility caters to a majority female resident pool (85% female), consistent with the broader assisted living trend where women significantly outnumber men. |
85% Female Residents — State Benchmarked 85% of residents are female, compared to the Maryland average of 69%. Women comprise the large majority, consistent with national assisted living demographics where women live longer and enter care facilities at higher rates. |
95% White Residents — State Benchmarked 95% of residents are reported as White, compared to the Maryland average of 81%. A higher White share than is typical for assisted living in Maryland in this dataset — compare with peer facilities for local context. |
3% African American Residents — State Benchmarked 3% of residents are reported as African American or Black, compared to the Maryland average of 13%. A lower African American share than is typical in Maryland; local markets still vary widely. |
2% Other Ethnicity Residents — State Benchmarked 2% of residents fall into categories other than White or African American (combined), compared to the Maryland average of 6%. This column aggregates Hispanic, Asian, multiracial, and any other labeled groups that are not classified as White or African American. Reported subgroups in this total: Asian (2%). |
2% Residents Age 65–74 — State Benchmarked 2% of residents are 65–74, compared to the Maryland average of 13%. Fewer younger seniors suggests the resident population skews older, likely requiring higher acuity care and more hands-on support. |
8% Residents Age 75–84 — State Benchmarked 8% of residents are 75–84, compared to the Maryland average of 31%. Below the state norm — the resident mix may skew either younger or older than this typical middle bracket. |
65% Residents Age 85–94 — State Benchmarked 65% of residents are 85–94, compared to the Maryland average of 44%. A high concentration of very elderly residents signals a higher-acuity facility with experience caring for advanced age-related needs. |
26% Residents Age 95+ — State Benchmarked 26% of residents are 95 or older, compared to the Maryland average of 16%. A high proportion of the oldest-old suggests strong end-of-life care experience and very-high-acuity capabilities. |
| Bedford Court | AL HOS IL MC NH RC SNF | Silver Spring | 76
Facility
76
MD AVG
42
Rank
#173 / 684 | Yes |
66
Facility
66
MD AVG
45
Rank
#240 / 953 | Studio / 1 Bed / 2 Bed | 34
Facility
34
MD AVG
21
Rank
#22 / 210 |
15% Male Residents — State Benchmarked 15% of residents are male, compared to the Maryland average of 31%. This facility caters to a majority female resident pool (85% female), consistent with the broader assisted living trend where women significantly outnumber men. |
85% Female Residents — State Benchmarked 85% of residents are female, compared to the Maryland average of 69%. Women comprise the large majority, consistent with national assisted living demographics where women live longer and enter care facilities at higher rates. |
95% White Residents — State Benchmarked 95% of residents are reported as White, compared to the Maryland average of 81%. A higher White share than is typical for assisted living in Maryland in this dataset — compare with peer facilities for local context. |
3% African American Residents — State Benchmarked 3% of residents are reported as African American or Black, compared to the Maryland average of 13%. A lower African American share than is typical in Maryland; local markets still vary widely. |
2% Other Ethnicity Residents — State Benchmarked 2% of residents fall into categories other than White or African American (combined), compared to the Maryland average of 6%. This column aggregates Hispanic, Asian, multiracial, and any other labeled groups that are not classified as White or African American. Reported subgroups in this total: Asian (2%). |
2% Residents Age 65–74 — State Benchmarked 2% of residents are 65–74, compared to the Maryland average of 13%. Fewer younger seniors suggests the resident population skews older, likely requiring higher acuity care and more hands-on support. |
8% Residents Age 75–84 — State Benchmarked 8% of residents are 75–84, compared to the Maryland average of 31%. Below the state norm — the resident mix may skew either younger or older than this typical middle bracket. |
65% Residents Age 85–94 — State Benchmarked 65% of residents are 85–94, compared to the Maryland average of 44%. A high concentration of very elderly residents signals a higher-acuity facility with experience caring for advanced age-related needs. |
26% Residents Age 95+ — State Benchmarked 26% of residents are 95 or older, compared to the Maryland average of 16%. A high proportion of the oldest-old suggests strong end-of-life care experience and very-high-acuity capabilities. |
| Caring Well at Blazer Lane | AL MC PC RC | Silver Spring | 5
Facility
5
MD AVG
42
Rank
#423 / 684 | No |
25
Facility
25
MD AVG
45
Rank
#685 / 953 | Private / Shared Rooms | - | - | - | - | - | - | - | - | - | - |
Financial Assistance for
Assisted Living in Maryland
Caring Well at Blazer Lane is located in Silver Spring, Maryland.
Here are the financial assistance programs available to residents in Maryland.
Frequently Asked Questions about Caring Well at Blazer Lane
Is Caring Well at Blazer Lane in a walkable area?
Caring Well at Blazer Lane has a walk score of 25. Somewhat walkable. A few nearby services may be reachable on foot, but most trips require transportation.
Are pets allowed at Caring Well at Blazer Lane?
No, Caring Well at Blazer Lane has a no-pet policy.
How many beds does Caring Well at Blazer Lane have?
Caring Well at Blazer Lane has 5 beds.
Are there photos of Caring Well at Blazer Lane?
Yes — there are 10 photos of Caring Well at Blazer Lane in the photo gallery on this page.
What is the address of Caring Well at Blazer Lane?
Caring Well at Blazer Lane is located at 14017 Blazer Lane, Silver Spring, MD 20906.
What is the phone number of Caring Well at Blazer Lane?
(855) 866-7689 will put you in contact with the team at Caring Well at Blazer Lane.
What county is Caring Well at Blazer Lane located in?
Caring Well at Blazer Lane is in Prince George's County.
Guides for Better Senior Living
Care Cost Calculator: See Prices in Your Area
Assisted Living Explorer
Don’t Wait Too Long: 7 Red Flag Signs Your Parent Needs Assisted Living Now
The True Cost of Assisted Living in 2025 – And How Families Are Paying For It
Understanding Senior Living Costs: Pricing Models, Discounts & Financial Assistance