• Home
  • Nursing Home in Kentucky
Carmel Manor
Nursing Home, Memory Care, Nursing Care & Respite Care · Fort Thomas, KY
CMS overall rating Info CMS (the Centers for Medicare & Medicaid Services) is the federal agency that rates nursing home quality. Its Overall Rating runs from 1 to 5 stars, combining health inspections, staffing, and quality measures, with inspections weighted most heavily.
  • Home
  • USA
  • Nursing Home in Kentucky

Carmel Manor

Nursing Home, Memory Care, Nursing Care & Respite Care · Fort Thomas, KY
CMS overall rating Info CMS (the Centers for Medicare & Medicaid Services) is the federal agency that rates nursing home quality. Its Overall Rating runs from 1 to 5 stars, combining health inspections, staffing, and quality measures, with inspections weighted most heavily.
Calculator: See prices in your area
Carmel Manor accepts Medicare, Medicaid, and private pay.

Overview of Carmel Manor

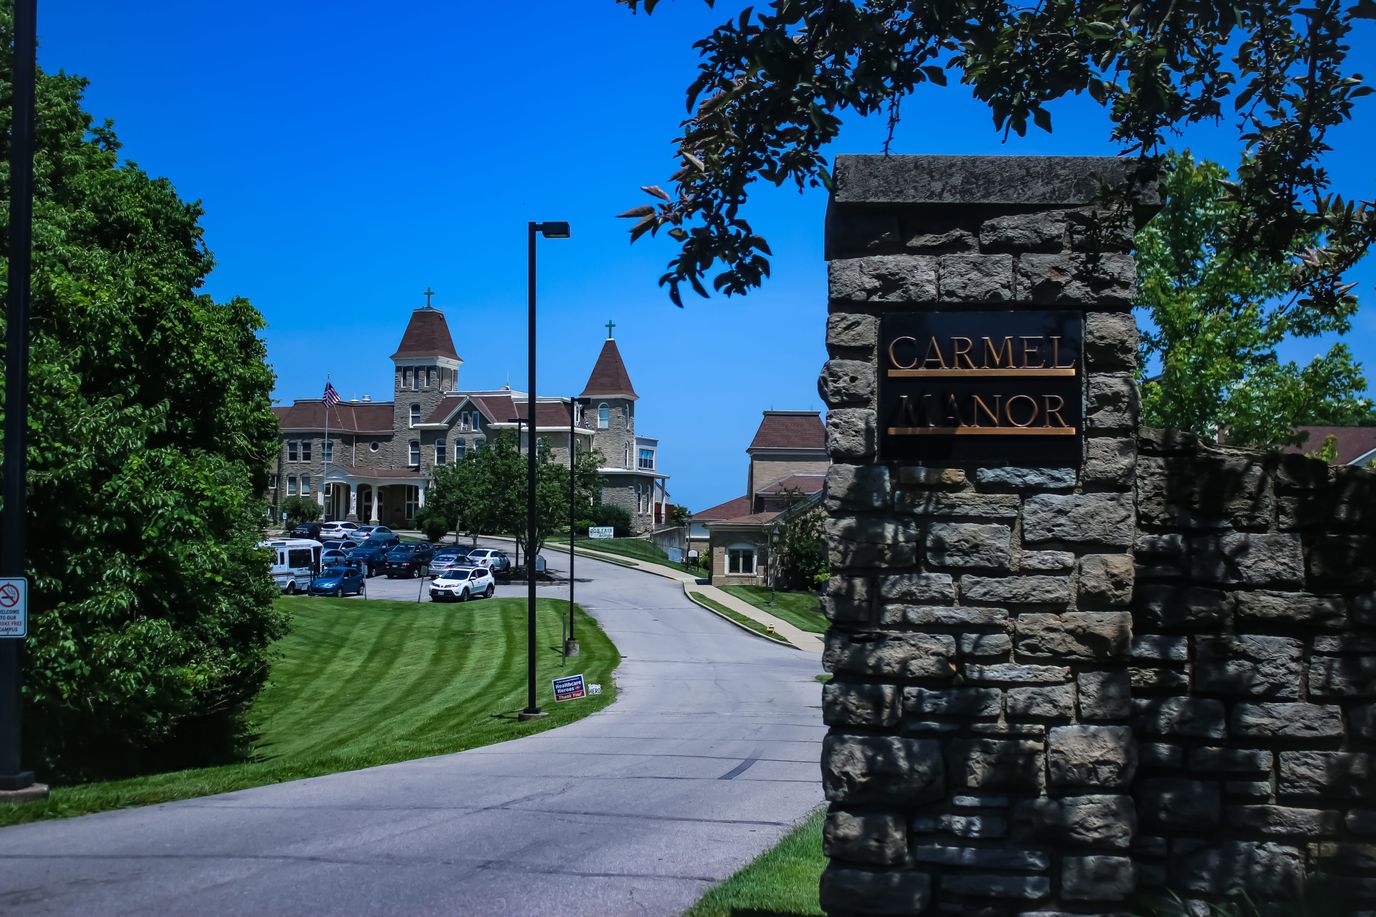
Carmel Manor is a 175-bed skilled nursing, memory care, and personal care community in Fort Thomas, Kentucky, offering skilled nursing, short-term rehabilitation, memory care, personal care, and respite services. The facility is operated by The Carmelite Sisters For The Aged And Infirm, a voluntary nonprofit organization. It accepts Medicare, Medicaid, and private pay. Carmel Manor holds a 1-star CMS overall rating, driven by its Health Inspection score, which ranks in the bottom fifth of Kentucky’s 186 rated skilled nursing facilities. Across inspections since 2019, the facility accumulated 37 total health citations — nearly three times the Kentucky average of 13.5 — including 7 critical and 4 serious citations; a May 2025 follow-up visit confirmed substantial compliance with the accepted plan of correction. CMS assessed $312,000 in civil money penalties, anchored by a $292,000 fine in July 2025 associated with three critical abuse-and-neglect citations, as well as a four-day payment denial in March 2025. Staffing is the facility’s clearest counterpoint: nurse staffing averages 4 hours and 34 minutes per resident per day, 32% above the Kentucky average, earning a 4-star CMS staffing rating and a top-20 statewide rank out of 184 facilities. The facility’s occupancy rate is 54% — well below Kentucky’s average of 81.3% — indicating current bed availability. Private pay accounts for 67% of admissions, with an average length of stay near 200 days. Carmel Manor’s rehabilitation services, above-average nursing staff hours, and current availability make it well-suited to short-term post-acute stays and personal care placements in Campbell County. However, families should review the facility’s inspection history, abuse-related citations, and federal penalties before making a placement decision.

Quality ratings

Measured by Centers for Medicare & Medicaid Services (CMS)

Overall rating Info The Overall CMS Rating combines results from health inspections, staffing levels and quality measures. Health inspections carry the most weight. Staffing and quality scores can increase or decrease the final rating based on performance compared to state and national standards.
Health Inspection Info Based on the results of the facility's three most recent standard inspections and any complaint investigations. CMS reviews the number, scope, and severity of deficiencies, with more recent findings weighted more heavily.
Staffing Info Measures average nursing staff hours per resident per day, including Registered Nurses (RNs) and total nursing staff. Ratings are adjusted based on the level of care residents require and are compared to state and national benchmarks.
Quality Measures Info Based on clinical and physical health indicators reported to CMS, such as hospital readmissions, falls, pressure ulcers, and improvements in mobility. These measures reflect how well residents' health needs are being managed.

Staffing hours breakdown

Info Daily nursing hours per resident by staff type, reported to CMS. Higher is generally better — compare this facility to state and national averages to see where staffing stands.

Hours per resident per day — compared to state averages

Total nursing care / resident Info Total adjusted nursing hours per resident per day, combining RN, LPN, and aide time. CMS adjusts this for case-mix so facilities can be fairly compared.
4h 34m per day
Rank #18 / 193Nurse hours — State benchmarkedThis home is ranked 18th out of 193 homes in Kentucky. Shows adjusted nurse hours per resident per day benchmarked to the Kentucky average, with a ranking across 193 Kentucky facilities. More hours mean more direct care. The national average is about 3.5 hrs; below 3.0 is a red flag.Rankings are based only on facilities in Kentucky that report data for that category. Facilities without available data are excluded from the ranking.Click the rank badge to see the full State ranking.Click here to see the full State ranking.
vs avg
Staff type Hours / Day / Resident vs state avg
Registered Nurse (RN) Info RNs hold the highest nursing license and can assess residents, interpret test results, and direct care plans. More RN hours per day often signals stronger clinical oversight and faster response to health changes. 46m per day
LPN / LVN Info Licensed Practical Nurses (LPNs) or Licensed Vocational Nurses (LVNs) deliver routine hands-on care — medication administration, wound dressing, and monitoring vital signs. They work under RN supervision and make up a large share of daily bedside care. 1h 2m per day
Nurse Aide Info Certified Nurse Aides (CNAs) provide the most direct day-to-day assistance: bathing, dressing, feeding, and mobility. Nurse aide hours are typically the largest staffing category and directly affect residents' quality of life. 2h 34m per day
Weekend Total Nursing Info Combined nursing hours (RN + LPN + Nurse Aide) per resident per day on weekends. Staffing often drops on weekends — this figure reveals whether the facility maintains adequate coverage outside of weekday hours. 4h 7m per day
Physical Therapist Info Hours per resident per day provided by licensed Physical Therapists (PTs) or PT Assistants. PT services help residents recover mobility after injury or illness and are especially important for post-acute (short-stay) rehabilitation. 4m per day
Weekend RN Info Registered nurse hours specifically on weekends. Facilities sometimes reduce RN presence on Saturdays and Sundays — a low weekend RN figure compared to weekday hours can indicate reduced clinical oversight when most administrative staff are absent. 30m per day

Capacity and availability

Avg. Length of Stay
197 days
Bed community size
175-bed community Rank #12 / 341Bed count — State benchmarkedThis home is ranked 12th out of 341 homes in Kentucky. Shows this facility's certified or reported bed count compared to other Kentucky facilities. Larger communities may offer more amenities, programs, and on-site services for residents and families.Rankings are based only on facilities in Kentucky that report data for that category. Facilities without available data are excluded from the ranking.Click the rank badge to see the full State ranking.Click here to see the full State ranking.
A large-scale community that may provide a wide range of amenities, services, and structured programs.
Years in operation
1 year in operation Rank #53 / 149Years in operation — State benchmarkedThis home is ranked 53rd out of 149 homes in Kentucky. Shows how long this facility has been in operation compared to other Kentucky facilities. Longer operating histories may benefit residents, families, and staff.Rankings are based only on facilities in Kentucky that report data for that category. Facilities without available data are excluded from the ranking.Click the rank badge to see the full State ranking.Click here to see the full State ranking.
A newer community that may feature more recent facilities and programs.
Walk Score
Walk Score: 34 / 100 Rank #261 / 423Walk Score — State benchmarkedThis home is ranked 261st out of 423 homes in Kentucky. Shows how walkable this facility's neighborhood is compared to the average Walk Score across Kentucky facilities. Higher scores benefit residents, families, and staff.Rankings are based only on facilities in Kentucky that report data for that category. Facilities without available data are excluded from the ranking.Click the rank badge to see the full State ranking.Click here to see the full State ranking.
Somewhat walkable. A few nearby services may be reachable on foot, but most trips require transportation.

About this community

Occupancy

Occupancy rate
54%
Rank #195 / 209Occupancy rate — State benchmarkedThis home is ranked 195th out of 209 homes in Kentucky. Shows this facility's occupancy rate versus the Kentucky average, with its Statewide rank out of 209. Higher occupancy signals strong local demand and financial stability.Rankings are based only on facilities in Kentucky that report data for that category. Facilities without available data are excluded from the ranking.Click the rank badge to see the full State ranking.Click here to see the full State ranking.
Lower than the Kentucky average: 81.3%
Occupied beds
94 / 175
Average occupied beds in Kentucky homes 80 beds

License Details

Facility TypeLong Term Care (nursing Facility, Personal Care)
StatusActive
IssuanceJanuary 1, 2025
CountyCampbell
License Number100056
CMS Certification Number185208

Ownership & Operating Entity

Carmel Manor is administered by Jena Quinn-Sexton.

Owner NameCarmel Manor

Therapy & Rehabilitation

2 services
Rehabilitation Services
Short-Term Rehab

Additional Services

2 services
Personal Care
Rehab

Contact Carmel Manor

Inspection History

In Kentucky, the Cabinet for Health and Family Services, Office of Inspector General is the regulatory authority that conducts inspections and investigates complaints in all long-term care homes.

Since 2025 · 1 year of data

Health Inspection History

Inspections since 2019
Total health inspections 5

State average N/A


Last Health inspection on Jul 2025

Total health citations
37 Rank #190 / 195Health citations — State benchmarkedThis home is ranked 190th out of 195 homes in Kentucky. Shows this facility's total health deficiency citations benchmarked to the Kentucky State average, with a ranking across all 195 KY facilities. Lower citation counts earn a better rank.Rankings are based only on facilities in Kentucky that report data for that category. Facilities without available data are excluded from the ranking.Click the rank badge to see the full State ranking.Click here to see the full State ranking.

State average N/A

Citations per inspection
7.4 Rank #174 / 195Citations per inspection — State benchmarkedThis home is ranked 174th out of 195 homes in Kentucky. Shows average deficiency citations per CMS inspection for this facility versus the Kentucky mean across 195 facilities with citation data. Lower is better.Rankings are based only on facilities in Kentucky that report data for that category. Facilities without available data are excluded from the ranking.Click the rank badge to see the full State ranking.Click here to see the full State ranking.

State average N/A


Health citations are formal notices following inspections when they fail to comply with safety and care standards.

16 of 37 citations resulted from standard inspections; and 21 of 37 resulted from complaint investigations.

Breakdown of citation severity (last 7 years)
Critical health citations
7
In line with State average

State average: N/A


Serious health citations
4
In line with State average

State average: N/A

7 critical citations State average: N/A

4 serious citations State average: N/A

26 moderate citations State average: N/A

0 minor citations State average: N/A
Citations history (last 7 years)
Abuse/Neglect critical citation Jul 24, 2025
Corrected

Abuse/Neglect critical citation Jul 24, 2025
Corrected

Abuse/Neglect critical citation Jul 24, 2025
Corrected

Administration critical citation Jul 24, 2025
Corrected

Staffing Data

Reporting period: October 1 – December 31, 2025 (Q4 2025). Source: CMS Payroll-Based Journal report.

Total staff 292
Employees 117
Contractors 175
Staff to resident ratio 3.60 : 1
0% compared with State average

State average ratio: 0 : 0

Avg staff/day 48
Average shift 8.5 hours
0% compared with State average

State average: 0 hours

Total staff hours (quarter) 37,716

Nursing staff breakdown

Q4 2025 · Oct 1 – Dec 31 More info This data comes from the CMS Payroll-Based Journal report covering October 1 – December 31, 2025.
Registered Nurse

Manages medical care and health needs.

RN Staff Info 16 total: 12 full-time employees and 4 contractors. 16
Average shift length Info Average shift length. Calculated as total hours divided by days worked and average staff per day. 9.3 hours
Licensed Practical Nurse

Assists with medical care and medications.

LPN Staff Info 63 total: 22 full-time employees and 41 contractors. 63
Average shift length Info Average shift length. Calculated as total hours divided by days worked and average staff per day. 9.1 hours
Certified Nursing Assistant

Helps with daily care and mobility.

CNA Staff Info 182 total: 52 full-time employees and 130 contractors. 182
Average shift length Info Average shift length. Calculated as total hours divided by days worked and average staff per day. 8.9 hours

Contractor staffing

Q4 2025 · Oct 1 – Dec 31 More info This data comes from the CMS Payroll-Based Journal report covering October 1 – December 31, 2025.

Total hours from contractors

18.5%

6,992 contractor hours this quarter

Certified Nursing Assistant: 130 Licensed Practical Nurse: 41 Registered Nurse: 4

Staff by category

Q4 2025 · Oct 1 – Dec 31 More info This data comes from the CMS Payroll-Based Journal report covering October 1 – December 31, 2025.
Certified Nursing Assistant 52 130 182 19,486 92 100% 8.9
Licensed Practical Nurse 22 41 63 8,019 92 100% 9.1
Registered Nurse 12 4 16 2,755 91 99% 9.3
Clinical Nurse Specialist 6 0 6 2,604 90 98% 8
Other Dietary Services Staff 3 0 3 704 73 79% 6.7
Qualified Social Worker 3 0 3 538 65 71% 6.1
Mental Health Service Worker 2 0 2 520 60 65% 6.8
Administrator 1 0 1 512 64 70% 8
Nurse Practitioner 1 0 1 512 64 70% 8
Dietitian 1 0 1 512 64 70% 8
Respiratory Therapy Technician 3 0 3 463 63 68% 6.3
Respiratory Therapist 1 0 1 437 60 65% 7.3
Physical Therapy Assistant 4 0 4 322 57 62% 4.8
Medication Aide/Technician 4 0 4 255 46 50% 5.3
Occupational Therapy Aide 1 0 1 71 11 12% 6.5
Therapeutic Recreation Specialist 1 0 1 7 2 2% 3.7
182 Certified Nursing Assistant
% of Days 100%
63 Licensed Practical Nurse
% of Days 100%
16 Registered Nurse
% of Days 99%
6 Clinical Nurse Specialist
% of Days 98%
3 Other Dietary Services Staff
% of Days 79%
3 Qualified Social Worker
% of Days 71%
2 Mental Health Service Worker
% of Days 65%
1 Administrator
% of Days 70%
1 Nurse Practitioner
% of Days 70%
1 Dietitian
% of Days 70%
3 Respiratory Therapy Technician
% of Days 68%
1 Respiratory Therapist
% of Days 65%
4 Physical Therapy Assistant
% of Days 62%
4 Medication Aide/Technician
% of Days 50%
1 Occupational Therapy Aide
% of Days 12%
1 Therapeutic Recreation Specialist
% of Days 2%

Penalties and fines

Includes penalties issued in 2025

Federal penalties imposed by CMS for regulatory violations, including civil money penalties (fines) and denials of payment for new Medicare/Medicaid admissions.

Source: CMS Penalties Database (Data as of Jan 2026)

Total fines amount $312K Rank #196 / 199Federal fines — State benchmarkedThis home is ranked 196th out of 199 homes in Kentucky. Shows this facility's cumulative CMS federal fine dollars versus the Kentucky average among facilities with fines, and where it ranks among 199 facilities in the pool. Lower total dollars mean a better rank.Rankings are based only on facilities in Kentucky that report data for that category. Facilities without available data are excluded from the ranking.Click the rank badge to see the full State ranking.Click here to see the full State ranking.
395% higher than State average

State average: $63K

Number of fines 3
30% more fines than State average

State average: 2.3

Payment Denials Info Serious action where Medicare and/or Medicaid temporarily stops payments for new residents until issues are fixed. 1
206% more payment denials than State average

State average: 0.3

Fines amount comparison
This facility $312K
State average $63K
Penalty History

Penalties are imposed by CMS for violations of federal nursing home regulations.

4 penalties in the past 3 years

Multiple penalties were reported in the last 3 years.

Civil Money Penalty Info Fines imposed for noncompliance, which can be assessed per day or per instance of violation. Jul 24, 2025
$292K
Civil Money Penalty Info Fines imposed for noncompliance, which can be assessed per day or per instance of violation. Mar 15, 2025
$10K
Civil Money Penalty Info Fines imposed for noncompliance, which can be assessed per day or per instance of violation. Mar 15, 2025
$10K
Payment Denial Info Serious action where Medicare and/or Medicaid temporarily stops payments for new residents until issues are fixed. Mar 15, 2025
4 days

Last updated: Jan 2026

Quality of care over time

These measures show how residents usually do over time at this home, based on health outcomes and preventive care.

High-risk clinical events score Info A composite score based on pressure ulcers, falls with injury, weight loss, walking ability decline, and activities of daily living decline. 15.1
44% worse than State average

State average: 10.5

Functional decline score Info A composite score based on activities of daily living decline, walking ability decline, and incontinence. 32.7
73% worse than State average

State average: 18.9

Long-stay resident measures
Need for Help with Daily Activities Increased Info Percent of long-stay residents whose need for help with daily activities has increased 28.4%
69% worse than State average

State average: 16.8%

Walking Ability Worsened Info Percent of long-stay residents whose ability to move independently worsened 30.4%
55% worse than State average

State average: 19.6%

Low Risk Residents with Bowel/Bladder Incontinence Info Percent of low risk long-stay residents who lose control of their bowels or bladder 39.4%
92% worse than State average

State average: 20.5%

Falls with Major Injury Info Percent of long-stay residents experiencing one or more falls with major injury 3.6%
In line with State average

State average: 3.8%

High Risk Residents with Pressure Ulcers Info Percent of long-stay high risk residents with pressure ulcers 4.3%
26% better than State average

State average: 5.8%

Urinary Tract Infection Info Percent of long-stay residents with a urinary tract infection 1.9%
In line with State average

State average: 1.9%

Lost Too Much Weight Info Percent of long-stay residents who lose too much weight 8.6%
27% worse than State average

State average: 6.8%

Depressive Symptoms Info Percent of long-stay residents who have depressive symptoms 4.1%
71% better than State average

State average: 14.3%

Antipsychotic Use Info Percent of long-stay residents who received an antipsychotic medication 11.8%
24% better than State average

State average: 15.6%

Pneumococcal Vaccine Info Percent of long-stay residents assessed and appropriately given the pneumococcal vaccine 98.8%
5% better than State average

State average: 93.9%

Influenza Vaccine Info Percent of long-stay residents assessed and appropriately given the seasonal influenza vaccine 100.0%
In line with State average

State average: 96.2%

Short-stay resident measures
Pneumococcal Vaccine Info Percent of short-stay residents assessed and appropriately given the pneumococcal vaccine 99.0%
18% better than State average

State average: 83.7%

Antipsychotic medication increase Info Percent of short-stay residents who newly received an antipsychotic medication 4.6%
135% worse than State average

State average: 1.9%

Influenza Vaccine Info Percent of short-stay residents assessed and appropriately given the seasonal influenza vaccine 86.1%
In line with State average

State average: 83.6%

Breakdown by payment type

Medicare

19% of new residents, usually for short-term rehab.

Typical stay 1 - 2 months

Private pay

67% of new residents, often for short stays.

Typical stay 4 - 5 months

Medicaid

14% of new residents, often for long-term daily care.

Typical stay 1 - 2 years

Facility Characteristics

Source: CMS Long-Term Care Facility Characteristics (Data as of Jan 2026)

Total residents 81
Medicare
3
3.7% of residents
Medicaid
56
69.1% of residents
Private pay or other
22
27.2% of residents
Programs & Services
Residents Group

Residents meet regularly to discuss policies, care quality, and activities

Active Resident Council

Organized group of residents that meets regularly to discuss facility policies, quality of life, and activities.

Finances and operations

Based on CMS SNF Cost Report for fiscal year ending in 12/2023.

Nonprofit
Nonprofit Corporation
Net patient revenue Info Net patient revenue — what the home actually collects for resident care, after contractual allowances, bad debt and discounts are subtracted from its gross charges (CMS cost report, Worksheet G-3). It covers resident care only; money the home earns from other sources is shown separately as "Other income."
$10.6M
Net patient income Info Net patient income: net patient revenue minus the home's total operating expenses. A positive figure means it earns more from resident care than it spends to deliver it; a negative figure means the opposite. It excludes non-operating "other income."
-$4.6M
Nonprofit Nonprofit Corporation
Net patient revenue Info Net patient revenue — what the home actually collects for resident care, after contractual allowances, bad debt and discounts are subtracted from its gross charges (CMS cost report, Worksheet G-3). It covers resident care only; money the home earns from other sources is shown separately as "Other income."
$10.6M Rank #56 / 197Revenue — State benchmarkedThis home is ranked 56th out of 197 homes in Kentucky. Shows this facility's annual revenue compared to the Kentucky average. Higher revenue generally means more resources for staffing and capital — read alongside Payroll %.Rankings are based only on facilities in Kentucky that report data for that category. Facilities without available data are excluded from the ranking.Click the rank badge to see the full State ranking.Click here to see the full State ranking.
Net patient income Info Net patient income: net patient revenue minus the home's total operating expenses. A positive figure means it earns more from resident care than it spends to deliver it; a negative figure means the opposite. It excludes non-operating "other income."
-$4.6M
Other income Info Money the home earns outside of resident care — such as investments, grants, rentals and other non-operating sources (CMS cost report, Worksheet G-3). It is tracked separately from net patient revenue: it is not part of that figure, and it is not included in net patient income.
$158.7K
Payroll costs Info Staff salaries plus wage-related costs — benefits such as payroll taxes, health insurance and retirement — from the home's own accounting records (CMS cost report, Worksheet A). Contract or agency labor is counted separately, under other operating costs. Rank #15 / 197Payroll — State benchmarkedThis home is ranked 15th out of 197 homes in Kentucky. Shows total annual staff payroll benchmarked to the Kentucky average. Higher payroll investment relative to peers often signals better staffing and less reliance on cheaper contract labor.Rankings are based only on facilities in Kentucky that report data for that category. Facilities without available data are excluded from the ranking.Click the rank badge to see the full State ranking.Click here to see the full State ranking.
$4.7M 44.7% of net patient revenue Info Payroll as a share of revenue: staff salaries and wage-related benefits divided by net patient revenue. A higher figure means more of each revenue dollar goes to staff pay. Rank #11 / 197Payroll % — State benchmarkedThis home is ranked 11th out of 197 homes in Kentucky. Shows payroll as a percentage of revenue versus the Kentucky average. Well-run Kentucky facilities typically land around 51–61% — the top third Statewide. Below 25% may signal understaffing or heavy agency use — read with Staffing ratings.Rankings are based only on facilities in Kentucky that report data for that category. Facilities without available data are excluded from the ranking.Click the rank badge to see the full State ranking.Click here to see the full State ranking.
Other operating costs Info Everything it costs to run the home apart from payroll — food, utilities, supplies, maintenance, contract labor and administration. Calculated as total operating expense minus payroll (staff salaries and wage-related benefits).
$10.5M
Total costs Info The home's total operating expense for the year — all the costs of running it, salaries included (CMS cost report, Worksheet G-3).
$15.2M

Who this home usually serves

TYPE OF STAY

Primarily short stays

Residents typically stay for brief periods, with frequent admissions and discharges throughout the year.

Most new residents arrive under private pay (67% of admissions), and a typical private pay stay runs around 4 - 5 months.

Admissions
195 total

Coverage residents most often arrive under.

Medicare 19%
Private pay 67%
Medicaid 14%
Discharges
157 total

Coverage residents most often leave under.

Medicare 22%
Private pay 75%
Medicaid 3%

Places of interest near Carmel Manor

Address 100 Carmel Manor Road, Fort Thomas, KY 41075

Calculate Travel Distance to Carmel Manor

Add your location

Address

Compare Nursing Homes around the area

The information below is reported by the Kentucky Cabinet for Health and Family Services, Office of Inspector General.

Carmel Manor
NH
MC
NC
RC
Fort Thomas - 175 - 34 -
Madonna Manor
NH
AL
IL
MC
Villa Hills - 64 - 4 1 Bed / 2 Bed
Berea Health and Rehabilitation
NH
Berea - 84 - 57 -
Prestonsburg Health Care Center
NH
HC
MC
PC
Prestonsburg - 56 - 7 -
Signature Healthcare of Monroe County Rehab and Well
NH
HC
PC
RC
Tompkinsville - 104 - 53 -

Frequently Asked Questions about Carmel Manor

Is Carmel Manor in a walkable area?

Carmel Manor has a walk score of 34. Somewhat walkable. A few nearby services may be reachable on foot, but most trips require transportation.

What is the license number of Carmel Manor?

According to KY state health department records, Carmel Manor's license number is 100056.

What is the occupancy rate at Carmel Manor?

Carmel Manor's occupancy is 54%.

Does Carmel Manor operate as a for-profit or non-profit?

Carmel Manor is registered as a non-profit in KY.

Who is the administrator of Carmel Manor?

Jena Quinn-Sexton is the administrator of Carmel Manor.

How many beds does Carmel Manor have?

Carmel Manor has 175 beds.

Are there photos of Carmel Manor?

Yes — there are 6 photos of Carmel Manor in the photo gallery on this page.

Guides for Better Senior Living

Care Cost Calculator: See Prices in Your Area

Nursing Home Data Explorer

Don’t Wait Too Long: 7 Red Flag Signs Your Parent Needs Assisted Living Now

The True Cost of Assisted Living in 2025 – And How Families Are Paying For It

Understanding Senior Living Costs: Pricing Models, Discounts & Financial Assistance