Carolina Bay at Autumn Hall
Nursing Home, Assisted Living, Independent Living & Memory Care · Wilmington, NC
CMS overall rating Info CMS (the Centers for Medicare & Medicaid Services) is the federal agency that rates nursing home quality. Its Overall Rating runs from 1 to 5 stars, combining health inspections, staffing, and quality measures, with inspections weighted most heavily.

Carolina Bay at Autumn Hall

Nursing Home, Assisted Living, Independent Living & Memory Care · Wilmington, NC
CMS overall rating Info CMS (the Centers for Medicare & Medicaid Services) is the federal agency that rates nursing home quality. Its Overall Rating runs from 1 to 5 stars, combining health inspections, staffing, and quality measures, with inspections weighted most heavily.
Calculator: See prices in your area
Carolina Bay at Autumn Hall accepts Medicare and private pay.

Overview of Carolina Bay at Autumn Hall

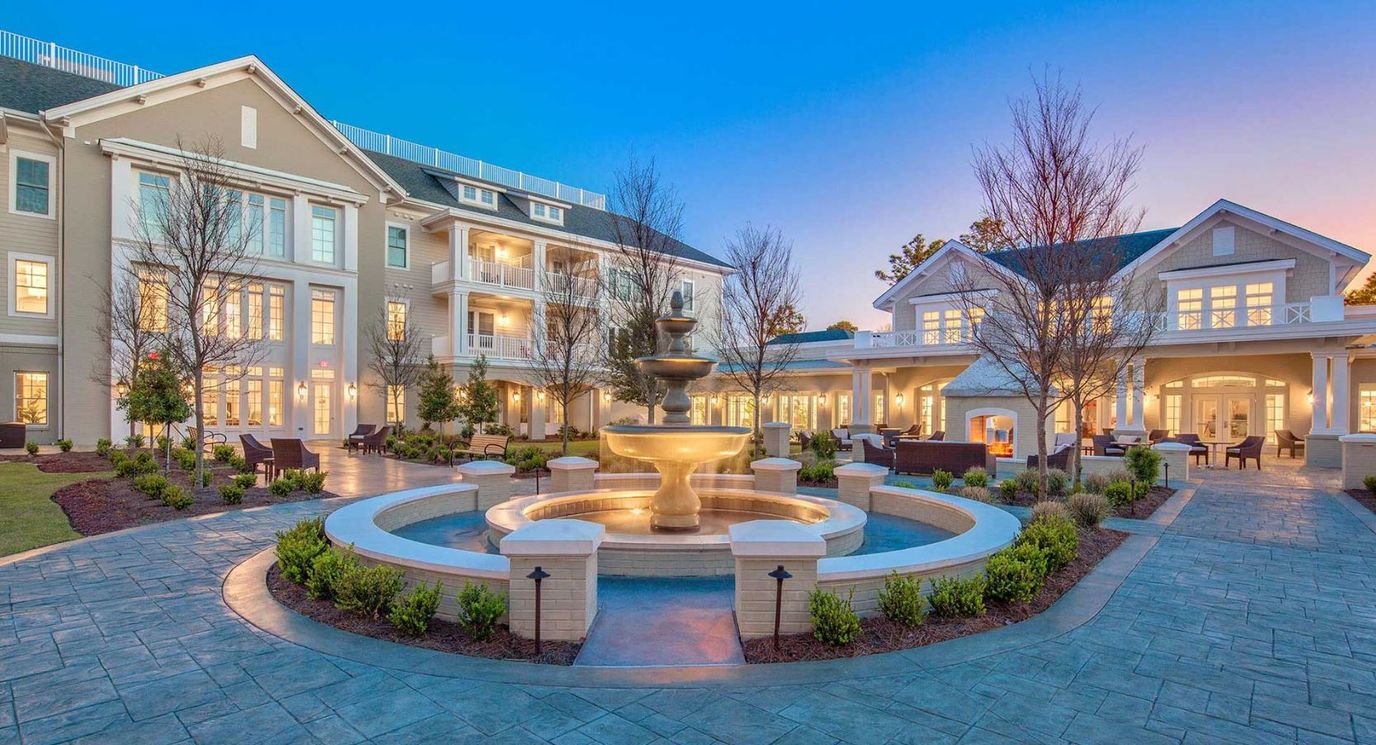
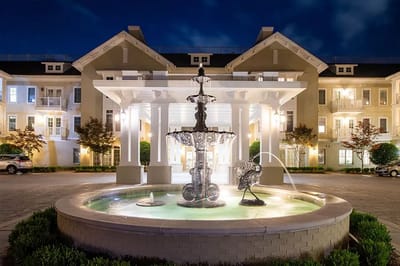
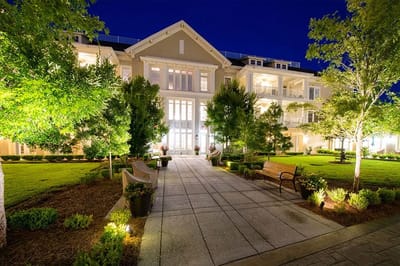
Carolina Bay at Autumn Hall is a luxury retirement home in Wilmington. With an emphasis on memory care living, the premier home provides a comfortable environment for assisted living, independent living, and skilled nursing residents. The upscale home offers a professional care staff that ensures that residents can create memorable moments through the elevated lifestyle and experiences provided in the community. A home that encourages, empowers, and elevates the lifestyles of its seniors for an enhanced aging experience.

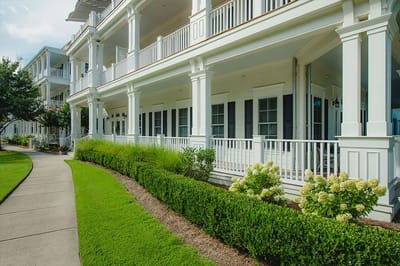
Carolina Bay at Autumn Hall has designed residential living to help fulfill a sense of independence and individuality for each resident. Community accommodations offer all-inclusive services, including spacious common areas, recreational rooms, housekeeping, assisted living for Alzheimer’s and dementia, and transportation services.

Quality ratings

Measured by Centers for Medicare & Medicaid Services (CMS)

Overall rating Info The Overall CMS Rating combines results from health inspections, staffing levels and quality measures. Health inspections carry the most weight. Staffing and quality scores can increase or decrease the final rating based on performance compared to state and national standards.
▲ 78.8% Above NC avg. ▲ 78.8% Above NC avg.NC average: 2.8Click the badge to see the full State ranking.Click here to see the full State ranking.
Health Inspection Info Based on the results of the facility's three most recent standard inspections and any complaint investigations. CMS reviews the number, scope, and severity of deficiencies, with more recent findings weighted more heavily.
▲ 77.0% Above NC avg. ▲ 77.0% Above NC avg.NC average: 2.8Click the badge to see the full State ranking.Click here to see the full State ranking.
Staffing Info Measures average nursing staff hours per resident per day, including Registered Nurses (RNs) and total nursing staff. Ratings are adjusted based on the level of care residents require and are compared to state and national benchmarks.
▲ 88.0% Above NC avg. ▲ 88.0% Above NC avg.NC average: 2.7Click the badge to see the full State ranking.Click here to see the full State ranking.
Quality Measures Info Based on clinical and physical health indicators reported to CMS, such as hospital readmissions, falls, pressure ulcers, and improvements in mobility. These measures reflect how well residents' health needs are being managed.
▼ 5.5% Below NC avg. ▼ 5.5% Below NC avg.NC average: 3.2Click the badge to see the full State ranking.Click here to see the full State ranking.

Staffing hours breakdown

Info Daily nursing hours per resident by staff type, reported to CMS. Higher is generally better — compare this facility to state and national averages to see where staffing stands.

Hours per resident per day — compared to North Carolina state averages

Total nursing care / resident Info This home is ranked 32nd out of 97 homes in North Carolina for nurse hours. Total adjusted nursing hours per resident per day, combining RN, LPN, and aide time. CMS adjusts this for case-mix so facilities can be fairly compared.
4h 22m per day
Rank #32 / 97Nurse hours — State benchmarkedThis home is ranked 32nd out of 97 homes in North Carolina. Shows adjusted nurse hours per resident per day benchmarked to the North Carolina average, with a ranking across 97 North Carolina facilities. More hours mean more direct care. The national average is about 3.5 hrs; below 3.0 is a red flag.Rankings are based only on facilities in North Carolina that report data for that category. Facilities without available data are excluded from the ranking.Click the rank badge to see the full State ranking.Click here to see the full State ranking.
This facility North Carolina avg (3h 59m per day)
vs North Carolina avg
+10%

1 of 6 metrics below state avg

Standout metric Weekend RN is +161% above state avg
Staff typeHours / Day / Residentvs state avg
Registered Nurse (RN) Info RNs hold the highest nursing license and can assess residents, interpret test results, and direct care plans. More RN hours per day often signals stronger clinical oversight and faster response to health changes. 1h 23m per day ▲ 125% State avg: 37m per day · National avg: 41m per day
LPN / LVN Info Licensed Practical Nurses (LPNs) or Licensed Vocational Nurses (LVNs) deliver routine hands-on care — medication administration, wound dressing, and monitoring vital signs. They work under RN supervision and make up a large share of daily bedside care. 56m per day ▲ 5% State avg: 53m per day · National avg: 52m per day
Nurse Aide Info Certified Nurse Aides (CNAs) provide the most direct day-to-day assistance: bathing, dressing, feeding, and mobility. Nurse aide hours are typically the largest staffing category and directly affect residents' quality of life. 2h 14m per day ▼ 4% State avg: 2h 19m per day · National avg: 2h 20m per day
Weekend Total Nursing Info Combined nursing hours (RN + LPN + Nurse Aide) per resident per day on weekends. Staffing often drops on weekends — this figure reveals whether the facility maintains adequate coverage outside of weekday hours. 4h 3m per day ▲ 18% State avg: 3h 26m per day · National avg: 3h 27m per day
Physical Therapist Info Hours per resident per day provided by licensed Physical Therapists (PTs) or PT Assistants. PT services help residents recover mobility after injury or illness and are especially important for post-acute (short-stay) rehabilitation. 11m per day ▲ 112% State avg: 5m per day · National avg: 4m per day
Weekend RN Info Registered nurse hours specifically on weekends. Facilities sometimes reduce RN presence on Saturdays and Sundays — a low weekend RN figure compared to weekday hours can indicate reduced clinical oversight when most administrative staff are absent. 1h 3m per day ▲ 161% State avg: 24m per day · National avg: 29m per day

Capacity and availability

This home usually has limited availability

Higher occupancy than the North Carolina average: 76.4%
Occupancy rate
89.5% Rank #54 / 271Occupancy rate — State benchmarkedThis home is ranked 54th out of 271 homes in North Carolina. Shows this facility's occupancy rate versus the North Carolina average, with its Statewide rank out of 271. Higher occupancy signals strong local demand and financial stability.Rankings are based only on facilities in North Carolina that report data for that category. Facilities without available data are excluded from the ranking.Click the rank badge to see the full State ranking.Click here to see the full State ranking.
Avg. Length of Stay
15 days
Bed community size
30-bed community Rank #329 / 390Bed count — State benchmarkedThis home is ranked 329th out of 390 homes in North Carolina. Shows this facility's certified or reported bed count compared to other North Carolina facilities. Larger communities may offer more amenities, programs, and on-site services for residents and families.Rankings are based only on facilities in North Carolina that report data for that category. Facilities without available data are excluded from the ranking.Click the rank badge to see the full State ranking.Click here to see the full State ranking.
A moderately sized community that may balance personal attention with shared amenities and social activities.
Walk Score
Walk Score: 18 / 100 Rank #394 / 572Walk Score — State benchmarkedThis home is ranked 394th out of 572 homes in North Carolina. Shows how walkable this facility's neighborhood is compared to the average Walk Score across North Carolina facilities. Higher scores benefit residents, families, and staff.Rankings are based only on facilities in North Carolina that report data for that category. Facilities without available data are excluded from the ranking.Click the rank badge to see the full State ranking.Click here to see the full State ranking.
Car-dependent. Most errands require a car, with limited nearby walkable options.

Payment & Insurance

1 service
Does not accept Medicare

Therapy & Rehabilitation

1 service
Rehabilitation Services

Staffing & Medical

1 service
24-Hour Staffing

Additional Services

1 service
Memory Support

Amenities & Lifestyle

Grand Lobby And Living Areas
Library
Card Room
Billiard And Poker Room
Media And Multi-Purpose Room
Art Studio
Casual Dining
Bar/Pub
Fine Dining
Salt Water Pool And Hot Tub
Stationary Equipment Room
Classroom For Land Classes
Grand Courtyard With Putting Green
Bocce Ball
And Shuffle Board Courts
Numerous Walking Paths Around Campus

Pricing & Financial Information

Starting Price$5,951 per month

Contact Carolina Bay at Autumn Hall

Staffing Data

Reporting period: October 1 – December 31, 2025 (Q4 2025). Source: CMS Payroll-Based Journal report.

Total staff 96
Employees 64
Contractors 32
Staff to resident ratio 3.56 : 1
98% more staff per resident than North Carolina average
North Carolina average ratio: 1.80 : 1 North Carolina average ratio: 1.80 : 1See full North Carolina ranking
Avg staff/day 25
Average shift 7.2 hours
10% worse than North Carolina average
North Carolina average: 8 hours North Carolina average shift: 8 hoursSee full North Carolina ranking
Total staff hours (quarter) 16,596

Nursing staff breakdown

Q4 2025 · Oct 1 – Dec 31 More info This data comes from the CMS Payroll-Based Journal report covering October 1 – December 31, 2025.
Registered Nurse

Manages medical care and health needs.

RN Staff Info All 10 RN Staff are full-time employees. No contractors work on this role. 10
Average shift length Info Average shift length. Calculated as total hours divided by days worked and average staff per day. 8.6 hours
Licensed Practical Nurse

Assists with medical care and medications.

LPN Staff Info All 11 LPN Staff are full-time employees. No contractors work on this role. 11
Average shift length Info Average shift length. Calculated as total hours divided by days worked and average staff per day. 8.6 hours
Certified Nursing Assistant

Helps with daily care and mobility.

CNA Staff Info All 32 CNA Staff are full-time employees. No contractors work on this role. 32
Average shift length Info Average shift length. Calculated as total hours divided by days worked and average staff per day. 7.9 hours

Contractor staffing

Q4 2025 · Oct 1 – Dec 31 More info This data comes from the CMS Payroll-Based Journal report covering October 1 – December 31, 2025.

Total hours from contractors

23.3%

3,863 contractor hours this quarter

Physical Therapy Aide: 8 Physical Therapy Assistant: 7 Speech Language Pathologist: 5 Respiratory Therapy Technician: 5 Qualified Social Worker: 5 Occupational Therapy Assistant: 1 Medical Director: 1

Staff by category

Q4 2025 · Oct 1 – Dec 31 More info This data comes from the CMS Payroll-Based Journal report covering October 1 – December 31, 2025.
Certified Nursing Assistant320325,77992100%7.9
Licensed Practical Nurse110112,43692100%8.6
Registered Nurse100102,27592100%8.6
Physical Therapy Assistant0779497177%7
Speech Language Pathologist0558926571%6.6
Physical Therapy Aide0888596571%6.1
Clinical Nurse Specialist3038277379%4.9
Qualified Social Worker0555636672%5.3
Respiratory Therapy Technician0554887480%5.5
Nurse Practitioner1014866368%7.7
Dietitian1014735863%8.2
Mental Health Service Worker1014255661%7.6
Medical Director011812729%3
Medication Aide/Technician5053255%4.6
Occupational Therapy Assistant011311011%3.1
32 Certified Nursing Assistant
% of Days 100%
11 Licensed Practical Nurse
% of Days 100%
10 Registered Nurse
% of Days 100%
7 Physical Therapy Assistant
% of Days 77%
5 Speech Language Pathologist
% of Days 71%
8 Physical Therapy Aide
% of Days 71%
3 Clinical Nurse Specialist
% of Days 79%
5 Qualified Social Worker
% of Days 72%
5 Respiratory Therapy Technician
% of Days 80%
1 Nurse Practitioner
% of Days 68%
1 Dietitian
% of Days 63%
1 Mental Health Service Worker
% of Days 61%
1 Medical Director
% of Days 29%
5 Medication Aide/Technician
% of Days 5%
1 Occupational Therapy Assistant
% of Days 11%

Penalties and fines

Federal penalties imposed by CMS for regulatory violations, including civil money penalties (fines) and denials of payment for new Medicare/Medicaid admissions.

Source: CMS Penalties Database

No penalties in the past 3 years

No civil money penalties or payment denials were reported in the last 3 years.

Quality of care over time

These measures show how residents usually do over time at this home, based on health outcomes and preventive care.

Short-stay resident measures
Pneumococcal Vaccine Info Percent of short-stay residents assessed and appropriately given the pneumococcal vaccine 97.3%
22% better than North Carolina average

North Carolina average: 79.9%

Antipsychotic medication increase Info Percent of short-stay residents who newly received an antipsychotic medication 0.9%
39% better than North Carolina average

North Carolina average: 1.5%

Influenza Vaccine Info Percent of short-stay residents assessed and appropriately given the seasonal influenza vaccine 99.5%
27% better than North Carolina average

North Carolina average: 78.1%

Breakdown by payment type

Medicare

71% of new residents, usually for short-term rehab.

Typical stay 22 days

Private pay

29% of new residents, often for short stays.

Typical stay 7 - 8 months

Facility Characteristics

Source: CMS Long-Term Care Facility Characteristics (Data as of Jan 2026)

Total residents 27
Medicare
26
96.3% of residents
Private pay or other
1
3.7% of residents
Programs & Services
Residents Group

Residents meet regularly to discuss policies, care quality, and activities

CCRC

Part of a Continuing Care Retirement Community offering multiple care levels

Active Resident Council

Organized group of residents that meets regularly to discuss facility policies, quality of life, and activities.

Finances and operations

Based on CMS SNF Cost Report for fiscal year ending in 09/2023.

For-profit
Corporation
Net patient revenue Info Net patient revenue — what the home actually collects for resident care, after contractual allowances, bad debt and discounts are subtracted from its gross charges (CMS cost report, Worksheet G-3). It covers resident care only; money the home earns from other sources is shown separately as "Other income."
$11.9M
Net patient income Info Net patient income: net patient revenue minus the home's total operating expenses. A positive figure means it earns more from resident care than it spends to deliver it; a negative figure means the opposite. It excludes non-operating "other income."
-$1.6M
For-profit Corporation
Net patient revenue Info Net patient revenue — what the home actually collects for resident care, after contractual allowances, bad debt and discounts are subtracted from its gross charges (CMS cost report, Worksheet G-3). It covers resident care only; money the home earns from other sources is shown separately as "Other income."
$11.9M Rank #59 / 104Revenue — State benchmarkedThis home is ranked 59th out of 104 homes in North Carolina. Shows this facility's annual revenue compared to the North Carolina average. Higher revenue generally means more resources for staffing and capital — read alongside Payroll %.Rankings are based only on facilities in North Carolina that report data for that category. Facilities without available data are excluded from the ranking.Click the rank badge to see the full State ranking.Click here to see the full State ranking.
Net patient income Info Net patient income: net patient revenue minus the home's total operating expenses. A positive figure means it earns more from resident care than it spends to deliver it; a negative figure means the opposite. It excludes non-operating "other income."
-$1.6M
Other income Info Money the home earns outside of resident care — such as investments, grants, rentals and other non-operating sources (CMS cost report, Worksheet G-3). It is tracked separately from net patient revenue: it is not part of that figure, and it is not included in net patient income.
$46.2K
Payroll costs Info Staff salaries plus wage-related costs — benefits such as payroll taxes, health insurance and retirement — from the home's own accounting records (CMS cost report, Worksheet A). Contract or agency labor is counted separately, under other operating costs. Rank #81 / 104Payroll — State benchmarkedThis home is ranked 81st out of 104 homes in North Carolina. Shows total annual staff payroll benchmarked to the North Carolina average. Higher payroll investment relative to peers often signals better staffing and less reliance on cheaper contract labor.Rankings are based only on facilities in North Carolina that report data for that category. Facilities without available data are excluded from the ranking.Click the rank badge to see the full State ranking.Click here to see the full State ranking.
$5.1M 43.3% of net patient revenue Info Payroll as a share of revenue: staff salaries and wage-related benefits divided by net patient revenue. A higher figure means more of each revenue dollar goes to staff pay. Rank #85 / 104Payroll % — State benchmarkedThis home is ranked 85th out of 104 homes in North Carolina. Shows payroll as a percentage of revenue versus the North Carolina average. Well-run North Carolina facilities typically land around 49–62% — the top third Statewide. Below 25% may signal understaffing or heavy agency use — read with Staffing ratings.Rankings are based only on facilities in North Carolina that report data for that category. Facilities without available data are excluded from the ranking.Click the rank badge to see the full State ranking.Click here to see the full State ranking.
Other operating costs Info Everything it costs to run the home apart from payroll — food, utilities, supplies, maintenance, contract labor and administration. Calculated as total operating expense minus payroll (staff salaries and wage-related benefits).
$8.4M
Total costs Info The home's total operating expense for the year — all the costs of running it, salaries included (CMS cost report, Worksheet G-3).
$13.5M

What does this home offer?

Housing options icon

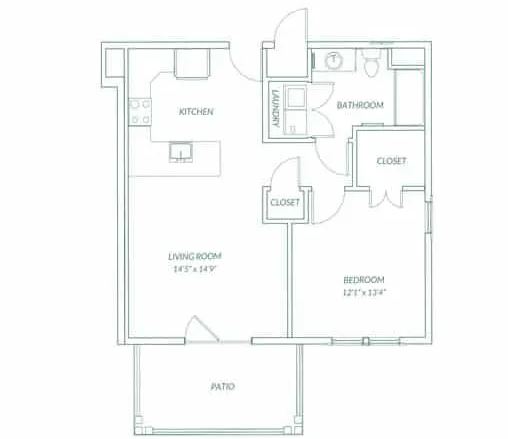
Housing Options: 1 Bed / 2 Bed

Building type icon
Building type icon

Building Type: 3-story

Transportation services icon

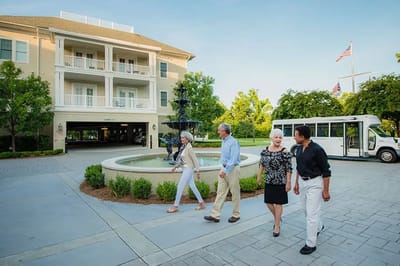
Transportation Services

Fitness and recreation icon

Fitness and Recreation

Who this home usually serves

TYPE OF STAY

Mostly short-term rehab stays

Most residents typically stay for a few weeks or months before returning home or moving on.

Most new residents arrive under Medicare (71% of admissions), and a typical Medicare stay runs around 22 days.

Admissions
431 total

Coverage residents most often arrive under.

Medicare 71%
Private pay 29%
Discharges
772 total

Coverage residents most often leave under.

Medicare 36%
Private pay 64%

Living Spaces & Floor Plans for Carolina Bay at Autumn Hall

Places of interest near Carolina Bay at Autumn Hall

Address 2.7 miles from city center Info Estimated distance in miles from Wilmington's city center to Carolina Bay at Autumn Hall's address, calculated via Google Maps.

Calculate Travel Distance to Carolina Bay at Autumn Hall

Add your location

Address

Compare Nursing Homes around Wilmington

The information below is reported by the North Carolina Department of Health and Human Services, Division of Health Service Regulation.

5 facilities compared · CMS & NC Dept. of Health data

Carolina Bay at Autumn Hall
NH
AL
IL
MC
Wilmington (Windemere)
30
Facility 30
NC AVG 72
Rank #329 / 390
89.5%
Facility 89.5%
NC AVG 76.4%
Rank #54 / 271
+17%
4.36
Facility 4.36
NC AVG 3.98
Rank #32 / 97
+14%+10%
$0
Facility $0
NC AVG $74.6k
Rank #1 / 105
6
Facility 6
NC AVG 20.9
Rank #21 / 101
3.0
Facility 3.0
NC AVG 5.0
Rank #32 / 101
-28-
18
Facility 18
NC AVG 33
Rank #394 / 572
Wilmington Ah Senior Housing Jv Opco LLC
$11.9M
Facility $11.9M
NC AVG $13.2M
Rank #59 / 104
$5.1M
Facility $5.1M
NC AVG $4.9M
Rank #81 / 104
43.3%
Facility 43.3%
NC AVG 39.8%
Rank #85 / 104
345571
Trinity Grove
NH
MC
NC
Wilmington
100
Facility 100
NC AVG 72
Rank #79 / 390
94.3%
Facility 94.3%
NC AVG 76.4%
Rank #39 / 271
+23%
5.22
Facility 5.22
NC AVG 3.98
Rank #21 / 97
+21%+31%
$102.9k
Facility $102.9k
NC AVG $74.6k
Rank #93 / 105
16
Facility 16
NC AVG 20.9
Rank #59 / 101
3.2
Facility 3.2
NC AVG 5.0
Rank #38 / 101
493-
19
Facility 19
NC AVG 33
Rank #384 / 572
-
$12.9M
Facility $12.9M
NC AVG $13.2M
Rank #35 / 104
$7.0M
Facility $7.0M
NC AVG $4.9M
Rank #36 / 104
54.3%
Facility 54.3%
NC AVG 39.8%
Rank #70 / 104
345554
Liberty Commons
NH
AL
HC
PC
RC
Wilmington (Liberty Commons Center)
82
Facility 82
NC AVG 72
Rank #145 / 390
77.8%
Facility 77.8%
NC AVG 76.4%
Rank #123 / 271
+2%
3.66
Facility 3.66
NC AVG 3.98
Rank #66 / 97
-31%-8%
$35.8k
Facility $35.8k
NC AVG $74.6k
Rank #75 / 105
22
Facility 22
NC AVG 20.9
Rank #70 / 101
5.5
Facility 5.5
NC AVG 5.0
Rank #75 / 101
577-
52
Facility 52
NC AVG 33
Rank #130 / 572
Charles Duff
$11.6M
Facility $11.6M
NC AVG $13.2M
Rank #64 / 104
$5.0M
Facility $5.0M
NC AVG $4.9M
Rank #68 / 104
42.9%
Facility 42.9%
NC AVG 39.8%
Rank #43 / 104
345468
Champions Assisted Living at the Davis Community
NH
AL
IL
MC
RC
Wilmington
115
Facility 115
NC AVG 72
Rank #55 / 390
60.7%
Facility 60.7%
NC AVG 76.4%
Rank #183 / 271
-21%
3.39
Facility 3.39
NC AVG 3.98
Rank #76 / 97
-19%-15%
$67.1k
Facility $67.1k
NC AVG $74.6k
Rank #87 / 105
14
Facility 14
NC AVG 20.9
Rank #50 / 101
3.5
Facility 3.5
NC AVG 5.0
Rank #41 / 101
398-
6
Facility 6
NC AVG 33
Rank #484 / 572
Charles Long
$14.9M
Facility $14.9M
NC AVG $13.2M
Rank #18 / 104
$13.1M
Facility $13.1M
NC AVG $4.9M
Rank #9 / 104
87.3%
Facility 87.3%
NC AVG 39.8%
Rank #30 / 104
345160
Peak Resources Wilmington
NH
HC
NC
RC
Wilmington (Lakeside Park)
110
Facility 110
NC AVG 72
Rank #62 / 390
86.2%
Facility 86.2%
NC AVG 76.4%
Rank #73 / 271
+13%
3.85
Facility 3.85
NC AVG 3.98
Rank #52 / 97
-52%-3%
$58.7k
Facility $58.7k
NC AVG $74.6k
Rank #85 / 105
23
Facility 23
NC AVG 20.9
Rank #72 / 101
5.8
Facility 5.8
NC AVG 5.0
Rank #79 / 101
191-
33
Facility 33
NC AVG 33
Rank #280 / 572
Deborah Jean Nunn Mrtl Tr
$12.1M
Facility $12.1M
NC AVG $13.2M
Rank #86 / 104
$4.9M
Facility $4.9M
NC AVG $4.9M
Rank #86 / 104
40.8%
Facility 40.8%
NC AVG 39.8%
Rank #33 / 104
345537

Financial Assistance for
Nursing Home in North Carolina

Carolina Bay at Autumn Hall is located in Wilmington, North Carolina.
Here are the financial assistance programs available to residents in North Carolina.

Get Financial aid guidance

Community Alternatives Program for Disabled Adults

NC Medicaid CAP/DA

Age 65+ or disabled
General North Carolina resident, Medicaid- eligible, nursing home-level care need.
Income Limits (2025) ~$2,829/month 300% FBR, individual
Asset Limits $2,000 (individual), $3,000 (couple).
NC

High demand; waitlists common in urban areas.

Benefits
Personal care (5-7 hours/day) Respite (240 hours/year) Adult day care ($60/day) Home modifications ($1,500 avg.)

North Carolina Senior Care Options

NC SCO (via NFCSP)

Age Caregiver of someone 60+ (or with dementia)
General North Carolina resident.
Income Limits No strict limit; prioritizes low-income.
Asset Limits Not applicable.
NC

Limited slots; rural/urban balance.

Benefits
In-home respite (4-6 hours/day) Adult day care (~$60/day) Short-term facility care (up to 5 days)

Program of All-Inclusive Care for the Elderly (PACE)

North Carolina PACE (e.g., PACE of the Triad)

Age 55+
General NC resident (specific counties), NFLOC, safe with PACE support.
Income Limits (2025) ~$2,829/month (Medicaid-eligible); private pay option available.
Asset Limits $2,000 (individual), $3,000 (couple) for Medicaid enrollees.
NC

Available in 10+ counties (e.g., Guilford, Wake); multiple providers (e.g., PACE of the Southern Piedmont).

Benefits
Personal care (5-7 hours/day) Medical care Meals Transportation Respite Therapies

In-Home Aide Services

North Carolina In-Home Aide Services

Age 60+
General NC resident, unable to perform 1+ ADL, at risk of nursing home placement.
Income Limits (2025) No strict cap; prioritizes low-income ~$24,980/year
Asset Limits Not assessed; need-based.
NC

Family can be aides; varies by county funding.

Benefits
Personal care (5-20 hours/week) Meal prep Respite (~5 days/year) Errands

Medicare Savings Program (MSP)

North Carolina Medicare Savings Program

Age 65+ or disabled
General NC resident, Medicare Part A/B.
Income Limits (2025) ~$2,510/month (QMB), ~$3,380/month (SLMB), ~$3,598/month (QI)—individual.
Asset Limits $9,430 (individual), $14,130 (couple).
NC

Three tiers; no waitlist; includes Extra Help for Part D.

Benefits
Covers Part B premiums ($174.70/month) Deductibles ($240/year) Copays (~20%)

VA Aid and Attendance (A&A) and Housebound Benefits

North Carolina VA Aid and Attendance/Housebound

Age 65+ or disabled veteran/spouse
General NC resident, wartime service, need for ADL help (A&A) or homebound.
Income Limits (2025) Net income < ~$1,984/month (veteran with dependent, A&A); pension offsets income.
Asset Limits ~$155,356 net worth limit
NC

High veteran demand in rural/urban areas.

Benefits
Cash (~$1,433-$2,642/month veteran, ~$951-$1,318 spouse) for care costs (e.g., in-home, assisted living)

Urgent Repair Program (URP)

North Carolina Urgent Repair Program

Age 60+ prioritized
General NC resident, homeowner, low-income.
Income Limits (2025) ~$30,258/year 50% AMI, varies by county
Asset Limits Not strictly assessed; home value considered.
NC

Forgivable at $2,000/year; statewide via local partners.

Benefits
Repairs (~$8,000-$12,000 avg.) for safety (e.g., roofs, heating, accessibility)

State/County Special Assistance (SA)

North Carolina Special Assistance

Age 65+ (or disabled)
General NC resident, in licensed adult care home, low-income.
Income Limits (2025) ~$1,255/month (individual, 100% FPL); varies by facility rate.
Asset Limits $2,000 individual
NC

Covers assisted living; counties supplement state funds.

Benefits
Cash (~$1,200-$1,500/month) for room/board; Medicaid covers care services

Frequently Asked Questions about Carolina Bay at Autumn Hall

What neighborhood is Carolina Bay at Autumn Hall in?

Carolina Bay at Autumn Hall is in the Windemere neighborhood.

Is Carolina Bay at Autumn Hall in a walkable area?

Carolina Bay at Autumn Hall has a walk score of 18. Car-dependent. Most errands require a car, with limited nearby walkable options.

What is the occupancy rate at Carolina Bay at Autumn Hall?

Carolina Bay at Autumn Hall's occupancy is 89.5%.

Does Carolina Bay at Autumn Hall operate as a for-profit or non-profit?

Carolina Bay at Autumn Hall is registered as a for-profit.

Are there photos of Carolina Bay at Autumn Hall?

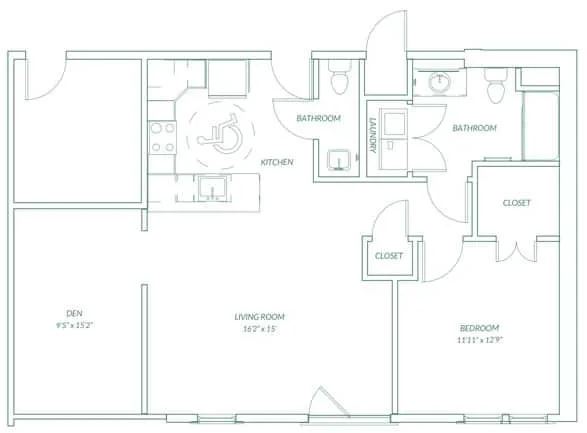
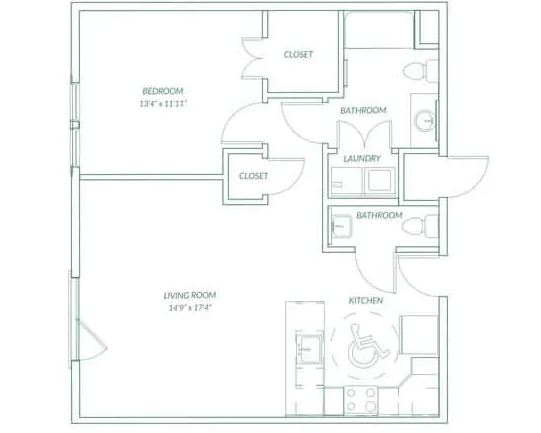
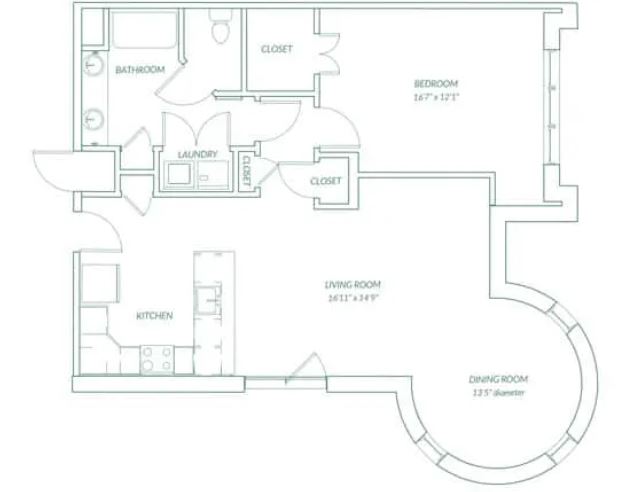
Yes — there are 7 photos of Carolina Bay at Autumn Hall in the photo gallery on this page.

What is the address of Carolina Bay at Autumn Hall?

Carolina Bay at Autumn Hall is located at 630 Carolina Bay Dr, Wilmington, NC 28403.

What is the phone number of Carolina Bay at Autumn Hall?

(866) 455-0599 will put you in contact with the team at Carolina Bay at Autumn Hall.

Guides for Better Senior Living

Care Cost Calculator: See Prices in Your Area

Nursing Home Data Explorer

Don’t Wait Too Long: 7 Red Flag Signs Your Parent Needs Assisted Living Now

The True Cost of Assisted Living in 2025 – And How Families Are Paying For It

Understanding Senior Living Costs: Pricing Models, Discounts & Financial Assistance