Champions Assisted Living at the Davis Community
Nursing Home, Independent Living, Memory Care & Assisted Living · Wilmington, NC
CMS overall rating Info The Overall CMS Rating is scored from 1 to 5 stars and combines results from health inspections, staffing levels, and quality measures. Health inspections carry the most weight. Staffing and quality scores can increase or decrease the final rating based on performance compared to state and national standards.

Champions Assisted Living at the Davis Community

Nursing Home, Independent Living, Memory Care & Assisted Living · Wilmington, NC
CMS overall rating Info The Overall CMS Rating is scored from 1 to 5 stars and combines results from health inspections, staffing levels, and quality measures. Health inspections carry the most weight. Staffing and quality scores can increase or decrease the final rating based on performance compared to state and national standards.
Calculator: See prices in your area
Champions Assisted Living at the Davis Community accepts Medicare, Medicaid, and private pay.

Overview of Champions Assisted Living at the Davis Community

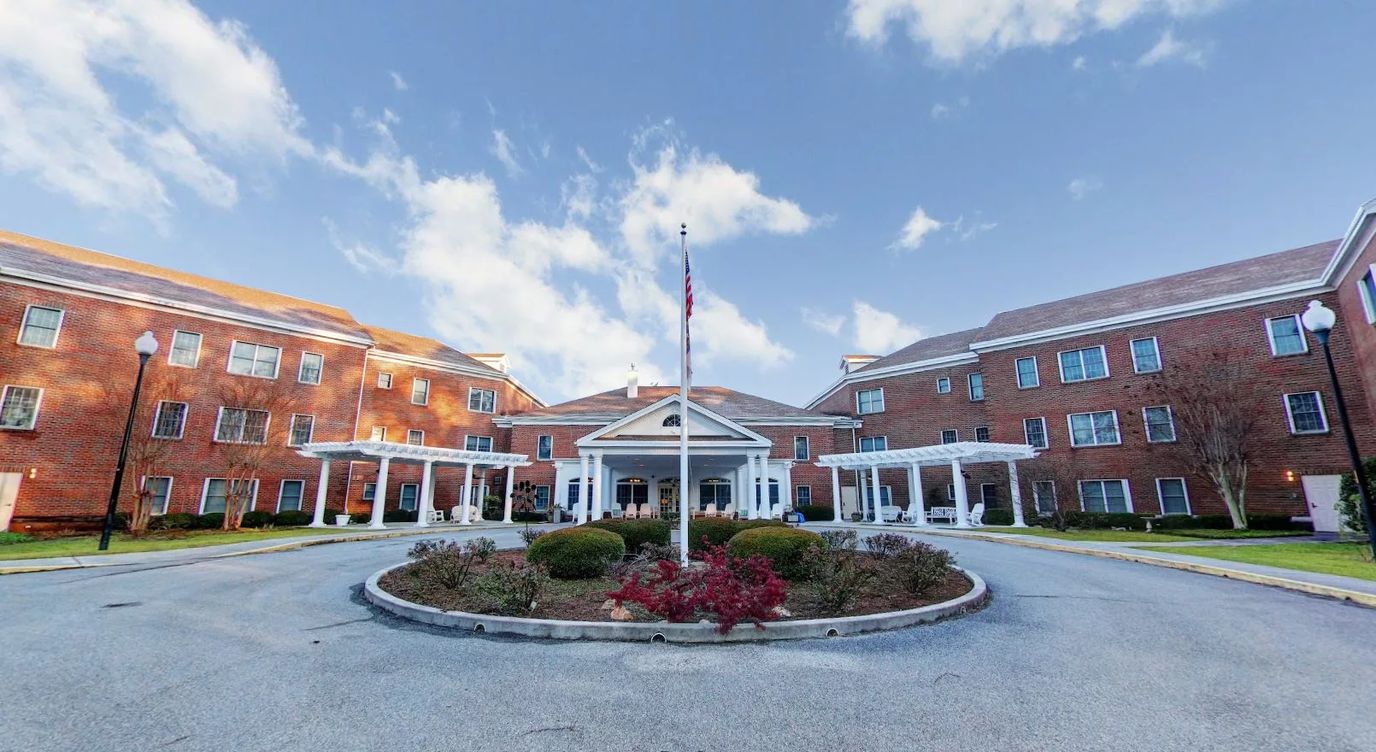
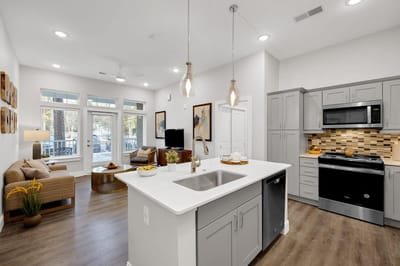
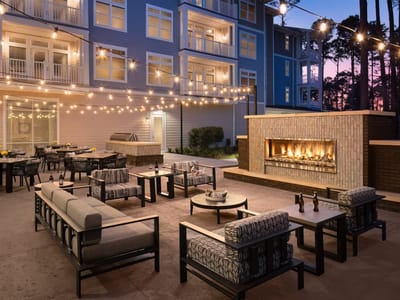
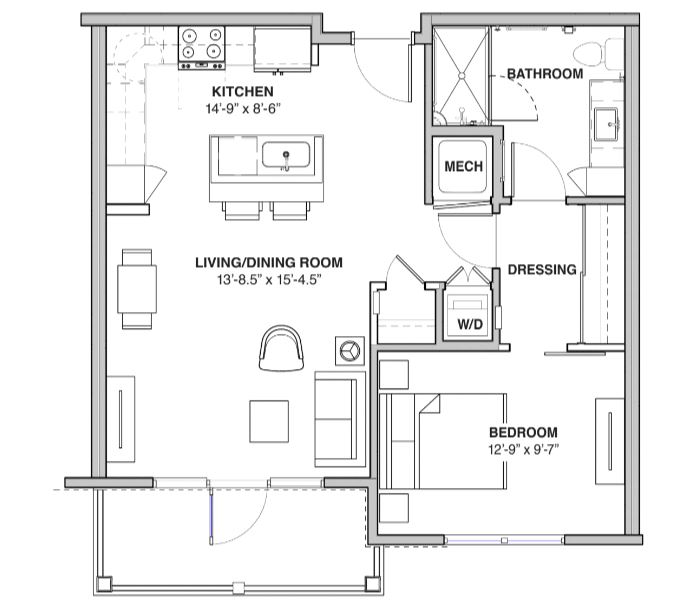
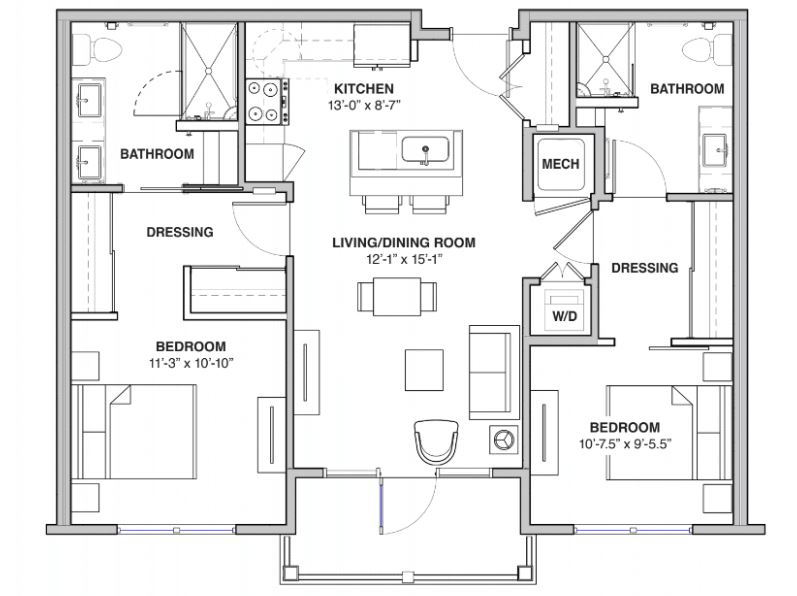
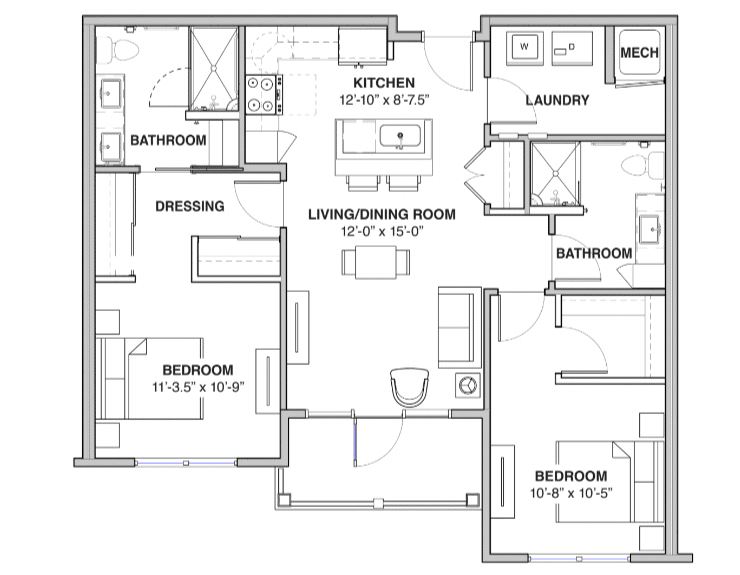
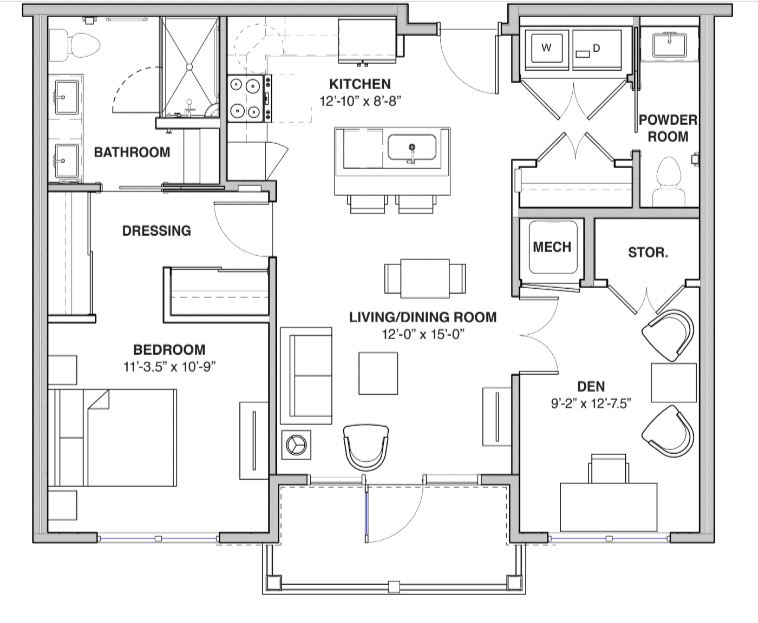
Champions Assisted Living, located within The Davis Communities in Wilmington, NC, is a senior living community specifically designed for The Davies Communities’ residents living with Alzheimer’s and other forms of dementia. They provide assisted living services along with memory care, in their one-to-two bedroom units equipped with living area, ample closet space, kitchenette, and private bathroom. As part of their assisted living services, the residents are provided round-the-clock availability of staff for supervision and assistance, diabetic care, medication management, and monthly wellness checkup, as well as therapy services.

The residents of Champions Assisted Living are also able to enjoy a myriad of amenities they offer including meal preparation services and dining options within the community, assistance with daily living activities, mobility and transportation assistance, access to fitness rooms and pool, and grooming services at the salon and spa. Being conveniently situated within the Davis Communities, Champions Assisted Living Services are also provided access to their auditorium, club room, and art studio. Lastly, they offer laundry and housekeeping services, to ensure the overall comfort of their residents’ stay.

Quality ratings

Measured by Centers for Medicare & Medicaid Services (CMS)

Overall rating Info The Overall CMS Rating combines results from health inspections, staffing levels and quality measures. Health inspections carry the most weight. Staffing and quality scores can increase or decrease the final rating based on performance compared to state and national standards.
▼ 32.7% Below NC avg. ▼ 32.7% Below NC avg.Click the badge to see the full State ranking.Click here to see the full State ranking.
Health Inspection Info Based on the results of the facility's three most recent standard inspections and any complaint investigations. CMS reviews the number, scope, and severity of deficiencies, with more recent findings weighted more heavily.
▼ 11.8% Below NC avg. ▼ 11.8% Below NC avg.Click the badge to see the full State ranking.Click here to see the full State ranking.
Staffing Info Measures average nursing staff hours per resident per day, including Registered Nurses (RNs) and total nursing staff. Ratings are adjusted based on the level of care residents require and are compared to state and national benchmarks.
▼ 69.9% Below NC avg. ▼ 69.9% Below NC avg.Click the badge to see the full State ranking.Click here to see the full State ranking.
Quality Measures Info Based on clinical and physical health indicators reported to CMS, such as hospital readmissions, falls, pressure ulcers, and improvements in mobility. These measures reflect how well residents' health needs are being managed.
▲ 12.4% Above NC avg. ▲ 12.4% Above NC avg.Click the badge to see the full State ranking.Click here to see the full State ranking.

Staffing hours breakdown

Info Daily nursing hours per resident by staff type, reported to CMS. Higher is generally better — compare this facility to state and national averages to see where staffing stands.

Hours per resident per day — compared to North Carolina state averages

Total nursing care / resident Info This home is ranked 70th out of 90 homes in North Carolina. Total adjusted nursing hours per resident per day, combining RN, LPN, and aide time. CMS adjusts this for case-mix so facilities can be fairly compared.
3h 23m per day
Rank #70 / 90Nurse hours — State benchmarkedThis home is ranked 70th out of 90 homes in North Carolina. Shows adjusted nurse hours per resident per day benchmarked to the North Carolina average, with a ranking across 90 North Carolina SNFs. More hours mean more direct care. The national average is about 3.5 hrs; below 3.0 is a red flag.Click the rank badge to see the full State ranking.Click here to see the full State ranking.
This facility North Carolina avg (4h 55m per day)
vs North Carolina avg
-31%
Staff typeHours / Day / Residentvs state avg
Weekend Total Nursing Info Combined nursing hours (RN + LPN + Nurse Aide) per resident per day on weekends. Staffing often drops on weekends — this figure reveals whether the facility maintains adequate coverage outside of weekday hours. 2h 8m per day

Types of Care at Champions Assisted Living at the Davis Community

Independent Living Memory Care Nursing Home Assisted Living

Capacity and availability

This home usually has availability

Occupancy lower than 85% suggests more openings may be available.

Lower occupancy than the North Carolina average: 76.4%
Occupancy rate 60.7% Rank #176 / 264Occupancy rate — State benchmarkedThis home is ranked 176th out of 264 homes in North Carolina. Shows this facility's occupancy rate versus the North Carolina average, with its Statewide rank out of 264. Higher occupancy signals strong local demand and financial stability.Click the rank badge to see the full State ranking.Click here to see the full State ranking.
Avg. Length of Stay 90 days
Occupancy rate
60.7% Rank #176 / 264Occupancy rate — State benchmarkedThis home is ranked 176th out of 264 homes in North Carolina. Shows this facility's occupancy rate versus the North Carolina average, with its Statewide rank out of 264. Higher occupancy signals strong local demand and financial stability.Click the rank badge to see the full State ranking.Click here to see the full State ranking.
Avg. Length of Stay
90 days
Walk Score
Walk Score: 6 / 100 Rank #485 / 572Walk Score — State benchmarkedThis home is ranked 485th out of 572 homes in North Carolina. Shows how walkable this facility's neighborhood is compared to the average Walk Score across North Carolina SNFs. Higher scores benefit residents, families, and staff.Click the rank badge to see the full State ranking.Click here to see the full State ranking.
Car-dependent. Most errands require a car, with limited nearby walkable options.

About this community

Safety & Compliance

Wheelchair Accessible
Emergency SystemsEmergency response systems in each bedroom and bathroom.

Staffing

Key information about the people who lead and staff this community.

Leadership

ContactMr. Jim Wood

Therapy & Rehabilitation

2 services
Rehabilitation Services
Respite Care

Staffing & Medical

1 service
24-Hour Staffing

Amenities & Lifestyle

Private And Semi-Private Suites
Emergency Response Systems
On-Site 24-Hour Nursing Professionals
Special Care Center For Memory Impairments
Excellent Staff-To-Resident Ratio
Respite Stays
Clinic Services
Weekly Housekeeping
Restaurant-Style Dining
Wooded Walking Path
Rose Garden
In-House Beauty Salon/Barber Shop
Wide Variety Of Programming
Weekly Church Services
Transportation Services
Spa Rooms
Laundry Services
Cable Television
On-Site Therapy
Counseling And Support Services
Specific ProgramsFitness Zone, Arts & Culture, Salon & Spa, Magnolia Event Center
Religious ServicesWeekly church services on location.
Operating HoursMonday-Sunday: 9am-5pm

Dining & Nutrition

Food DescriptionRestaurant-style dining with a focus on nutritious meals.

Contact Champions Assisted Living at the Davis Community

Health Inspection History

Inspections since 2022
Total health inspections 4

North Carolina average 4


Last Health inspection on Oct 2025

Total health citations
14 Rank #45 / 95Health citations — State benchmarkedThis home is ranked 45th out of 95 homes in North Carolina. Shows this facility's total health deficiency citations benchmarked to the North Carolina State average, with a ranking across all 95 NC SNFs. Lower citation counts earn a better rank.Click the rank badge to see the full State ranking.Click here to see the full State ranking.

North Carolina average 20.9

Citations per inspection
3.5 Rank #36 / 95Citations per inspection — State benchmarkedThis home is ranked 36th out of 95 homes in North Carolina. Shows average deficiency citations per CMS inspection for this facility versus the North Carolina mean across 95 SNFs with citation data. Lower is better.Click the rank badge to see the full State ranking.Click here to see the full State ranking.

North Carolina average 4.99


Health citations are formal notices following inspections when they fail to comply with safety and care standards.

8 of 14 citations resulted from standard inspections; 1 of 14 resulted from complaint investigations; and 5 of 14 came from combined inspections (standard and complaint).

Breakdown of citation severity (last 4 years)
Critical Health citations
2
54% worse than North Carolina average

North Carolina average: 1.3


Serious Health citations
1 Rank #1 / 36Serious citations (G–I) — State benchmarkedThis home is ranked 1st out of 36 homes in North Carolina. Shows G–I scope serious health citations for this facility versus other North Carolina SNFs. Lower counts rank better.Click the rank badge to see the full State ranking.Click here to see the full State ranking.
11% worse than North Carolina average

North Carolina average: 0.9

2 critical citations North Carolina average: 1.3

1 serious citation North Carolina average: 0.9

8 moderate citations North Carolina average: 17.1

3 minor citations North Carolina average: 1.6
Citations history (last 4 years)
Quality of Care critical citation Oct 20, 2025
Corrected

Administration moderate citation Apr 17, 2025
Corrected

Nutrition moderate citation Apr 17, 2025
Corrected

Care Planning minor citation Apr 17, 2025
Corrected

Staffing Data

Reporting period: October 1 – December 31, 2025 (Q4 2025). Source: CMS Payroll-Based Journal report.

Total staff 270
Employees 111
Contractors 159
Staff to resident ratio 3.18:1
77% better than North Carolina average
North Carolina average ratio: 1.80:1 North Carolina average ratio: 1.80:1See full North Carolina ranking
Avg staff/day 67
Average shift 6.9 hours
14% worse than North Carolina average
North Carolina average: 8 hours North Carolina average shift: 8 hoursSee full North Carolina ranking
Total staff hours (quarter) 42,767

Nursing staff breakdown

Q4 2025 · Oct 1 – Dec 31 More info This data comes from the CMS Payroll-Based Journal report covering October 1 – December 31, 2025.
Registered Nurse

Manages medical care and health needs.

RN Staff 20
Average shift length Info Average shift length. Calculated as total hours divided by days worked and average staff per day. 8.3 hours

This role is partially covered by contractors.

Licensed Practical Nurse

Assists with medical care and medications.

LPN Staff 68
Average shift length Info Average shift length. Calculated as total hours divided by days worked and average staff per day. 7.2 hours

This role is partially covered by contractors.

Certified Nursing Assistant

Helps with daily care and mobility.

CNA Staff 123
Average shift length Info Average shift length. Calculated as total hours divided by days worked and average staff per day. 7 hours

This role is partially covered by contractors.

Contractor staffing

Q4 2025 · Oct 1 – Dec 31 More info This data comes from the CMS Payroll-Based Journal report covering October 1 – December 31, 2025.

Total hours from contractors

38.6%

16,497 contractor hours this quarter

Certified Nursing Assistant: 76 Licensed Practical Nurse: 45 Registered Nurse: 9 Respiratory Therapy Technician: 8 Speech Language Pathologist: 6 Physical Therapy Aide: 4 Qualified Social Worker: 3 Physical Therapy Assistant: 3 Nurse Practitioner: 2 Occupational Therapy Aide: 1 Occupational Therapy Assistant: 1 Medical Director: 1

Staff by category

Q4 2025 · Oct 1 – Dec 31 More info This data comes from the CMS Payroll-Based Journal report covering October 1 – December 31, 2025.
Certified Nursing Assistant477612319,59192100%7
Licensed Practical Nurse2345689,60992100%7.2
Registered Nurse119203,20092100%8.3
Nurse Aide in Training5051,5098997%8.9
RN Director of Nursing7071,4627683%6.5
Clinical Nurse Specialist7071,2589199%6.3
Respiratory Therapy Technician0881,1677582%5.7
Physical Therapy Aide0447267986%4.8
Nurse Practitioner2245446166%8.5
Other Dietary Services Staff4045087076%5.9
Medication Aide/Technician1014745257%9.1
Administrator1014645863%8
Speech Language Pathologist0664417480%4.5
Occupational Therapy Aide0114025863%6.9
Physical Therapy Assistant0333827177%5
Mental Health Service Worker1013445560%6.3
Other Social Services Staff2023175257%6.1
Qualified Social Worker0332736571%4.1
Occupational Therapy Assistant01174910%8.2
Medical Director0112433%8
123 Certified Nursing Assistant
% of Days 100%
68 Licensed Practical Nurse
% of Days 100%
20 Registered Nurse
% of Days 100%
5 Nurse Aide in Training
% of Days 97%
7 RN Director of Nursing
% of Days 83%
7 Clinical Nurse Specialist
% of Days 99%
8 Respiratory Therapy Technician
% of Days 82%
4 Physical Therapy Aide
% of Days 86%
4 Nurse Practitioner
% of Days 66%
4 Other Dietary Services Staff
% of Days 76%
1 Medication Aide/Technician
% of Days 57%
1 Administrator
% of Days 63%
6 Speech Language Pathologist
% of Days 80%
1 Occupational Therapy Aide
% of Days 63%
3 Physical Therapy Assistant
% of Days 77%
1 Mental Health Service Worker
% of Days 60%
2 Other Social Services Staff
% of Days 57%
3 Qualified Social Worker
% of Days 71%
1 Occupational Therapy Assistant
% of Days 10%
1 Medical Director
% of Days 3%

Penalties and fines

Includes penalties issued in 2023-2024

Federal penalties imposed by CMS for regulatory violations, including civil money penalties (fines) and denials of payment for new Medicare/Medicaid admissions.

Source: CMS Penalties Database (Data as of Jan 2026)

Total fines amount $12K Rank #58 / 97Federal fines — State benchmarkedThis home is ranked 58th out of 97 homes in North Carolina. Shows this facility's cumulative CMS federal fine dollars versus the North Carolina average among facilities with fines, and where it ranks among 97 skilled nursing facilities in the pool. Lower total dollars mean a better rank.Click the rank badge to see the full State ranking.Click here to see the full State ranking.
84% lower than North Carolina average

North Carolina average: $76K

Number of fines 2
15% fewer fines than North Carolina average

North Carolina average: 2.3

Payment Denials Info Serious action where Medicare and/or Medicaid temporarily stops payments for new residents until issues are fixed. 0
100% fewer payment denials than North Carolina average

North Carolina average: 0.4

Fines amount comparison
This facility $12K
North Carolina average $76K
Penalty History

Penalties are imposed by CMS for violations of federal nursing home regulations.

2 penalties in the past 3 years

Multiple penalties were reported in the last 3 years.

Civil Money Penalty Info Fines imposed for noncompliance, which can be assessed per day or per instance of violation. Feb 8, 2024
$9K
Civil Money Penalty Info Fines imposed for noncompliance, which can be assessed per day or per instance of violation. May 30, 2023
$3K

Last updated: Jan 2026

Quality of care over time

These measures show how residents usually do over time at this home, based on health outcomes and preventive care.

High-risk clinical events score Info A composite score based on pressure ulcers, falls with injury, weight loss, walking ability decline, and activities of daily living decline. 12.9
13% worse than North Carolina average

North Carolina average: 11.5

Functional decline score Info A composite score based on activities of daily living decline, walking ability decline, and incontinence. 20.5
In line with North Carolina average

North Carolina average: 20.6

Long-stay resident measures
Need for Help with Daily Activities Increased Info Percent of long-stay residents whose need for help with daily activities has increased 19.1%
9% worse than North Carolina average

North Carolina average: 17.5%

Walking Ability Worsened Info Percent of long-stay residents whose ability to move independently worsened 25.8%
11% worse than North Carolina average

North Carolina average: 23.3%

Low Risk Residents with Bowel/Bladder Incontinence Info Percent of low risk long-stay residents who lose control of their bowels or bladder 16.6%
23% better than North Carolina average

North Carolina average: 21.4%

Falls with Major Injury Info Percent of long-stay residents experiencing one or more falls with major injury 4.5%
23% worse than North Carolina average

North Carolina average: 3.6%

High Risk Residents with Pressure Ulcers Info Percent of long-stay high risk residents with pressure ulcers 4.1%
35% better than North Carolina average

North Carolina average: 6.3%

Urinary Tract Infection Info Percent of long-stay residents with a urinary tract infection 0.8%
71% better than North Carolina average

North Carolina average: 2.6%

Lost Too Much Weight Info Percent of long-stay residents who lose too much weight 11.1%
51% worse than North Carolina average

North Carolina average: 7.4%

Depressive Symptoms Info Percent of long-stay residents who have depressive symptoms 0.8%
82% better than North Carolina average

North Carolina average: 4.4%

Antipsychotic Use Info Percent of long-stay residents who received an antipsychotic medication 18.3%
37% worse than North Carolina average

North Carolina average: 13.4%

Pneumococcal Vaccine Info Percent of long-stay residents assessed and appropriately given the pneumococcal vaccine 98.5%
8% better than North Carolina average

North Carolina average: 91.6%

Influenza Vaccine Info Percent of long-stay residents assessed and appropriately given the seasonal influenza vaccine 94.1%
In line with North Carolina average

North Carolina average: 94.1%

Short-stay resident measures
Pneumococcal Vaccine Info Percent of short-stay residents assessed and appropriately given the pneumococcal vaccine 86.0%
8% better than North Carolina average

North Carolina average: 79.9%

Antipsychotic medication increase Info Percent of short-stay residents who newly received an antipsychotic medication 1.1%
23% better than North Carolina average

North Carolina average: 1.5%

Influenza Vaccine Info Percent of short-stay residents assessed and appropriately given the seasonal influenza vaccine 71.9%
8% worse than North Carolina average

North Carolina average: 78.1%

Breakdown by payment type

Medicare

53% of new residents, usually for short-term rehab.

Typical stay 23 days

Private pay

41% of new residents, often for short stays.

Typical stay 3 - 4 months

Medicaid

6% of new residents, often for long-term daily care.

Typical stay 1 years

Facility Characteristics

Source: CMS Long-Term Care Facility Characteristics (Data as of Jan 2026)

Total residents 85
Medicare
8
9.4% of residents
Medicaid
54
63.5% of residents
Private pay or other
23
27.1% of residents
Programs & Services
Residents Group

Residents meet regularly to discuss policies, care quality, and activities

Active Resident Council

Organized group of residents that meets regularly to discuss facility policies, quality of life, and activities.

Finances and operations

Voluntary non-profit community
Home revenue
$33.7M
Operating deficit
-$1.7M
Voluntary non-profit community
Home revenue
$33.7M Rank #17 / 97Revenue — State benchmarkedThis home is ranked 17th out of 97 homes in North Carolina. Shows this facility's annual revenue compared to the North Carolina SNF average. Higher revenue generally means more resources for staffing and capital — read alongside Payroll %.Click the rank badge to see the full State ranking.Click here to see the full State ranking.
Operating deficit
-$1.7M
Payroll costs Info The portion of the home's budget spent on staff, including nurses, caregivers, and other employees who support care and operations. Rank #8 / 97Payroll — State benchmarkedThis home is ranked 8th out of 97 homes in North Carolina. Shows total annual staff payroll benchmarked to the North Carolina average. Higher payroll investment relative to peers often signals better staffing and less reliance on cheaper contract labor.Click the rank badge to see the full State ranking.Click here to see the full State ranking.
$16.6M
49.2% of revenue Rank #29 / 97Payroll % — State benchmarkedThis home is ranked 29th out of 97 homes in North Carolina. Shows payroll as a percentage of revenue versus the North Carolina average. Well-run North Carolina SNFs typically land around 49–62% — the top third Statewide. Below 25% may signal understaffing or heavy agency use — read with Staffing ratings.Click the rank badge to see the full State ranking.Click here to see the full State ranking.
Other operating costs Info All remaining costs needed to run the home, such as food, utilities, building maintenance, supplies and administrative expenses.
$18.8M
Total costs $35.3M

What does this home offer?

Pets allowed icon
Pets allowed icon

Pets Allowed

Housing options icon

Housing Options: 1 Bed / 2 Bed

Building type icon
Building type icon

Building Type: Mid-rise

Transportation services icon

Transportation Services

Fitness and recreation icon

Fitness and Recreation

Who this home usually serves

TYPE OF STAY

Mostly short-term rehab stays

Most residents typically stay for a few weeks or months before returning home or moving on.

Living Spaces & Floor Plans for Champions Assisted Living at the Davis Community

Champions Assisted Living At The Davis Community P1
Champions Assisted Living At The Davis Community P3
Champions Assisted Living At The Davis Community P4
Champions Assisted Living At The Davis Community P2

Places of interest near Champions Assisted Living at the Davis Community

Address 11.3 miles from city center Info Estimated distance in miles from Wilmington's city center to Champions Assisted Living at the Davis Community's address, calculated via Google Maps. — 1.67 miles to nearest hospital (Allscripts)

Calculate Travel Distance to Champions Assisted Living at the Davis Community

Add your location

Address

Financial Assistance for
Nursing Home in North Carolina

Champions Assisted Living at the Davis Community is located in Wilmington, North Carolina.
Here are the financial assistance programs available to residents in North Carolina.

Get Financial aid guidance

Community Alternatives Program for Disabled Adults

NC Medicaid CAP/DA

Age 65+ or disabled
General North Carolina resident, Medicaid- eligible, nursing home-level care need.
Income Limits (2025) ~$2,829/month 300% FBR, individual
Asset Limits $2,000 (individual), $3,000 (couple).
NC

High demand; waitlists common in urban areas.

Benefits
Personal care (5-7 hours/day) Respite (240 hours/year) Adult day care ($60/day) Home modifications ($1,500 avg.)

North Carolina Senior Care Options

NC SCO (via NFCSP)

Age Caregiver of someone 60+ (or with dementia)
General North Carolina resident.
Income Limits No strict limit; prioritizes low-income.
Asset Limits Not applicable.
NC

Limited slots; rural/urban balance.

Benefits
In-home respite (4-6 hours/day) Adult day care (~$60/day) Short-term facility care (up to 5 days)

Program of All-Inclusive Care for the Elderly (PACE)

North Carolina PACE (e.g., PACE of the Triad)

Age 55+
General NC resident (specific counties), NFLOC, safe with PACE support.
Income Limits (2025) ~$2,829/month (Medicaid-eligible); private pay option available.
Asset Limits $2,000 (individual), $3,000 (couple) for Medicaid enrollees.
NC

Available in 10+ counties (e.g., Guilford, Wake); multiple providers (e.g., PACE of the Southern Piedmont).

Benefits
Personal care (5-7 hours/day) Medical care Meals Transportation Respite Therapies

In-Home Aide Services

North Carolina In-Home Aide Services

Age 60+
General NC resident, unable to perform 1+ ADL, at risk of nursing home placement.
Income Limits (2025) No strict cap; prioritizes low-income ~$24,980/year
Asset Limits Not assessed; need-based.
NC

Family can be aides; varies by county funding.

Benefits
Personal care (5-20 hours/week) Meal prep Respite (~5 days/year) Errands

Medicare Savings Program (MSP)

North Carolina Medicare Savings Program

Age 65+ or disabled
General NC resident, Medicare Part A/B.
Income Limits (2025) ~$2,510/month (QMB), ~$3,380/month (SLMB), ~$3,598/month (QI)—individual.
Asset Limits $9,430 (individual), $14,130 (couple).
NC

Three tiers; no waitlist; includes Extra Help for Part D.

Benefits
Covers Part B premiums ($174.70/month) Deductibles ($240/year) Copays (~20%)

VA Aid and Attendance (A&A) and Housebound Benefits

North Carolina VA Aid and Attendance/Housebound

Age 65+ or disabled veteran/spouse
General NC resident, wartime service, need for ADL help (A&A) or homebound.
Income Limits (2025) Net income < ~$1,984/month (veteran with dependent, A&A); pension offsets income.
Asset Limits ~$155,356 net worth limit
NC

High veteran demand in rural/urban areas.

Benefits
Cash (~$1,433-$2,642/month veteran, ~$951-$1,318 spouse) for care costs (e.g., in-home, assisted living)

Urgent Repair Program (URP)

North Carolina Urgent Repair Program

Age 60+ prioritized
General NC resident, homeowner, low-income.
Income Limits (2025) ~$30,258/year 50% AMI, varies by county
Asset Limits Not strictly assessed; home value considered.
NC

Forgivable at $2,000/year; statewide via local partners.

Benefits
Repairs (~$8,000-$12,000 avg.) for safety (e.g., roofs, heating, accessibility)

State/County Special Assistance (SA)

North Carolina Special Assistance

Age 65+ (or disabled)
General NC resident, in licensed adult care home, low-income.
Income Limits (2025) ~$1,255/month (individual, 100% FPL); varies by facility rate.
Asset Limits $2,000 individual
NC

Covers assisted living; counties supplement state funds.

Benefits
Cash (~$1,200-$1,500/month) for room/board; Medicaid covers care services

Compare Nursing Home around Wilmington

The information below is reported by the North Carolina Department of Health and Human Services, Division of Health Service Regulation.

2 facilities compared · CMS & NC Dept. of Health data

Filter by care type
Carolina Bay at Autumn Hall
NH

Nursing Home Licensed facility providing 24/7 skilled nursing care for residents with complex, ongoing medical needs. Staffed by RNs, LPNs, and CNAs. Inspected and star-rated annually by CMS. Accepts Medicare (short-term rehab) and Medicaid (long-term care).

AL

Assisted Living A licensed, long-term care setting for seniors or individuals with disabilities who need help with daily activities — like bathing, dressing, and medication management — but not 24-hour skilled nursing. Offers housing, meals, and around-the-clock support while aiming to maximize resident independence.

MC

Memory Care Secured, specialized care for people living with Alzheimer's or dementia. Staff trained in cognitive impairment, with higher staff-to-resident ratios and an environment designed to reduce confusion and wandering risk.

Wilmington (Windemere)108 89.5% +17%4.36 +14%+10%$063.0-28 18 Wilmington Ah Senior Housing Jv Opco LLC$14.0M$5.2M37.5%345571
Champions Assisted Living at the Davis Community
NH

Nursing Home Licensed facility providing 24/7 skilled nursing care for residents with complex, ongoing medical needs. Staffed by RNs, LPNs, and CNAs. Inspected and star-rated annually by CMS. Accepts Medicare (short-term rehab) and Medicaid (long-term care).

AL

Assisted Living A licensed, long-term care setting for seniors or individuals with disabilities who need help with daily activities — like bathing, dressing, and medication management — but not 24-hour skilled nursing. Offers housing, meals, and around-the-clock support while aiming to maximize resident independence.

IL

Independent Living Lifestyle-focused communities for older adults offering dining, activities, and transportation with minimal personal care. Best for active, independent seniors who want community without medical support.

MC

Memory Care Secured, specialized care for people living with Alzheimer's or dementia. Staff trained in cognitive impairment, with higher staff-to-resident ratios and an environment designed to reduce confusion and wandering risk.

N

Nursing

Wilmington179 60.7% -21%3.39 -19%-15%$12.0k143.5396 6 Charles Long$33.7M$16.6M49.2%345160

Frequently Asked Questions about Champions Assisted Living at the Davis Community

Is Champions Assisted Living at the Davis Community in a walkable area?

Champions Assisted Living at the Davis Community has a walk score of 6. Car-dependent. Most errands require a car, with limited nearby walkable options.

What is the phone number of Champions Assisted Living at the Davis Community?

(910) 799-0232 will put you in contact with the team at Champions Assisted Living at the Davis Community.

Is Champions Assisted Living at the Davis Community Medicare or Medicaid certified?

Yes — Champions Assisted Living at the Davis Community is a CMS-certified provider of Medicare and Medicaid.

Guides for Better Senior Living

Care Cost Calculator: See Prices in Your Area

Nursing Home Data Explorer

Don’t Wait Too Long: 7 Red Flag Signs Your Parent Needs Assisted Living Now

The True Cost of Assisted Living in 2025 – And How Families Are Paying For It

Understanding Senior Living Costs: Pricing Models, Discounts & Financial Assistance

Explore Open Rooms
1 Contact details
2 What type of senior care service are you looking for?
3 What budget do you have in mind for senior care?
4 How soon do you need to find care?
5 Additional details

Thank you for your interest!

Our team will be in touch shortly to help with next steps.