Cedarbrook Senior Care and Rehab
Nursing Home, Hospice Care, Independent Living, Memory Care, Palliative Care & Respite Care · Allentown, PA
CMS overall rating Info CMS (the Centers for Medicare & Medicaid Services) is the federal agency that rates nursing home quality. Its Overall Rating runs from 1 to 5 stars, combining health inspections, staffing, and quality measures, with inspections weighted most heavily.

Cedarbrook Senior Care and Rehab

Nursing Home, Hospice Care, Independent Living, Memory Care, Palliative Care & Respite Care · Allentown, PA
CMS overall rating Info CMS (the Centers for Medicare & Medicaid Services) is the federal agency that rates nursing home quality. Its Overall Rating runs from 1 to 5 stars, combining health inspections, staffing, and quality measures, with inspections weighted most heavily.
Calculator: See prices in your area
Cedarbrook Senior Care and Rehab accepts Medicare, Medicaid, and private pay.

Overview of Cedarbrook Senior Care and Rehab

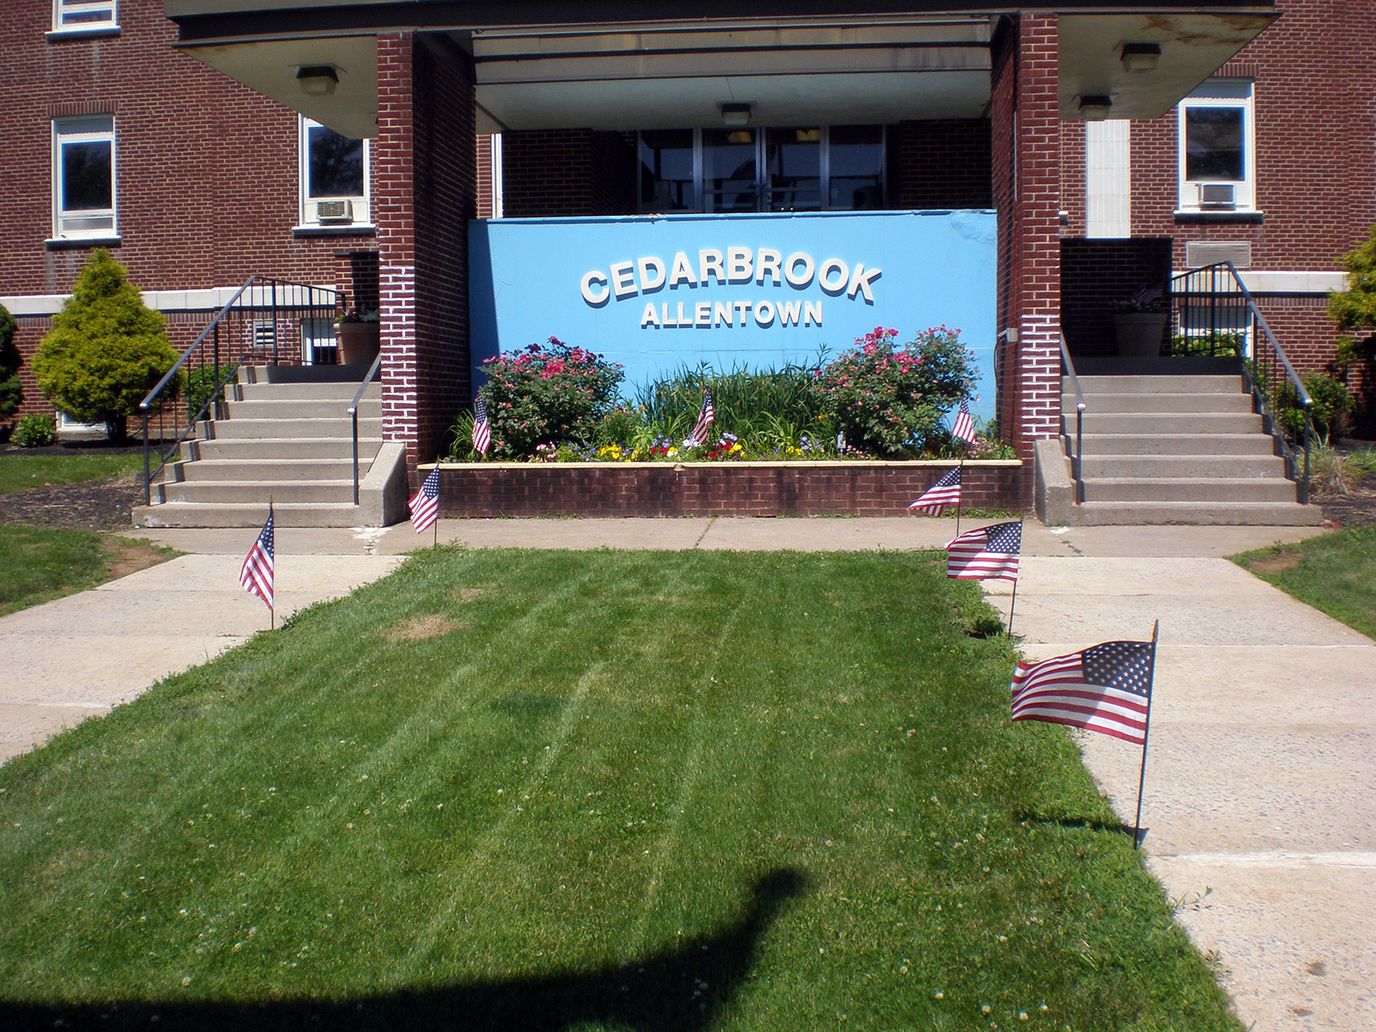
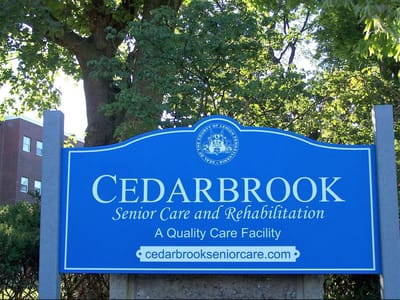
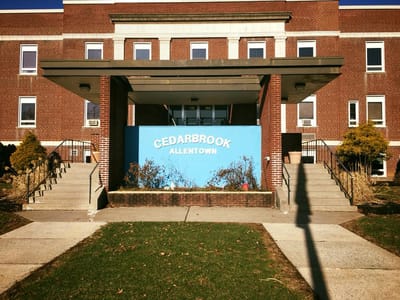
Cedarbrook Senior Care and Rehab, situated in the heart of Allentown, Pennsylvania, has been consistently setting the benchmark for delivering exceptional short and long-term care since the 1840s. With a rich service history, this community has proven itself a premier choice for seniors seeking top-tier care and support. Distinguished by its diversity and commitment, Cedarbrook offers an array of services that not only cater to practical needs but also enrich the lives of its residents, ensuring a more meaningful and fulfilling experience.

Boasting a licensed capacity of 473 beds, Cedarbrook Senior Care and Rehab provides a comprehensive range of care options from hospice care and traditional long-term care to memory support, respite care, and short-term rehabilitation. Their professional touch is evident across all facets, creating an environment where seniors receive expert therapeutic recreation, skilled nursing, and holistic care that addresses their physical, emotional, and social well-being. With its storied legacy of care and dedication, Cedarbrook remains a beacon of excellence in the realm of senior care, offering a supportive and enriching haven for individuals seeking quality living in the heart of Allentown.

Quality ratings

Measured by Centers for Medicare & Medicaid Services (CMS)

Overall rating Info The Overall CMS Rating combines results from health inspections, staffing levels and quality measures. Health inspections carry the most weight. Staffing and quality scores can increase or decrease the final rating based on performance compared to state and national standards.
▲ 66.8% Above PA avg. ▲ 66.8% Above PA avg.PA average: 3.0Click the badge to see the full State ranking.Click here to see the full State ranking.
Health Inspection Info Based on the results of the facility's three most recent standard inspections and any complaint investigations. CMS reviews the number, scope, and severity of deficiencies, with more recent findings weighted more heavily.
▲ 43.0% Above PA avg. ▲ 43.0% Above PA avg.PA average: 2.8Click the badge to see the full State ranking.Click here to see the full State ranking.
Staffing Info Measures average nursing staff hours per resident per day, including Registered Nurses (RNs) and total nursing staff. Ratings are adjusted based on the level of care residents require and are compared to state and national benchmarks.
▲ 47.4% Above PA avg. ▲ 47.4% Above PA avg.PA average: 3.4Click the badge to see the full State ranking.Click here to see the full State ranking.
Quality Measures Info Based on clinical and physical health indicators reported to CMS, such as hospital readmissions, falls, pressure ulcers, and improvements in mobility. These measures reflect how well residents' health needs are being managed.
▲ 17.9% Above PA avg. ▲ 17.9% Above PA avg.PA average: 3.4Click the badge to see the full State ranking.Click here to see the full State ranking.

Staffing hours breakdown

Info Daily nursing hours per resident by staff type, reported to CMS. Higher is generally better — compare this facility to state and national averages to see where staffing stands.

Hours per resident per day — compared to Pennsylvania state averages

Total nursing care / resident Info This home is ranked 70th out of 207 homes in Pennsylvania for nurse hours. Total adjusted nursing hours per resident per day, combining RN, LPN, and aide time. CMS adjusts this for case-mix so facilities can be fairly compared.
4h 38m per day
Rank #70 / 207Nurse hours — State benchmarkedThis home is ranked 70th out of 207 homes in Pennsylvania. Shows adjusted nurse hours per resident per day benchmarked to the Pennsylvania average, with a ranking across 207 Pennsylvania facilities. More hours mean more direct care. The national average is about 3.5 hrs; below 3.0 is a red flag.Rankings are based only on facilities in Pennsylvania that report data for that category. Facilities without available data are excluded from the ranking.Click the rank badge to see the full State ranking.Click here to see the full State ranking.
This facility Pennsylvania avg (4h 9m per day)
vs Pennsylvania avg
+12%

3 of 6 metrics below state avg

Standout metric Nurse Aide is +10% above state avg
Staff typeHours / Day / Residentvs state avg
Registered Nurse (RN) Info RNs hold the highest nursing license and can assess residents, interpret test results, and direct care plans. More RN hours per day often signals stronger clinical oversight and faster response to health changes. 44m per day ▼ 7% State avg: 47m per day · National avg: 41m per day
LPN / LVN Info Licensed Practical Nurses (LPNs) or Licensed Vocational Nurses (LVNs) deliver routine hands-on care — medication administration, wound dressing, and monitoring vital signs. They work under RN supervision and make up a large share of daily bedside care. 57m per day ▲ 4% State avg: 55m per day · National avg: 52m per day
Nurse Aide Info Certified Nurse Aides (CNAs) provide the most direct day-to-day assistance: bathing, dressing, feeding, and mobility. Nurse aide hours are typically the largest staffing category and directly affect residents' quality of life. 2h 25m per day ▲ 10% State avg: 2h 12m per day · National avg: 2h 20m per day
Weekend Total Nursing Info Combined nursing hours (RN + LPN + Nurse Aide) per resident per day on weekends. Staffing often drops on weekends — this figure reveals whether the facility maintains adequate coverage outside of weekday hours. 3h 41m per day ▲ 5% State avg: 3h 31m per day · National avg: 3h 26m per day
Physical Therapist Info Hours per resident per day provided by licensed Physical Therapists (PTs) or PT Assistants. PT services help residents recover mobility after injury or illness and are especially important for post-acute (short-stay) rehabilitation. 4m per day ▼ 37% State avg: 6m per day · National avg: 4m per day
Weekend RN Info Registered nurse hours specifically on weekends. Facilities sometimes reduce RN presence on Saturdays and Sundays — a low weekend RN figure compared to weekday hours can indicate reduced clinical oversight when most administrative staff are absent. 30m per day ▼ 8% State avg: 33m per day · National avg: 28m per day

Capacity and availability

This home usually has availability

Lower occupancy than the Pennsylvania average: 78.7%
Occupancy rate
75.8% Rank #208 / 518Occupancy rate — State benchmarkedThis home is ranked 208th out of 518 homes in Pennsylvania. Shows this facility's occupancy rate versus the Pennsylvania average, with its Statewide rank out of 518. Higher occupancy signals strong local demand and financial stability.Rankings are based only on facilities in Pennsylvania that report data for that category. Facilities without available data are excluded from the ranking.Click the rank badge to see the full State ranking.Click here to see the full State ranking.
Avg. Length of Stay
333 days
Bed community size
670-bed community Rank #1 / 555Bed count — State benchmarkedThis home is ranked 1st out of 555 homes in Pennsylvania. Shows this facility's certified or reported bed count compared to other Pennsylvania facilities. Larger communities may offer more amenities, programs, and on-site services for residents and families.Rankings are based only on facilities in Pennsylvania that report data for that category. Facilities without available data are excluded from the ranking.Click the rank badge to see the full State ranking.Click here to see the full State ranking.
A large-scale community that may provide a wide range of amenities, services, and structured programs.
Walk Score
Walk Score: 22 / 100 Rank #521 / 668Walk Score — State benchmarkedThis home is ranked 521st out of 668 homes in Pennsylvania. Shows how walkable this facility's neighborhood is compared to the average Walk Score across Pennsylvania facilities. Higher scores benefit residents, families, and staff.Rankings are based only on facilities in Pennsylvania that report data for that category. Facilities without available data are excluded from the ranking.Click the rank badge to see the full State ranking.Click here to see the full State ranking.
Car-dependent. Most errands require a car, with limited nearby walkable options.

About this community

Awards

Newsweek Best Nursing Homes 2024

Payment & Insurance

2 services
Accept Medicaid
Accept Medicare

Therapy & Rehabilitation

2 services
Rehabilitation Services
Respite Care

Staffing & Medical

2 services
Doctor on Staff
24-Hour Staffing

Amenities & Lifestyle

Barber And Beauty Services
Chaplain Services
Dining Services
Financial Management
Hospice
Interdisciplinary Plan Of Care Meetings
Laundry
Medical Services
Nursing Services/Restorative Nursing
Psychiatric/Psychological Services
Rehabilitative Services
Residents Council
Therapeutic Recreation / Life Enrichment
Specific ProgramsPalliative Care/Hospice, Brookview Independent Living
Volunteer Program

Contact Cedarbrook Senior Care and Rehab

Staffing Data

Reporting period: October 1 – December 31, 2025 (Q4 2025). Source: CMS Payroll-Based Journal report.

Total staff 718
Employees 657
Contractors 61
Staff to resident ratio 1.44 : 1
21% fewer staff per resident than Pennsylvania average
Pennsylvania average ratio: 1.83 : 1 Pennsylvania average ratio: 1.83 : 1See full Pennsylvania ranking
Avg staff/day 320
Average shift 7.5 hours
0% compared with Pennsylvania average
Pennsylvania average: 7.8 hours Pennsylvania average shift: 7.8 hoursSee full Pennsylvania ranking
Total staff hours (quarter) 220,410

Nursing staff breakdown

Q4 2025 · Oct 1 – Dec 31 More info This data comes from the CMS Payroll-Based Journal report covering October 1 – December 31, 2025.
Registered Nurse

Manages medical care and health needs.

RN Staff Info 82 total: 81 full-time employees and 1 contractor. 82
Average shift length Info Average shift length. Calculated as total hours divided by days worked and average staff per day. 7.3 hours
Licensed Practical Nurse

Assists with medical care and medications.

LPN Staff Info 149 total: 148 full-time employees and 1 contractor. 149
Average shift length Info Average shift length. Calculated as total hours divided by days worked and average staff per day. 7.7 hours
Certified Nursing Assistant

Helps with daily care and mobility.

CNA Staff Info 353 total: 350 full-time employees and 3 contractors. 353
Average shift length Info Average shift length. Calculated as total hours divided by days worked and average staff per day. 7.6 hours

Contractor staffing

Q4 2025 · Oct 1 – Dec 31 More info This data comes from the CMS Payroll-Based Journal report covering October 1 – December 31, 2025.

Total hours from contractors

7%

15,398 contractor hours this quarter

Physical Therapy Aide: 12 Speech Language Pathologist: 11 Respiratory Therapy Technician: 10 Physical Therapy Assistant: 9 Qualified Social Worker: 8 Occupational Therapy Aide: 5 Certified Nursing Assistant: 3 Licensed Practical Nurse: 1 Registered Nurse: 1 Occupational Therapy Assistant: 1

Staff by category

Q4 2025 · Oct 1 – Dec 31 More info This data comes from the CMS Payroll-Based Journal report covering October 1 – December 31, 2025.
Certified Nursing Assistant3503353112,95692100%7.6
Licensed Practical Nurse148114944,64792100%7.7
Registered Nurse8118219,83392100%7.3
Clinical Nurse Specialist3603613,74592100%7.3
Other Dietary Services Staff160164,82992100%6.8
Speech Language Pathologist011113,6128188%7.5
Mental Health Service Worker100103,5876470%7.1
Respiratory Therapy Technician010102,9288390%7.5
Physical Therapy Aide012122,8118491%7
Dietitian7072,7149098%7.4
Physical Therapy Assistant0992,0388896%7.1
Qualified Social Worker0881,7737480%7.1
Occupational Therapy Aide0551,7646975%8
Other Social Services Staff2028216368%7.3
Nurse Practitioner1014716470%7.4
Dental Services Staff1014596267%7.4
Administrator1014556267%7.3
Qualified Activities Professional2023905257%7.5
Occupational Therapy Assistant0113844953%7.8
Medical Director2021952628%7.5
353 Certified Nursing Assistant
% of Days 100%
149 Licensed Practical Nurse
% of Days 100%
82 Registered Nurse
% of Days 100%
36 Clinical Nurse Specialist
% of Days 100%
16 Other Dietary Services Staff
% of Days 100%
11 Speech Language Pathologist
% of Days 88%
10 Mental Health Service Worker
% of Days 70%
10 Respiratory Therapy Technician
% of Days 90%
12 Physical Therapy Aide
% of Days 91%
7 Dietitian
% of Days 98%
9 Physical Therapy Assistant
% of Days 96%
8 Qualified Social Worker
% of Days 80%
5 Occupational Therapy Aide
% of Days 75%
2 Other Social Services Staff
% of Days 68%
1 Nurse Practitioner
% of Days 70%
1 Dental Services Staff
% of Days 67%
1 Administrator
% of Days 67%
2 Qualified Activities Professional
% of Days 57%
1 Occupational Therapy Assistant
% of Days 53%
2 Medical Director
% of Days 28%

Penalties and fines

Federal penalties imposed by CMS for regulatory violations, including civil money penalties (fines) and denials of payment for new Medicare/Medicaid admissions.

Source: CMS Penalties Database

No penalties in the past 3 years

No civil money penalties or payment denials were reported in the last 3 years.

Quality of care over time

These measures show how residents usually do over time at this home, based on health outcomes and preventive care.

High-risk clinical events score Info A composite score based on pressure ulcers, falls with injury, weight loss, walking ability decline, and activities of daily living decline. 9.5
14% better than Pennsylvania average

Pennsylvania average: 11.0

Functional decline score Info A composite score based on activities of daily living decline, walking ability decline, and incontinence. 20.1
10% better than Pennsylvania average

Pennsylvania average: 22.2

Long-stay resident measures
Above average Pennsylvania avg: 3.7 Info CMS star rating based on long-stay quality measure performance. 5 stars = significantly above average, 1 star = significantly below average.
Need for Help with Daily Activities Increased Info Percent of long-stay residents whose need for help with daily activities has increased 18.8%
In line with Pennsylvania average

Pennsylvania average: 19.0%

Walking Ability Worsened Info Percent of long-stay residents whose ability to move independently worsened 14.7%
30% better than Pennsylvania average

Pennsylvania average: 21.1%

Low Risk Residents with Bowel/Bladder Incontinence Info Percent of low risk long-stay residents who lose control of their bowels or bladder 26.7%
In line with Pennsylvania average

Pennsylvania average: 26.7%

Falls with Major Injury Info Percent of long-stay residents experiencing one or more falls with major injury 3.9%
22% worse than Pennsylvania average

Pennsylvania average: 3.2%

High Risk Residents with Pressure Ulcers Info Percent of long-stay high risk residents with pressure ulcers 3.6%
36% better than Pennsylvania average

Pennsylvania average: 5.5%

Urinary Tract Infection Info Percent of long-stay residents with a urinary tract infection 1.8%
In line with Pennsylvania average

Pennsylvania average: 1.8%

Lost Too Much Weight Info Percent of long-stay residents who lose too much weight 6.4%
In line with Pennsylvania average

Pennsylvania average: 6.6%

Depressive Symptoms Info Percent of long-stay residents who have depressive symptoms 1.7%
68% better than Pennsylvania average

Pennsylvania average: 5.5%

Antipsychotic Use Info Percent of long-stay residents who received an antipsychotic medication 14.5%
15% better than Pennsylvania average

Pennsylvania average: 17.1%

Pneumococcal Vaccine Info Percent of long-stay residents assessed and appropriately given the pneumococcal vaccine 87.7%
In line with Pennsylvania average

Pennsylvania average: 86.9%

Influenza Vaccine Info Percent of long-stay residents assessed and appropriately given the seasonal influenza vaccine 90.1%
In line with Pennsylvania average

Pennsylvania average: 93.5%

Hospitalizations per 1,000 days Info Number of hospitalizations per 1,000 long-stay resident days. 1.84
10% worse than Pennsylvania average

Pennsylvania average: 1.68

ED visits per 1,000 days Info Number of outpatient emergency department visits per 1,000 long-stay resident days. 0.94
22% better than Pennsylvania average

Pennsylvania average: 1.20

Short-stay resident measures
Average Pennsylvania avg: 3.2 Info CMS star rating based on short-stay quality measure performance. 5 stars = much above average, 1 star = much below average.
Pneumococcal Vaccine Info Percent of short-stay residents assessed and appropriately given the pneumococcal vaccine 69.5%
In line with Pennsylvania average

Pennsylvania average: 68.8%

Antipsychotic medication increase Info Percent of short-stay residents who newly received an antipsychotic medication 1.6%
In line with Pennsylvania average

Pennsylvania average: 1.5%

Influenza Vaccine Info Percent of short-stay residents assessed and appropriately given the seasonal influenza vaccine 70.6%
In line with Pennsylvania average

Pennsylvania average: 68.7%

Re-hospitalized after SNF stay Info Percentage of short-stay residents who were re-hospitalized after their nursing home admission. 14.5%
37% better than Pennsylvania average

Pennsylvania average: 23.1%

Emergency department visits Info Percentage of short-stay residents who had an outpatient emergency department visit. 9.6%
In line with Pennsylvania average

Pennsylvania average: 9.8%

Falls with major injury Info Percentage of SNF residents who experience falls with major injury during their stay. 0.8%
In line with Pennsylvania average

Pennsylvania average: 0.8%

Ability to care for self at discharge Info Percentage of residents at or above expected ability to care for themselves at discharge. 15.5%
71% worse than Pennsylvania average

Pennsylvania average: 53.7%

Successful return to home or community Info Rate of successful return to home or community from a skilled nursing facility. 33.7%
33% worse than Pennsylvania average

Pennsylvania average: 50.6%

Breakdown by payment type

Medicare

29% of new residents, usually for short-term rehab.

Typical stay 25 days

Private pay

48% of new residents, often for short stays.

Typical stay 3 - 4 months

Medicaid

23% of new residents, often for long-term daily care.

Typical stay 6 years

Facility Characteristics

Source: CMS Long-Term Care Facility Characteristics (Data as of Jan 2026)

Total residents 498
Medicare
15
3% of residents
Medicaid
447
89.8% of residents
Private pay or other
36
7.2% of residents
Programs & Services
Residents Group

Residents meet regularly to discuss policies, care quality, and activities

Active Resident Council

Organized group of residents that meets regularly to discuss facility policies, quality of life, and activities.

Finances and operations

Based on CMS SNF Cost Report for fiscal year ending in 12/2023.

Government
Operated by federal authorities.
Net patient revenue Info Net patient revenue — what the home actually collects for resident care, after contractual allowances, bad debt and discounts are subtracted from its gross charges (CMS cost report, Worksheet G-3). It covers resident care only; money the home earns from other sources is shown separately as "Other income."
$18.5M
Net patient income Info Net patient income: net patient revenue minus the home's total operating expenses. A positive figure means it earns more from resident care than it spends to deliver it; a negative figure means the opposite. It excludes non-operating "other income."
-$57.9M
Government Operated by federal authorities.
Net patient revenue Info Net patient revenue — what the home actually collects for resident care, after contractual allowances, bad debt and discounts are subtracted from its gross charges (CMS cost report, Worksheet G-3). It covers resident care only; money the home earns from other sources is shown separately as "Other income."
$18.5M Rank #6 / 209Revenue — State benchmarkedThis home is ranked 6th out of 209 homes in Pennsylvania. Shows this facility's annual revenue compared to the Pennsylvania average. Higher revenue generally means more resources for staffing and capital — read alongside Payroll %.Rankings are based only on facilities in Pennsylvania that report data for that category. Facilities without available data are excluded from the ranking.Click the rank badge to see the full State ranking.Click here to see the full State ranking.
Net patient income Info Net patient income: net patient revenue minus the home's total operating expenses. A positive figure means it earns more from resident care than it spends to deliver it; a negative figure means the opposite. It excludes non-operating "other income."
-$57.9M
Other income Info Money the home earns outside of resident care — such as investments, grants, rentals and other non-operating sources (CMS cost report, Worksheet G-3). It is tracked separately from net patient revenue: it is not part of that figure, and it is not included in net patient income.
$63.8M
Payroll costs Info Staff salaries plus wage-related costs — benefits such as payroll taxes, health insurance and retirement — from the home's own accounting records (CMS cost report, Worksheet A). Contract or agency labor is counted separately, under other operating costs. Rank #3 / 209Payroll — State benchmarkedThis home is ranked 3rd out of 209 homes in Pennsylvania. Shows total annual staff payroll benchmarked to the Pennsylvania average. Higher payroll investment relative to peers often signals better staffing and less reliance on cheaper contract labor.Rankings are based only on facilities in Pennsylvania that report data for that category. Facilities without available data are excluded from the ranking.Click the rank badge to see the full State ranking.Click here to see the full State ranking.
$38.7M 208.9% of net patient revenue Info Payroll as a share of revenue: staff salaries and wage-related benefits divided by net patient revenue. A higher figure means more of each revenue dollar goes to staff pay. Rank #16 / 209Payroll % — State benchmarkedThis home is ranked 16th out of 209 homes in Pennsylvania. Shows payroll as a percentage of revenue versus the Pennsylvania average. Well-run Pennsylvania facilities typically land around 53–61% — the top third Statewide. Below 25% may signal understaffing or heavy agency use — read with Staffing ratings.Rankings are based only on facilities in Pennsylvania that report data for that category. Facilities without available data are excluded from the ranking.Click the rank badge to see the full State ranking.Click here to see the full State ranking.
Other operating costs Info Everything it costs to run the home apart from payroll — food, utilities, supplies, maintenance, contract labor and administration. Calculated as total operating expense minus payroll (staff salaries and wage-related benefits).
$37.7M
Total costs Info The home's total operating expense for the year — all the costs of running it, salaries included (CMS cost report, Worksheet G-3).
$76.5M

What does this home offer?

Minimum age icon
Minimum age icon

Minimum Age: 62 Years Old

Pets allowed icon
Pets allowed icon

Pets Allowed

Room sizes icon
Room sizes icon

Room Sizes: 260 - 347 / 494 - 593 sq. ft

Housing options icon

Housing Options: Studio

Transportation services icon

Transportation Services

Fitness and recreation icon

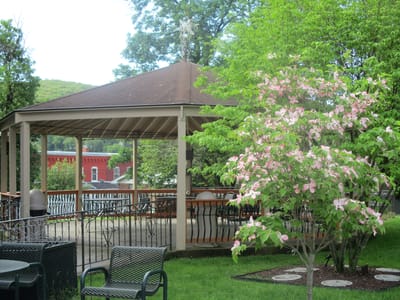
Fitness and Recreation

Who this home usually serves

TYPE OF STAY

Mix of rehab and long-term care

This home supports both short-term rehab and long-term care, with residents staying for a wide range of durations.

New residents most often arrive under private pay (48% of admissions), and a typical private pay stay runs around 3 - 4 months.

Admissions
343 total

Coverage residents most often arrive under.

Medicare 29%
Private pay 48%
Medicaid 23%
Discharges
557 total

Coverage residents most often leave under.

Medicare 12%
Private pay 58%
Medicaid 30%

Places of interest near Cedarbrook Senior Care and Rehab

Address 4.2 miles from city center Info Estimated distance in miles from Allentown's city center to Cedarbrook Senior Care and Rehab's address, calculated via Google Maps.

Calculate Travel Distance to Cedarbrook Senior Care and Rehab

Add your location

Address

Compare Nursing Homes around Allentown

The information below is reported by the Pennsylvania Department of Human Services and Department of Health.

5 facilities compared · CMS & PA Dept. of Health data

Cedarbrook Senior Care and Rehab
NH
HC
IL
MC
PC
RC
Allentown (South Cedarbrook Road)
670
Facility 670
PA AVG 94
Rank #1 / 555
75.8%
Facility 75.8%
PA AVG 78.7%
Rank #208 / 518
-4%
4.64
Facility 4.64
PA AVG 4.15
Rank #70 / 207
-5%+12%
$0
Facility $0
PA AVG $61.2k
Rank #1 / 210
-
12
Facility 12
PA AVG 31.3
Rank #78 / 207
4.0
Facility 4.0
PA AVG 4.4
Rank #115 / 207
-508-
22
Facility 22
PA AVG 46
Rank #521 / 668
County Of Lehigh Pennsylvania
$18.5M
Facility $18.5M
PA AVG $32.8M
Rank #6 / 209
$38.7M
Facility $38.7M
PA AVG $6.7M
Rank #3 / 209
208.9%
Facility 208.9%
PA AVG 40%
Rank #16 / 209
395465
Riverton Enhanced Senior Living
NH
AL
IL
MC
RC
Allentown (Rittersville)
90
Facility 90
PA AVG 94
Rank #251 / 555
76.7%
Facility 76.7%
PA AVG 78.7%
Rank #194 / 518
-3%
3.51
Facility 3.51
PA AVG 4.15
Rank #174 / 207
+19%-15%
$0
Facility $0
PA AVG $61.2k
Rank #1 / 210
91
Facility 91
PA AVG 83
Rank #112 / 460
7
Facility 7
PA AVG 31.3
Rank #46 / 207
1.4
Facility 1.4
PA AVG 4.4
Rank #19 / 207
-69-
56
Facility 56
PA AVG 46
Rank #237 / 668
Lee-Anne Liberatore
$16.0M
Facility $16.0M
PA AVG $32.8M
Rank #140 / 209
$7.2M
Facility $7.2M
PA AVG $6.7M
Rank #127 / 209
45.1%
Facility 45.1%
PA AVG 40%
Rank #76 / 209
395171
Good Shepherd Home Raker Center
NH
Allentown (Fairview)
99
Facility 99
PA AVG 94
Rank #226 / 555
--
3.36
Facility 3.36
PA AVG 4.15
Rank #186 / 207
+40%-19%
$0
Facility $0
PA AVG $61.2k
Rank #1 / 210
-
12
Facility 12
PA AVG 31.3
Rank #78 / 207
3.0
Facility 3.0
PA AVG 4.4
Rank #71 / 207
-97-
60
Facility 60
PA AVG 46
Rank #209 / 668
----395018
ManorCare Health Services-Allentown
NH
MC
Allentown (West End)
146
Facility 146
PA AVG 94
Rank #64 / 555
94.2%
Facility 94.2%
PA AVG 78.7%
Rank #23 / 518
+20%
3.85
Facility 3.85
PA AVG 4.15
Rank #141 / 207
-23%-7%
$0
Facility $0
PA AVG $61.2k
Rank #1 / 210
-
4
Facility 4
PA AVG 31.3
Rank #20 / 207
1.3
Facility 1.3
PA AVG 4.4
Rank #12 / 207
-136-
93
Facility 93
PA AVG 46
Rank #18 / 668
Diamond Healthcare At West Allen Holdco LLC
$4.5M
Facility $4.5M
PA AVG $32.8M
Rank #154 / 209
$2.5M
Facility $2.5M
PA AVG $6.7M
Rank #117 / 209
55%
Facility 55%
PA AVG 40%
Rank #19 / 209
395264
The Terrace at Phoebe Allentown
NH
IL
MC
NC
RC
Allentown
343
Facility 343
PA AVG 94
Rank #4 / 555
60.7%
Facility 60.7%
PA AVG 78.7%
Rank #346 / 518
-23%
3.98
Facility 3.98
PA AVG 4.15
Rank #122 / 207
-50%-4%
$11.1k
Facility $11.1k
PA AVG $61.2k
Rank #158 / 210
-
13
Facility 13
PA AVG 31.3
Rank #82 / 207
2.2
Facility 2.2
PA AVG 4.4
Rank #44 / 207
1240-
82
Facility 82
PA AVG 46
Rank #68 / 668
Michelle Morton
$35.8M
Facility $35.8M
PA AVG $32.8M
Rank #12 / 209
$21.1M
Facility $21.1M
PA AVG $6.7M
Rank #9 / 209
58.8%
Facility 58.8%
PA AVG 40%
Rank #145 / 209
395080

Financial Assistance for
Nursing Home in Pennsylvania

Cedarbrook Senior Care and Rehab is located in Allentown, Pennsylvania.
Here are the financial assistance programs available to residents in Pennsylvania.

Get Financial aid guidance

Community HealthChoices (CHC)

PA Medicaid CHC

Age 65+ or disabled
General Pennsylvania resident, Medicaid-eligible, nursing home-level care need.
Income Limits (2025) ~$2,829/month 300% FBR, individual
Asset Limits $2,000 (individual), $3,000 (couple) (excludes home, car).
PA

Managed care model; high urban demand (e.g., Philadelphia, Pittsburgh).

Benefits
Personal care (5-7 hours/day, e.g., bathing, dressing) Respite care (up to 240 hours/year) Adult day care ($70/day) Home modifications ($1,500 avg.)

Pennsylvania OPTIONS Program

PA OPTIONS

Age 60+
General Pennsylvania resident, at risk of nursing home placement.
Income Limits ~$2,000/month individual, varies by region
Asset Limits $8,000 individual
PA

Cost-sharing required above certain income; rural/urban balance.

Benefits
In-home care (3-5 hours/week) Respite (up to 10 days/year) Adult day care (~$70/day) Transportation (~5 trips/month)

Living Independence for the Elderly (LIFE)

Pennsylvania LIFE (PACE)

Age 55+
General PA resident (specific counties), NFLOC, safe with LIFE support.
Income Limits (2025) ~$2,829/month (Medicaid-eligible); private pay option available.
Asset Limits $2,000 (individual), $3,000 (couple) for Medicaid enrollees.
PA

16 providers in 25 counties (e.g., Allegheny, Luzerne); LIFE branding unique to PA.

Benefits
Personal care (5-7 hours/day) Medical care Meals Transportation Respite Therapies

Medicare Savings Program (MSP)

Pennsylvania Medicare Savings Program

Age 65+ or disabled
General PA resident, Medicare Part A/B.
Income Limits (2025) ~$2,510/month (QMB), ~$3,380/month (SLMB), ~$3,598/month (QI)—individual.
Asset Limits $9,430 (individual), $14,130 (couple).
PA

Three tiers; includes Extra Help for Part D; no waitlist.

Benefits
Covers Part B premiums ($174.70/month) Deductibles ($240/year) Copays (~20%)

Family Caregiver Support Program (FCSP)

Pennsylvania Family Caregiver Support Program

Age
General Caregivers of 60+ needing care or 55+ caregivers of others; PA resident; functional needs (2+ ADLs).
Income Limits (2025) No strict cap; reimbursements up to $600/month if care recipient income < ~$2,322/month 185% FPL
Asset Limits Not assessed; need-based.
PA

High demand; includes grandparent caregivers.

Benefits
Respite (4-6 hours/week or 5 days/year) Adult day care ($60/day) Supplies (~$2,000/year) Caregiver training

VA Aid and Attendance (A&A) and Housebound Benefits

Pennsylvania VA Aid and Attendance/Housebound

Age 65+ or disabled veteran/spouse
General PA resident, wartime service, need for ADL help (A&A) or homebound.
Income Limits (2025) Net income < ~$1,984/month (veteran with dependent, A&A); pension offsets income.
Asset Limits ~$155,356 net worth limit
PA

High veteran population; supports rural/urban care needs.

Benefits
Cash (~$1,433-$2,642/month veteran, ~$951-$1,318 spouse) for care costs (e.g., in-home, assisted living)

Property Tax/Rent Rebate Program (PTRR)

Pennsylvania Property Tax/Rent Rebate Program

Age 65+
General PA resident, homeowner/renter (or widow/er 50+, disabled 18+).
Income Limits (2025) ~$45,000/year individual or couple, excludes half of Social Security
Asset Limits Not assessed; income-focused.
PA

Rebates up to $1,000; ~600,000 eligible annually.

Benefits
Rebates ($250-$1,000 based on income; e.g., $1,000 if income < $8,000)

Senior Farmers’ Market Nutrition Program (SFMNP)

Pennsylvania SFMNP

Age 60+
General PA resident, low-income.
Income Limits (2025) ~$2,322/month individual, 185% FPL
Asset Limits Not assessed.
PA

Vouchers (~$50/season) via 52 AAAs; serves ~200,000 annually.

Benefits
Vouchers (~$50/season) for fresh produce at approved markets

Frequently Asked Questions about Cedarbrook Senior Care and Rehab

What neighborhood is Cedarbrook Senior Care and Rehab in?

Cedarbrook Senior Care and Rehab is in the South Cedarbrook Road neighborhood.

Is Cedarbrook Senior Care and Rehab in a walkable area?

Cedarbrook Senior Care and Rehab has a walk score of 22. Car-dependent. Most errands require a car, with limited nearby walkable options.

What is the occupancy rate at Cedarbrook Senior Care and Rehab?

Cedarbrook Senior Care and Rehab's occupancy is 75.8%.

Is Cedarbrook Senior Care and Rehab a government-operated facility?

Cedarbrook Senior Care and Rehab is a government-operated nursing facility.

Are there photos of Cedarbrook Senior Care and Rehab?

Yes — there are 7 photos of Cedarbrook Senior Care and Rehab in the photo gallery on this page.

What is the address of Cedarbrook Senior Care and Rehab?

Cedarbrook Senior Care and Rehab is located at 350 S Cedarbrook Rd, Allentown, PA 18104.

What is the phone number of Cedarbrook Senior Care and Rehab?

(610) 395-3727 will put you in contact with the team at Cedarbrook Senior Care and Rehab.

Guides for Better Senior Living

Care Cost Calculator: See Prices in Your Area

Nursing Home Data Explorer

Don’t Wait Too Long: 7 Red Flag Signs Your Parent Needs Assisted Living Now

The True Cost of Assisted Living in 2025 – And How Families Are Paying For It

Understanding Senior Living Costs: Pricing Models, Discounts & Financial Assistance