Complete Care at Lehigh Center
Nursing Home, Hospice Care, Palliative Care & Respite Care · Macungie, PA
CMS overall rating Info CMS (the Centers for Medicare & Medicaid Services) is the federal agency that rates nursing home quality. Its Overall Rating runs from 1 to 5 stars, combining health inspections, staffing, and quality measures, with inspections weighted most heavily.

Complete Care at Lehigh Center

Nursing Home, Hospice Care, Palliative Care & Respite Care · Macungie, PA
CMS overall rating Info CMS (the Centers for Medicare & Medicaid Services) is the federal agency that rates nursing home quality. Its Overall Rating runs from 1 to 5 stars, combining health inspections, staffing, and quality measures, with inspections weighted most heavily.
Calculator: See prices in your area
Complete Care at Lehigh Center accepts Medicare, Medicaid, and private pay.

Overview of Complete Care at Lehigh Center

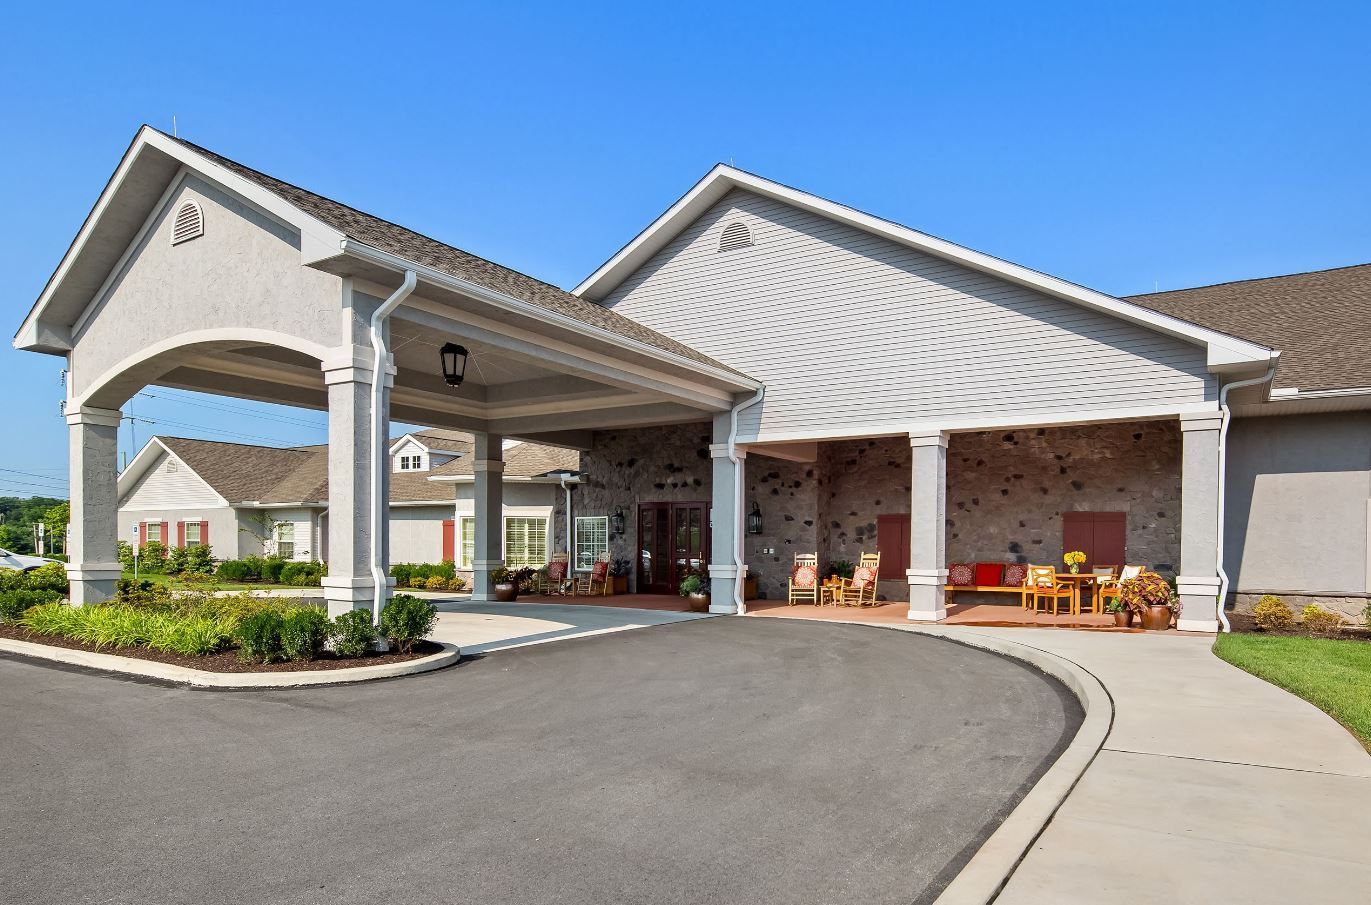
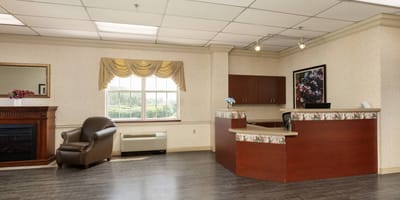
Complete Care at Lehigh Center, nestled in the serene town of Macungie, Pennsylvania, places an unwavering emphasis on holistic health and comprehensive recovery. This nursing home stands out for its hands-on approach to care, where each individual’s well-being is a priority. Rooted in values of loyalty and approachability, this center provides a nurturing environment that fosters healing and rejuvenation across all dimensions of health.

Distinguished by its commitment to excellence, Complete Care at Lehigh Center offers an array of services, including short-term care, long-term care, and specialized cardiac care. The center’s vibrant calendar of activities and amenities caters to residents’ diverse preferences and ensures a fulfilling stay. From wholesome meals thoughtfully customized to dietary needs to on-site amenities like a beauty salon, barbershop, tranquil courtyard, lounges, and guest areas, this community offers a serene and inclusive environment. In every aspect, Complete Care at Lehigh Center embodies the essence of comprehensive care, making it a place where health is valued, nurtured, and celebrated.

Quality ratings

Measured by Centers for Medicare & Medicaid Services (CMS)

Overall rating Info The Overall CMS Rating combines results from health inspections, staffing levels and quality measures. Health inspections carry the most weight. Staffing and quality scores can increase or decrease the final rating based on performance compared to state and national standards.
▲ 33.5% Above PA avg. ▲ 33.5% Above PA avg.PA average: 3.0Click the badge to see the full State ranking.Click here to see the full State ranking.
Health Inspection Info Based on the results of the facility's three most recent standard inspections and any complaint investigations. CMS reviews the number, scope, and severity of deficiencies, with more recent findings weighted more heavily.
▲ 43.0% Above PA avg. ▲ 43.0% Above PA avg.PA average: 2.8Click the badge to see the full State ranking.Click here to see the full State ranking.
Staffing Info Measures average nursing staff hours per resident per day, including Registered Nurses (RNs) and total nursing staff. Ratings are adjusted based on the level of care residents require and are compared to state and national benchmarks.
▼ 11.5% Below PA avg. ▼ 11.5% Below PA avg.PA average: 3.4Click the badge to see the full State ranking.Click here to see the full State ranking.
Quality Measures Info Based on clinical and physical health indicators reported to CMS, such as hospital readmissions, falls, pressure ulcers, and improvements in mobility. These measures reflect how well residents' health needs are being managed.
▲ 17.9% Above PA avg. ▲ 17.9% Above PA avg.PA average: 3.4Click the badge to see the full State ranking.Click here to see the full State ranking.

Staffing hours breakdown

Info Daily nursing hours per resident by staff type, reported to CMS. Higher is generally better — compare this facility to state and national averages to see where staffing stands.

Hours per resident per day — compared to Pennsylvania state averages

Total nursing care / resident Info This home is ranked 174th out of 207 homes in Pennsylvania for nurse hours. Total adjusted nursing hours per resident per day, combining RN, LPN, and aide time. CMS adjusts this for case-mix so facilities can be fairly compared.
3h 28m per day
Rank #174 / 207Nurse hours — State benchmarkedThis home is ranked 174th out of 207 homes in Pennsylvania. Shows adjusted nurse hours per resident per day benchmarked to the Pennsylvania average, with a ranking across 207 Pennsylvania facilities. More hours mean more direct care. The national average is about 3.5 hrs; below 3.0 is a red flag.Rankings are based only on facilities in Pennsylvania that report data for that category. Facilities without available data are excluded from the ranking.Click the rank badge to see the full State ranking.Click here to see the full State ranking.
This facility Pennsylvania avg (4h 9m per day)
vs Pennsylvania avg
-16%

5 of 6 metrics below state avg

Standout metric LPN / LVN is +5% above state avg
Staff type Hours / Day / Resident vs state avg
Registered Nurse (RN) Info RNs hold the highest nursing license and can assess residents, interpret test results, and direct care plans. More RN hours per day often signals stronger clinical oversight and faster response to health changes. 38m per day ▼ 19% State avg: 47m per day · National avg: 41m per day
LPN / LVN Info Licensed Practical Nurses (LPNs) or Licensed Vocational Nurses (LVNs) deliver routine hands-on care — medication administration, wound dressing, and monitoring vital signs. They work under RN supervision and make up a large share of daily bedside care. 58m per day ▲ 5% State avg: 55m per day · National avg: 52m per day
Nurse Aide Info Certified Nurse Aides (CNAs) provide the most direct day-to-day assistance: bathing, dressing, feeding, and mobility. Nurse aide hours are typically the largest staffing category and directly affect residents' quality of life. 1h 52m per day ▼ 15% State avg: 2h 12m per day · National avg: 2h 20m per day
Weekend Total Nursing Info Combined nursing hours (RN + LPN + Nurse Aide) per resident per day on weekends. Staffing often drops on weekends — this figure reveals whether the facility maintains adequate coverage outside of weekday hours. 3h 0m per day ▼ 15% State avg: 3h 31m per day · National avg: 3h 26m per day
Physical Therapist Info Hours per resident per day provided by licensed Physical Therapists (PTs) or PT Assistants. PT services help residents recover mobility after injury or illness and are especially important for post-acute (short-stay) rehabilitation. 2m per day ▼ 68% State avg: 6m per day · National avg: 4m per day
Weekend RN Info Registered nurse hours specifically on weekends. Facilities sometimes reduce RN presence on Saturdays and Sundays — a low weekend RN figure compared to weekday hours can indicate reduced clinical oversight when most administrative staff are absent. 19m per day ▼ 42% State avg: 33m per day · National avg: 28m per day

Capacity and availability

This home usually has limited availability

Higher occupancy than the Pennsylvania average: 78.7%
Occupancy rate
94.3% Rank #22 / 518Occupancy rate — State benchmarkedThis home is ranked 22nd out of 518 homes in Pennsylvania. Shows this facility's occupancy rate versus the Pennsylvania average, with its Statewide rank out of 518. Higher occupancy signals strong local demand and financial stability.Rankings are based only on facilities in Pennsylvania that report data for that category. Facilities without available data are excluded from the ranking.Click the rank badge to see the full State ranking.Click here to see the full State ranking.
Avg. Length of Stay
94 days
Bed community size
128-bed community Rank #98 / 555Bed count — State benchmarkedThis home is ranked 98th out of 555 homes in Pennsylvania. Shows this facility's certified or reported bed count compared to other Pennsylvania facilities. Larger communities may offer more amenities, programs, and on-site services for residents and families.Rankings are based only on facilities in Pennsylvania that report data for that category. Facilities without available data are excluded from the ranking.Click the rank badge to see the full State ranking.Click here to see the full State ranking.
A larger shared setting that may offer more common spaces and organized community services.
Walk Score
Walk Score: 18 / 100 Rank #548 / 668Walk Score — State benchmarkedThis home is ranked 548th out of 668 homes in Pennsylvania. Shows how walkable this facility's neighborhood is compared to the average Walk Score across Pennsylvania facilities. Higher scores benefit residents, families, and staff.Rankings are based only on facilities in Pennsylvania that report data for that category. Facilities without available data are excluded from the ranking.Click the rank badge to see the full State ranking.Click here to see the full State ranking.
Car-dependent. Most errands require a car, with limited nearby walkable options.

About this community

Awards

CMS 4 Star Overall
CMS 4 Quality
Great Place to Work 2025-2026
High 5
Striving for Ten

Safety & Compliance

Hoyer Lift

Therapy & Rehabilitation

3 services
Rehabilitation Services
Respite Care
Short-Term Rehab

Staffing & Medical

1 service
24-Hour Staffing

Additional Services

1 service
Post-Acute Care

Amenities & Lifestyle

Specific ProgramsCardiac Care, Neuro & Stroke Care, Pulmonary Care, Bariatric Care, Psychology/Psychiatric Care

Contact Complete Care at Lehigh Center

Staffing Data

Reporting period: October 1 – December 31, 2025 (Q4 2025). Source: CMS Payroll-Based Journal report.

Total staff 149
Employees 135
Contractors 14
Staff to resident ratio 1.22 : 1
33% fewer staff per resident than Pennsylvania average
Pennsylvania average ratio: 1.83 : 1 Pennsylvania average ratio: 1.83 : 1See full Pennsylvania ranking
Avg staff/day 63
Average shift 7.7 hours
0% compared with Pennsylvania average
Pennsylvania average: 7.8 hours Pennsylvania average shift: 7.8 hoursSee full Pennsylvania ranking
Total staff hours (quarter) 44,437

Nursing staff breakdown

Q4 2025 · Oct 1 – Dec 31 More info This data comes from the CMS Payroll-Based Journal report covering October 1 – December 31, 2025.
Registered Nurse

Manages medical care and health needs.

RN Staff Info All 11 RN Staff are full-time employees. No contractors work on this role. 11
Average shift length Info Average shift length. Calculated as total hours divided by days worked and average staff per day. 7.8 hours
Licensed Practical Nurse

Assists with medical care and medications.

LPN Staff Info All 32 LPN Staff are full-time employees. No contractors work on this role. 32
Average shift length Info Average shift length. Calculated as total hours divided by days worked and average staff per day. 7.8 hours
Certified Nursing Assistant

Helps with daily care and mobility.

CNA Staff Info All 65 CNA Staff are full-time employees. No contractors work on this role. 65
Average shift length Info Average shift length. Calculated as total hours divided by days worked and average staff per day. 7.6 hours

Contractor staffing

Q4 2025 · Oct 1 – Dec 31 More info This data comes from the CMS Payroll-Based Journal report covering October 1 – December 31, 2025.

Total hours from contractors

5.5%

2,439 contractor hours this quarter

Physical Therapy Assistant: 4 Speech Language Pathologist: 3 Physical Therapy Aide: 3 Respiratory Therapy Technician: 2 Qualified Social Worker: 2

Staff by category

Q4 2025 · Oct 1 – Dec 31 More info This data comes from the CMS Payroll-Based Journal report covering October 1 – December 31, 2025.
Certified Nursing Assistant 65 0 65 21,142 92 100% 7.6
Licensed Practical Nurse 32 0 32 9,991 92 100% 7.8
Clinical Nurse Specialist 12 0 12 4,015 87 95% 7.8
Registered Nurse 11 0 11 2,662 92 100% 7.8
Other Dietary Services Staff 2 0 2 909 69 75% 8
RN Director of Nursing 4 0 4 888 83 90% 6.9
Mental Health Service Worker 2 0 2 616 64 70% 8
Physical Therapy Aide 0 3 3 599 69 75% 6.9
Dietitian 3 0 3 586 67 73% 7.4
Qualified Social Worker 0 2 2 580 64 70% 7.6
Speech Language Pathologist 0 3 3 549 68 74% 7.6
Nurse Practitioner 1 0 1 476 60 65% 7.9
Administrator 1 0 1 472 59 64% 8
Respiratory Therapy Technician 0 2 2 360 61 66% 5.9
Physical Therapy Assistant 0 4 4 351 67 73% 4.6
Dental Services Staff 1 0 1 200 25 27% 8
Other Social Services Staff 1 0 1 41 6 7% 6.8
65 Certified Nursing Assistant
% of Days 100%
32 Licensed Practical Nurse
% of Days 100%
12 Clinical Nurse Specialist
% of Days 95%
11 Registered Nurse
% of Days 100%
2 Other Dietary Services Staff
% of Days 75%
4 RN Director of Nursing
% of Days 90%
2 Mental Health Service Worker
% of Days 70%
3 Physical Therapy Aide
% of Days 75%
3 Dietitian
% of Days 73%
2 Qualified Social Worker
% of Days 70%
3 Speech Language Pathologist
% of Days 74%
1 Nurse Practitioner
% of Days 65%
1 Administrator
% of Days 64%
2 Respiratory Therapy Technician
% of Days 66%
4 Physical Therapy Assistant
% of Days 73%
1 Dental Services Staff
% of Days 27%
1 Other Social Services Staff
% of Days 7%

Penalties and fines

Federal penalties imposed by CMS for regulatory violations, including civil money penalties (fines) and denials of payment for new Medicare/Medicaid admissions.

Source: CMS Penalties Database

No penalties in the past 3 years

No civil money penalties or payment denials were reported in the last 3 years.

Quality of care over time

These measures show how residents usually do over time at this home, based on health outcomes and preventive care.

High-risk clinical events score Info A composite score based on pressure ulcers, falls with injury, weight loss, walking ability decline, and activities of daily living decline. 9.4
14% better than Pennsylvania average

Pennsylvania average: 11.0

Functional decline score Info A composite score based on activities of daily living decline, walking ability decline, and incontinence. 22.9
In line with Pennsylvania average

Pennsylvania average: 22.2

Long-stay resident measures
Above average Pennsylvania avg: 3.7 Info CMS star rating based on long-stay quality measure performance. 5 stars = significantly above average, 1 star = significantly below average.
Need for Help with Daily Activities Increased Info Percent of long-stay residents whose need for help with daily activities has increased 15.8%
17% better than Pennsylvania average

Pennsylvania average: 19.0%

Walking Ability Worsened Info Percent of long-stay residents whose ability to move independently worsened 23.7%
12% worse than Pennsylvania average

Pennsylvania average: 21.1%

Low Risk Residents with Bowel/Bladder Incontinence Info Percent of low risk long-stay residents who lose control of their bowels or bladder 29.3%
10% worse than Pennsylvania average

Pennsylvania average: 26.7%

Falls with Major Injury Info Percent of long-stay residents experiencing one or more falls with major injury 3.4%
7% worse than Pennsylvania average

Pennsylvania average: 3.2%

High Risk Residents with Pressure Ulcers Info Percent of long-stay high risk residents with pressure ulcers 3.2%
42% better than Pennsylvania average

Pennsylvania average: 5.5%

Urinary Tract Infection Info Percent of long-stay residents with a urinary tract infection 2.3%
31% worse than Pennsylvania average

Pennsylvania average: 1.8%

Lost Too Much Weight Info Percent of long-stay residents who lose too much weight 0.9%
87% better than Pennsylvania average

Pennsylvania average: 6.6%

Depressive Symptoms Info Percent of long-stay residents who have depressive symptoms 9.4%
70% worse than Pennsylvania average

Pennsylvania average: 5.5%

Antipsychotic Use Info Percent of long-stay residents who received an antipsychotic medication 12.1%
29% better than Pennsylvania average

Pennsylvania average: 17.1%

Pneumococcal Vaccine Info Percent of long-stay residents assessed and appropriately given the pneumococcal vaccine 96.1%
11% better than Pennsylvania average

Pennsylvania average: 86.9%

Influenza Vaccine Info Percent of long-stay residents assessed and appropriately given the seasonal influenza vaccine 100.0%
7% better than Pennsylvania average

Pennsylvania average: 93.5%

Hospitalizations per 1,000 days Info Number of hospitalizations per 1,000 long-stay resident days. 1.26
25% better than Pennsylvania average

Pennsylvania average: 1.68

ED visits per 1,000 days Info Number of outpatient emergency department visits per 1,000 long-stay resident days. 0.88
27% better than Pennsylvania average

Pennsylvania average: 1.20

Short-stay resident measures
Average Pennsylvania avg: 3.2 Info CMS star rating based on short-stay quality measure performance. 5 stars = much above average, 1 star = much below average.
Pneumococcal Vaccine Info Percent of short-stay residents assessed and appropriately given the pneumococcal vaccine 89.3%
30% better than Pennsylvania average

Pennsylvania average: 68.8%

Antipsychotic medication increase Info Percent of short-stay residents who newly received an antipsychotic medication 1.8%
15% worse than Pennsylvania average

Pennsylvania average: 1.5%

Influenza Vaccine Info Percent of short-stay residents assessed and appropriately given the seasonal influenza vaccine 87.1%
27% better than Pennsylvania average

Pennsylvania average: 68.7%

Re-hospitalized after SNF stay Info Percentage of short-stay residents who were re-hospitalized after their nursing home admission. 20.5%
11% better than Pennsylvania average

Pennsylvania average: 23.1%

Emergency department visits Info Percentage of short-stay residents who had an outpatient emergency department visit. 9.8%
In line with Pennsylvania average

Pennsylvania average: 9.8%

Falls with major injury Info Percentage of SNF residents who experience falls with major injury during their stay. 0.0%
100% better than Pennsylvania average

Pennsylvania average: 0.8%

Ability to care for self at discharge Info Percentage of residents at or above expected ability to care for themselves at discharge. 26.4%
51% worse than Pennsylvania average

Pennsylvania average: 53.7%

Successful return to home or community Info Rate of successful return to home or community from a skilled nursing facility. 54.9%
9% better than Pennsylvania average

Pennsylvania average: 50.6%

Breakdown by payment type

Medicare

45% of new residents, usually for short-term rehab.

Typical stay 18 days

Private pay

48% of new residents, often for short stays.

Typical stay 1 - 2 months

Medicaid

7% of new residents, often for long-term daily care.

Typical stay 2 - 3 years

Facility Characteristics

Source: CMS Long-Term Care Facility Characteristics (Data as of Jan 2026)

Total residents 122
Medicare
12
9.8% of residents
Medicaid
58
47.5% of residents
Private pay or other
52
42.6% of residents
Programs & Services
Residents Group

Residents meet regularly to discuss policies, care quality, and activities

Active Resident Council

Organized group of residents that meets regularly to discuss facility policies, quality of life, and activities.

Finances and operations

Based on CMS SNF Cost Report for fiscal year ending in 12/2023.

For-profit
Corporation
Net patient revenue Info Net patient revenue — what the home actually collects for resident care, after contractual allowances, bad debt and discounts are subtracted from its gross charges (CMS cost report, Worksheet G-3). It covers resident care only; money the home earns from other sources is shown separately as "Other income."
$15.3M
Net patient income Info Net patient income: net patient revenue minus the home's total operating expenses. A positive figure means it earns more from resident care than it spends to deliver it; a negative figure means the opposite. It excludes non-operating "other income."
-$105.9K
For-profit Corporation
Net patient revenue Info Net patient revenue — what the home actually collects for resident care, after contractual allowances, bad debt and discounts are subtracted from its gross charges (CMS cost report, Worksheet G-3). It covers resident care only; money the home earns from other sources is shown separately as "Other income."
$15.3M Rank #148 / 209Revenue — State benchmarkedThis home is ranked 148th out of 209 homes in Pennsylvania. Shows this facility's annual revenue compared to the Pennsylvania average. Higher revenue generally means more resources for staffing and capital — read alongside Payroll %.Rankings are based only on facilities in Pennsylvania that report data for that category. Facilities without available data are excluded from the ranking.Click the rank badge to see the full State ranking.Click here to see the full State ranking.
Net patient income Info Net patient income: net patient revenue minus the home's total operating expenses. A positive figure means it earns more from resident care than it spends to deliver it; a negative figure means the opposite. It excludes non-operating "other income."
-$105.9K
Other income Info Money the home earns outside of resident care — such as investments, grants, rentals and other non-operating sources (CMS cost report, Worksheet G-3). It is tracked separately from net patient revenue: it is not part of that figure, and it is not included in net patient income.
$143.2K
Payroll costs Info Staff salaries plus wage-related costs — benefits such as payroll taxes, health insurance and retirement — from the home's own accounting records (CMS cost report, Worksheet A). Contract or agency labor is counted separately, under other operating costs. Rank #135 / 209Payroll — State benchmarkedThis home is ranked 135th out of 209 homes in Pennsylvania. Shows total annual staff payroll benchmarked to the Pennsylvania average. Higher payroll investment relative to peers often signals better staffing and less reliance on cheaper contract labor.Rankings are based only on facilities in Pennsylvania that report data for that category. Facilities without available data are excluded from the ranking.Click the rank badge to see the full State ranking.Click here to see the full State ranking.
$7.4M 48.5% of net patient revenue Info Payroll as a share of revenue: staff salaries and wage-related benefits divided by net patient revenue. A higher figure means more of each revenue dollar goes to staff pay. Rank #73 / 209Payroll % — State benchmarkedThis home is ranked 73rd out of 209 homes in Pennsylvania. Shows payroll as a percentage of revenue versus the Pennsylvania average. Well-run Pennsylvania facilities typically land around 53–61% — the top third Statewide. Below 25% may signal understaffing or heavy agency use — read with Staffing ratings.Rankings are based only on facilities in Pennsylvania that report data for that category. Facilities without available data are excluded from the ranking.Click the rank badge to see the full State ranking.Click here to see the full State ranking.
Other operating costs Info Everything it costs to run the home apart from payroll — food, utilities, supplies, maintenance, contract labor and administration. Calculated as total operating expense minus payroll (staff salaries and wage-related benefits).
$8.0M
Total costs Info The home's total operating expense for the year — all the costs of running it, salaries included (CMS cost report, Worksheet G-3).
$15.4M

What does this home offer?

Pets allowed icon
Pets allowed icon

Pets Allowed

Transportation services icon

Transportation Services

Fitness and recreation icon

Fitness and Recreation

Who this home usually serves

TYPE OF STAY

Mix of rehab and long-term care

This home supports both short-term rehab and long-term care, with residents staying for a wide range of durations.

New residents most often arrive under private pay (48% of admissions), and a typical private pay stay runs around 1 - 2 months.

Admissions
467 total

Coverage residents most often arrive under.

Medicare 45%
Private pay 48%
Medicaid 7%
Discharges
469 total

Coverage residents most often leave under.

Medicare 30%
Private pay 45%
Medicaid 24%

Managed by Deb Stoneback

Administrator

Deb Stoneback, NHA, serves as the Administrator at Complete Care at Lehigh Center. She leads a dedicated team committed to building strong relationships with residents and providing exemplary care. The community prides itself on the longevity and excellence of its staff under her leadership.

Places of interest near Complete Care at Lehigh Center

Address 2.3 miles from city center Info Estimated distance in miles from Macungie's city center to Complete Care at Lehigh Center's address, calculated via Google Maps.

Calculate Travel Distance to Complete Care at Lehigh Center

Add your location

Address

Compare Nursing Homes around Allentown

The information below is reported by the Pennsylvania Department of Human Services and Department of Health.

5 facilities compared · CMS & PA Dept. of Health data

Cedarbrook Senior Care and Rehab
NH
HC
IL
MC
PC
RC
Allentown (South Cedarbrook Road)
670
Facility 670
PA AVG 94
Rank #1 / 555
75.8%
Facility 75.8%
PA AVG 78.7%
Rank #208 / 518
-4%
4.64
Facility 4.64
PA AVG 4.15
Rank #70 / 207
-5% +12%
$0
Facility $0
PA AVG $61.2k
Rank #1 / 210
-
12
Facility 12
PA AVG 31.3
Rank #78 / 207
4.0
Facility 4.0
PA AVG 4.4
Rank #115 / 207
- 508 -
22
Facility 22
PA AVG 46
Rank #521 / 668
County Of Lehigh Pennsylvania
$18.5M
Facility $18.5M
PA AVG $32.8M
Rank #6 / 209
$38.7M
Facility $38.7M
PA AVG $6.7M
Rank #3 / 209
208.9%
Facility 208.9%
PA AVG 40%
Rank #16 / 209
395465
Riverton Enhanced Senior Living
NH
AL
IL
MC
RC
Allentown (Rittersville)
90
Facility 90
PA AVG 94
Rank #251 / 555
76.7%
Facility 76.7%
PA AVG 78.7%
Rank #194 / 518
-3%
3.51
Facility 3.51
PA AVG 4.15
Rank #174 / 207
+19% -15%
$0
Facility $0
PA AVG $61.2k
Rank #1 / 210
91
Facility 91
PA AVG 83
Rank #112 / 460
7
Facility 7
PA AVG 31.3
Rank #46 / 207
1.4
Facility 1.4
PA AVG 4.4
Rank #19 / 207
- 69 -
56
Facility 56
PA AVG 46
Rank #237 / 668
Lee-Anne Liberatore
$16.0M
Facility $16.0M
PA AVG $32.8M
Rank #140 / 209
$7.2M
Facility $7.2M
PA AVG $6.7M
Rank #127 / 209
45.1%
Facility 45.1%
PA AVG 40%
Rank #76 / 209
395171
ManorCare Health Services-Allentown
NH
MC
Allentown (West End)
146
Facility 146
PA AVG 94
Rank #64 / 555
94.2%
Facility 94.2%
PA AVG 78.7%
Rank #23 / 518
+20%
3.85
Facility 3.85
PA AVG 4.15
Rank #141 / 207
-23% -7%
$0
Facility $0
PA AVG $61.2k
Rank #1 / 210
-
4
Facility 4
PA AVG 31.3
Rank #20 / 207
1.3
Facility 1.3
PA AVG 4.4
Rank #12 / 207
- 136 -
93
Facility 93
PA AVG 46
Rank #18 / 668
Diamond Healthcare At West Allen Holdco LLC
$4.5M
Facility $4.5M
PA AVG $32.8M
Rank #154 / 209
$2.5M
Facility $2.5M
PA AVG $6.7M
Rank #117 / 209
55%
Facility 55%
PA AVG 40%
Rank #19 / 209
395264
Complete Care at Lehigh Center
NH
HC
PC
RC
Macungie (Spring Creek Road)
128
Facility 128
PA AVG 94
Rank #98 / 555
94.3%
Facility 94.3%
PA AVG 78.7%
Rank #22 / 518
+20%
3.47
Facility 3.47
PA AVG 4.15
Rank #174 / 207
-38% -16%
$0
Facility $0
PA AVG $61.2k
Rank #1 / 210
-
11
Facility 11
PA AVG 31.3
Rank #72 / 207
3.7
Facility 3.7
PA AVG 4.4
Rank #107 / 207
- 123 -
18
Facility 18
PA AVG 46
Rank #548 / 668
-
$15.3M
Facility $15.3M
PA AVG $32.8M
Rank #148 / 209
$7.4M
Facility $7.4M
PA AVG $6.7M
Rank #135 / 209
48.5%
Facility 48.5%
PA AVG 40%
Rank #73 / 209
395939
The Terrace at Phoebe Allentown
NH
IL
MC
NC
RC
Allentown
343
Facility 343
PA AVG 94
Rank #4 / 555
60.7%
Facility 60.7%
PA AVG 78.7%
Rank #346 / 518
-23%
3.98
Facility 3.98
PA AVG 4.15
Rank #122 / 207
-50% -4%
$11.1k
Facility $11.1k
PA AVG $61.2k
Rank #158 / 210
-
13
Facility 13
PA AVG 31.3
Rank #82 / 207
2.2
Facility 2.2
PA AVG 4.4
Rank #44 / 207
1 240 -
82
Facility 82
PA AVG 46
Rank #68 / 668
Michelle Morton
$35.8M
Facility $35.8M
PA AVG $32.8M
Rank #12 / 209
$21.1M
Facility $21.1M
PA AVG $6.7M
Rank #9 / 209
58.8%
Facility 58.8%
PA AVG 40%
Rank #145 / 209
395080

Financial Assistance for
Nursing Home in Pennsylvania

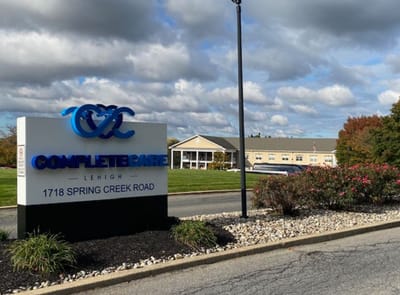
Complete Care at Lehigh Center is located in Macungie, Pennsylvania.
Here are the financial assistance programs available to residents in Pennsylvania.

Get Financial aid guidance

Community HealthChoices (CHC)

PA Medicaid CHC

Age 65+ or disabled
General Pennsylvania resident, Medicaid-eligible, nursing home-level care need.
Income Limits (2025) ~$2,829/month 300% FBR, individual
Asset Limits $2,000 (individual), $3,000 (couple) (excludes home, car).
PA

Managed care model; high urban demand (e.g., Philadelphia, Pittsburgh).

Benefits
Personal care (5-7 hours/day, e.g., bathing, dressing) Respite care (up to 240 hours/year) Adult day care ($70/day) Home modifications ($1,500 avg.)

Pennsylvania OPTIONS Program

PA OPTIONS

Age 60+
General Pennsylvania resident, at risk of nursing home placement.
Income Limits ~$2,000/month individual, varies by region
Asset Limits $8,000 individual
PA

Cost-sharing required above certain income; rural/urban balance.

Benefits
In-home care (3-5 hours/week) Respite (up to 10 days/year) Adult day care (~$70/day) Transportation (~5 trips/month)

Living Independence for the Elderly (LIFE)

Pennsylvania LIFE (PACE)

Age 55+
General PA resident (specific counties), NFLOC, safe with LIFE support.
Income Limits (2025) ~$2,829/month (Medicaid-eligible); private pay option available.
Asset Limits $2,000 (individual), $3,000 (couple) for Medicaid enrollees.
PA

16 providers in 25 counties (e.g., Allegheny, Luzerne); LIFE branding unique to PA.

Benefits
Personal care (5-7 hours/day) Medical care Meals Transportation Respite Therapies

Medicare Savings Program (MSP)

Pennsylvania Medicare Savings Program

Age 65+ or disabled
General PA resident, Medicare Part A/B.
Income Limits (2025) ~$2,510/month (QMB), ~$3,380/month (SLMB), ~$3,598/month (QI)—individual.
Asset Limits $9,430 (individual), $14,130 (couple).
PA

Three tiers; includes Extra Help for Part D; no waitlist.

Benefits
Covers Part B premiums ($174.70/month) Deductibles ($240/year) Copays (~20%)

Family Caregiver Support Program (FCSP)

Pennsylvania Family Caregiver Support Program

Age
General Caregivers of 60+ needing care or 55+ caregivers of others; PA resident; functional needs (2+ ADLs).
Income Limits (2025) No strict cap; reimbursements up to $600/month if care recipient income < ~$2,322/month 185% FPL
Asset Limits Not assessed; need-based.
PA

High demand; includes grandparent caregivers.

Benefits
Respite (4-6 hours/week or 5 days/year) Adult day care ($60/day) Supplies (~$2,000/year) Caregiver training

VA Aid and Attendance (A&A) and Housebound Benefits

Pennsylvania VA Aid and Attendance/Housebound

Age 65+ or disabled veteran/spouse
General PA resident, wartime service, need for ADL help (A&A) or homebound.
Income Limits (2025) Net income < ~$1,984/month (veteran with dependent, A&A); pension offsets income.
Asset Limits ~$155,356 net worth limit
PA

High veteran population; supports rural/urban care needs.

Benefits
Cash (~$1,433-$2,642/month veteran, ~$951-$1,318 spouse) for care costs (e.g., in-home, assisted living)

Property Tax/Rent Rebate Program (PTRR)

Pennsylvania Property Tax/Rent Rebate Program

Age 65+
General PA resident, homeowner/renter (or widow/er 50+, disabled 18+).
Income Limits (2025) ~$45,000/year individual or couple, excludes half of Social Security
Asset Limits Not assessed; income-focused.
PA

Rebates up to $1,000; ~600,000 eligible annually.

Benefits
Rebates ($250-$1,000 based on income; e.g., $1,000 if income < $8,000)

Senior Farmers’ Market Nutrition Program (SFMNP)

Pennsylvania SFMNP

Age 60+
General PA resident, low-income.
Income Limits (2025) ~$2,322/month individual, 185% FPL
Asset Limits Not assessed.
PA

Vouchers (~$50/season) via 52 AAAs; serves ~200,000 annually.

Benefits
Vouchers (~$50/season) for fresh produce at approved markets

Frequently Asked Questions about Complete Care at Lehigh Center

What neighborhood is Complete Care at Lehigh Center in?

Complete Care at Lehigh Center is in the Spring Creek Road neighborhood.

Is Complete Care at Lehigh Center in a walkable area?

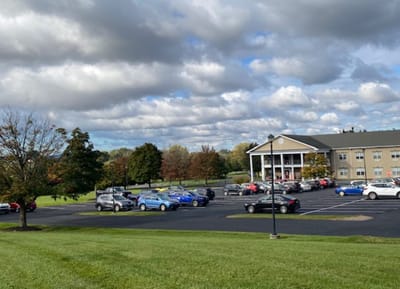
Complete Care at Lehigh Center has a walk score of 18. Car-dependent. Most errands require a car, with limited nearby walkable options.

What is the occupancy rate at Complete Care at Lehigh Center?

Complete Care at Lehigh Center's occupancy is 94.3%.

Does Complete Care at Lehigh Center operate as a for-profit or non-profit?

Complete Care at Lehigh Center is registered as a for-profit.

Are there photos of Complete Care at Lehigh Center?

Yes — there are 5 photos of Complete Care at Lehigh Center in the photo gallery on this page.

What is the address of Complete Care at Lehigh Center?

Complete Care at Lehigh Center is located at 1718 Spring Creek Rd, Macungie, PA 18062.

What is the phone number of Complete Care at Lehigh Center?

(610) 366-0500 will put you in contact with the team at Complete Care at Lehigh Center.

Guides for Better Senior Living

Care Cost Calculator: See Prices in Your Area

Nursing Home Data Explorer

Don’t Wait Too Long: 7 Red Flag Signs Your Parent Needs Assisted Living Now

The True Cost of Assisted Living in 2025 – And How Families Are Paying For It

Understanding Senior Living Costs: Pricing Models, Discounts & Financial Assistance