Celebrate Senior Living Niles
Nursing Home, Assisted Living, Independent Living, Memory Care & Respite Care · Niles, IL
CMS overall rating Info CMS (the Centers for Medicare & Medicaid Services) is the federal agency that rates nursing home quality. Its Overall Rating runs from 1 to 5 stars, combining health inspections, staffing, and quality measures, with inspections weighted most heavily.

Celebrate Senior Living Niles

Nursing Home, Assisted Living, Independent Living, Memory Care & Respite Care · Niles, IL
CMS overall rating Info CMS (the Centers for Medicare & Medicaid Services) is the federal agency that rates nursing home quality. Its Overall Rating runs from 1 to 5 stars, combining health inspections, staffing, and quality measures, with inspections weighted most heavily.
Calculator: See prices in your area
Celebrate Senior Living Niles accepts Medicare, Medicaid, and private pay.

Overview of Celebrate Senior Living Niles

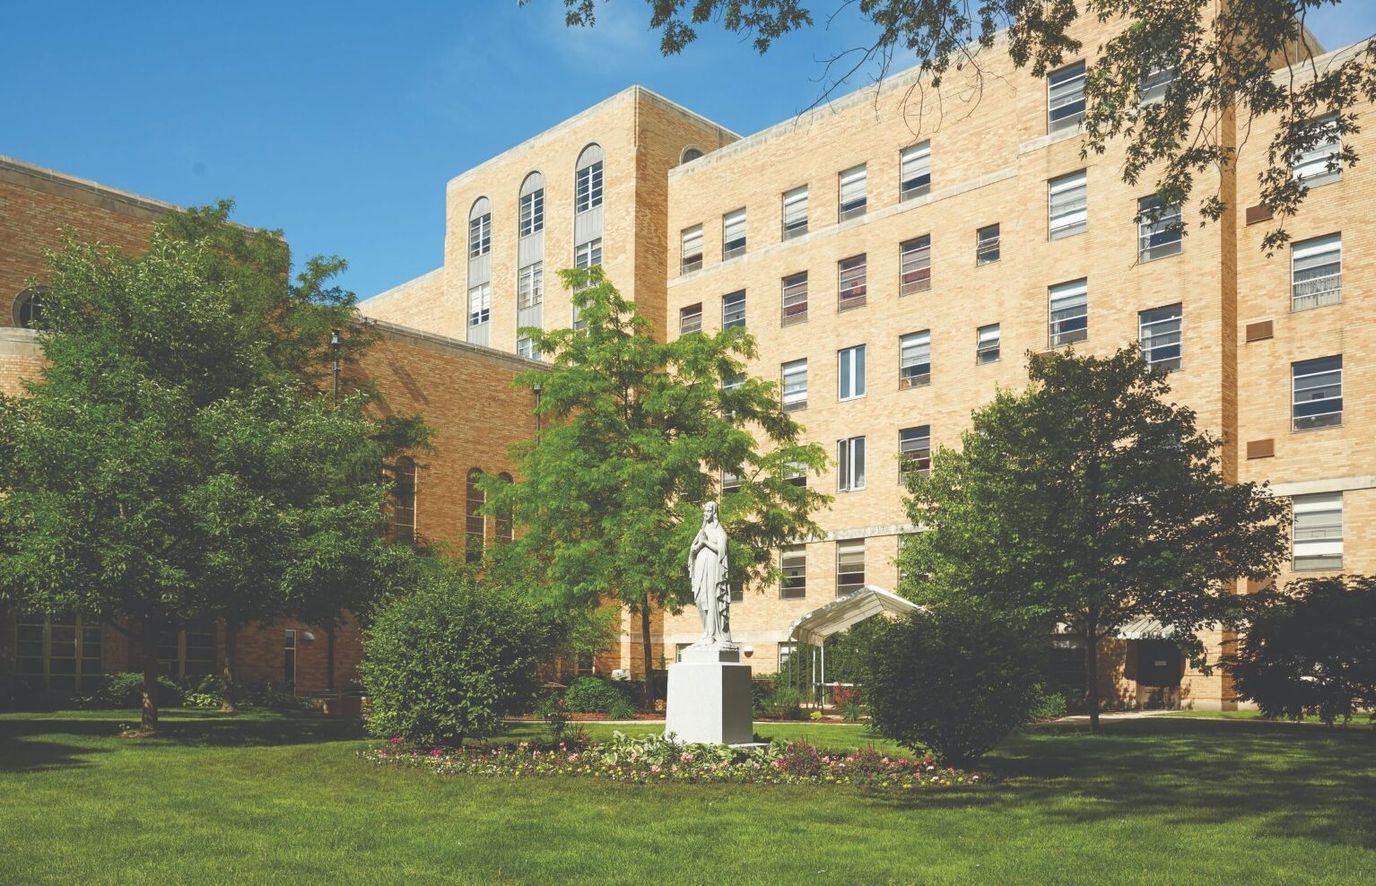
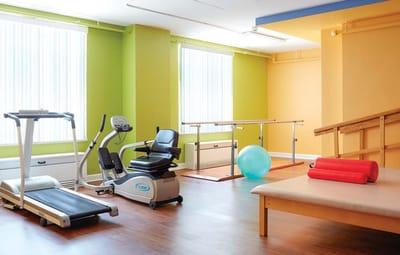
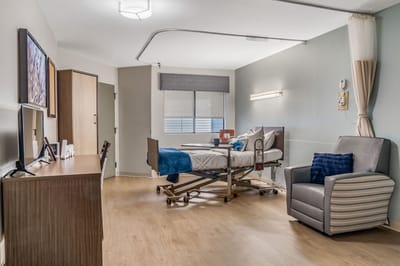
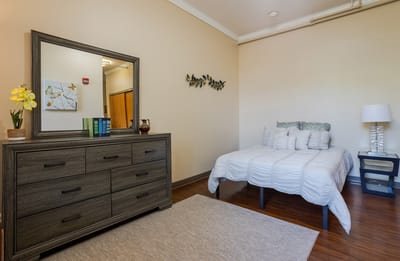
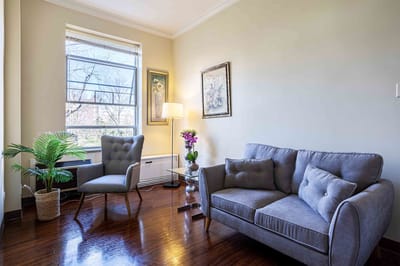
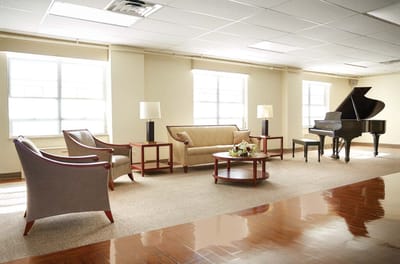
Peacefully located in Niles, IL, Celebrate Senior Living Niles is a vibrant community designed to provide independent living and assisted living options. It supports residents needing support with their daily activities with the help of an excellent care team that is also trained in memory care practices. Those who want to enjoy an independent lifestyle find comfort and convenience in having access to maintenance and housekeeping services.

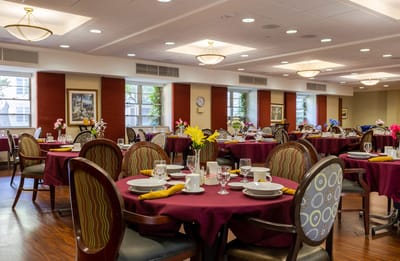
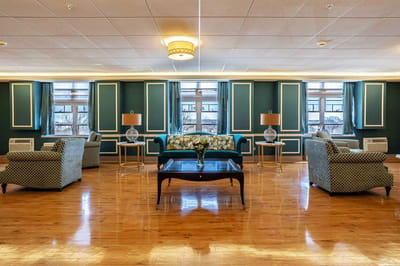
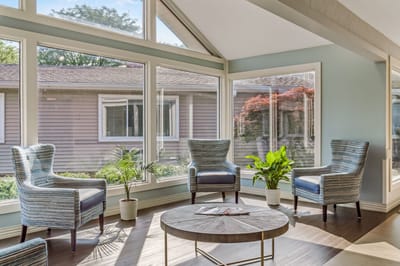
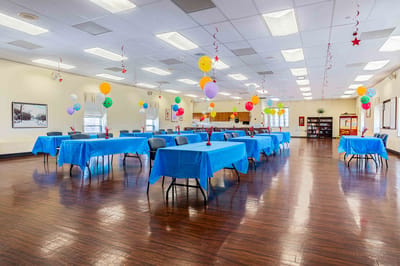
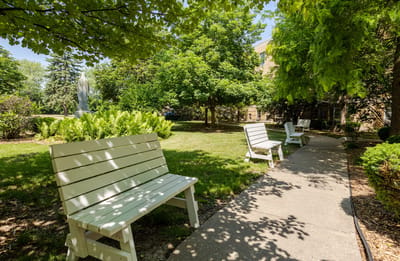
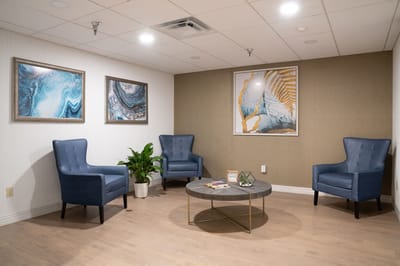
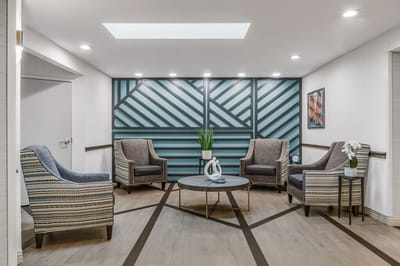
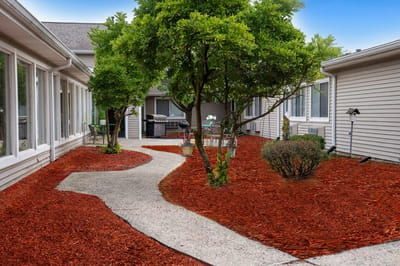
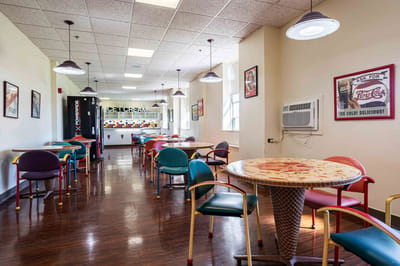
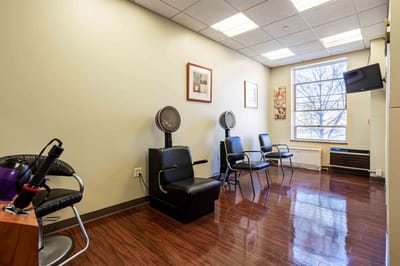
Residents here have no boring days with an array of daily activities, weekly recreation, and monthly social events held regularly. The community also has a spacious dining room where residents can enjoy three delicious meals daily. Residents’ living experience is further enhanced by amenities like a salon, library, and refreshing outdoor spaces for socialization and relaxation.

Quality ratings

Measured by Centers for Medicare & Medicaid Services (CMS)

Overall rating Info The Overall CMS Rating combines results from health inspections, staffing levels and quality measures. Health inspections carry the most weight. Staffing and quality scores can increase or decrease the final rating based on performance compared to state and national standards.
▲ 58.7% Above IL avg. ▲ 58.7% Above IL avg.IL average: 2.5Click the badge to see the full State ranking.Click here to see the full State ranking.
Health Inspection Info Based on the results of the facility's three most recent standard inspections and any complaint investigations. CMS reviews the number, scope, and severity of deficiencies, with more recent findings weighted more heavily.
▲ 44.1% Above IL avg. ▲ 44.1% Above IL avg.IL average: 2.8Click the badge to see the full State ranking.Click here to see the full State ranking.
Staffing Info Measures average nursing staff hours per resident per day, including Registered Nurses (RNs) and total nursing staff. Ratings are adjusted based on the level of care residents require and are compared to state and national benchmarks.
▲ 87.2% Above IL avg. ▲ 87.2% Above IL avg.IL average: 2.1Click the badge to see the full State ranking.Click here to see the full State ranking.
Quality Measures Info Based on clinical and physical health indicators reported to CMS, such as hospital readmissions, falls, pressure ulcers, and improvements in mobility. These measures reflect how well residents' health needs are being managed.
▲ 6.6% Above IL avg. ▲ 6.6% Above IL avg.IL average: 2.8Click the badge to see the full State ranking.Click here to see the full State ranking.

Staffing hours breakdown

Info Daily nursing hours per resident by staff type, reported to CMS. Higher is generally better — compare this facility to state and national averages to see where staffing stands.

Hours per resident per day — compared to Illinois state averages

Total nursing care / resident Info This home is ranked 54th out of 172 homes in Illinois for nurse hours. Total adjusted nursing hours per resident per day, combining RN, LPN, and aide time. CMS adjusts this for case-mix so facilities can be fairly compared.
3h 32m per day
Rank #54 / 172Nurse hours — State benchmarkedThis home is ranked 54th out of 172 homes in Illinois. Shows adjusted nurse hours per resident per day benchmarked to the Illinois average, with a ranking across 172 Illinois facilities. More hours mean more direct care. The national average is about 3.5 hrs; below 3.0 is a red flag.Rankings are based only on facilities in Illinois that report data for that category. Facilities without available data are excluded from the ranking.Click the rank badge to see the full State ranking.Click here to see the full State ranking.
This facility Illinois avg (3h 6m per day)
vs Illinois avg
+14%

0 of 6 metrics below state avg

Standout metric Weekend RN is +86% above state avg
Staff typeHours / Day / Residentvs state avg
Registered Nurse (RN) Info RNs hold the highest nursing license and can assess residents, interpret test results, and direct care plans. More RN hours per day often signals stronger clinical oversight and faster response to health changes. 1h 2m per day ▲ 42% State avg: 44m per day · National avg: 41m per day
LPN / LVN Info Licensed Practical Nurses (LPNs) or Licensed Vocational Nurses (LVNs) deliver routine hands-on care — medication administration, wound dressing, and monitoring vital signs. They work under RN supervision and make up a large share of daily bedside care. 40m per day ▲ 5% State avg: 38m per day · National avg: 52m per day
Nurse Aide Info Certified Nurse Aides (CNAs) provide the most direct day-to-day assistance: bathing, dressing, feeding, and mobility. Nurse aide hours are typically the largest staffing category and directly affect residents' quality of life. 3h 4m per day ▲ 44% State avg: 2h 8m per day · National avg: 2h 20m per day
Weekend Total Nursing Info Combined nursing hours (RN + LPN + Nurse Aide) per resident per day on weekends. Staffing often drops on weekends — this figure reveals whether the facility maintains adequate coverage outside of weekday hours. 4h 23m per day ▲ 42% State avg: 3h 5m per day · National avg: 3h 26m per day
Physical Therapist Info Hours per resident per day provided by licensed Physical Therapists (PTs) or PT Assistants. PT services help residents recover mobility after injury or illness and are especially important for post-acute (short-stay) rehabilitation. 3m per day ■ Avg State avg: 3m per day · National avg: 4m per day
Weekend RN Info Registered nurse hours specifically on weekends. Facilities sometimes reduce RN presence on Saturdays and Sundays — a low weekend RN figure compared to weekday hours can indicate reduced clinical oversight when most administrative staff are absent. 1h 3m per day ▲ 86% State avg: 34m per day · National avg: 28m per day

Capacity and availability

Avg. Length of Stay
207 days
Bed community size
59-bed community Rank #268 / 426Bed count — State benchmarkedThis home is ranked 268th out of 426 homes in Illinois. Shows this facility's certified or reported bed count compared to other Illinois facilities. Larger communities may offer more amenities, programs, and on-site services for residents and families.Rankings are based only on facilities in Illinois that report data for that category. Facilities without available data are excluded from the ranking.Click the rank badge to see the full State ranking.Click here to see the full State ranking.
A moderately sized community that may balance personal attention with shared amenities and social activities.
Years in operation
7 years in operation Rank #117 / 145Years in operation — State benchmarkedThis home is ranked 117th out of 145 homes in Illinois. Shows how long this facility has been in operation compared to other Illinois facilities. Longer operating histories may benefit residents, families, and staff.Rankings are based only on facilities in Illinois that report data for that category. Facilities without available data are excluded from the ranking.Click the rank badge to see the full State ranking.Click here to see the full State ranking.
An established community with some operational experience and growing routines.
Walk Score
Walk Score: 60 / 100 Rank #233 / 648Walk Score — State benchmarkedThis home is ranked 233rd out of 648 homes in Illinois. Shows how walkable this facility's neighborhood is compared to the average Walk Score across Illinois facilities. Higher scores benefit residents, families, and staff.Rankings are based only on facilities in Illinois that report data for that category. Facilities without available data are excluded from the ranking.Click the rank badge to see the full State ranking.Click here to see the full State ranking.
Moderately walkable. Some errands can be accomplished on foot, with a mix of nearby amenities.
BBB Rating
BBB Rating: A+ (Not Accredited)
An independent rating from the Better Business Bureau based on factors such as complaint history, transparency, and business practices.
How BBB ratings work

About this community

Occupancy

Occupancy rate
90%
Rank #35 / 204Occupancy rate — State benchmarkedThis home is ranked 35th out of 204 homes in Illinois. Shows this facility's occupancy rate versus the Illinois average, with its Statewide rank out of 204. Higher occupancy signals strong local demand and financial stability.Rankings are based only on facilities in Illinois that report data for that category. Facilities without available data are excluded from the ranking.Click the rank badge to see the full State ranking.Click here to see the full State ranking.
Higher than the Illinois average: 69.3%
Occupied beds
53 / 59
Average occupied beds in Illinois homes 93 beds

License Details

Facility TypeAssisted Living/shared Housing Establishment
StatusActive
IssuanceAugust 1, 2025
ExpirationAugust 1, 2026
CountyCook
License Number5106973

Ownership & Operating Entity

Celebrate Senior Living Niles is legally operated by Elevate Saint Andrew Llc.

Type Of Units

Permanent Units
39 units
Alzheimer's Units
20 units
Total beds
59 units

Staffing

Key information about the people who lead and staff this community.

Leadership

ContactMs. Ilya Shulman, Principal

Therapy & Rehabilitation

2 services
Rehabilitation Services
Respite Care

Staffing & Medical

1 service
24-Hour Staffing

Contact Information

Amenities & Lifestyle

10
000 Square Foot Activities Floor
Beauty Salon/Barber Shop
Celebrate Ice Cream Parlor
Library
Themed Sunrooms
Walking Club
Dining Room
ActivitiesDaily Activities include Walking Club, Morning Exercise Group, Brain Teaser’s, Computer Lab Courses, and Reading Club
Specific ProgramsWeekly Recreation, Monthly Social Events
Religious Services2 Story Catholic Chapel, with non-denominational religious services daily & weekly
Volunteer Program

Dining & Nutrition

Food DescriptionDining Room – 3 chef prepared meals daily.

Contact Celebrate Senior Living Niles

Inspection History

In Illinois, the Department of Public Health, Office of Health Care Regulation conducts annual unannounced surveys to assess compliance with state and federal healthcare facility standards.

Since 2022 · 4 years of data 8 deficiencies 6 inspections

Inspection Scorecard Info This scorecard compares key inspection, deficiency, and complaint metrics at this facility against the Illinois state average. Metrics rated ≥15% worse than average are highlighted in red; those ≥15% better are highlighted in green.

Since 2022 vs. Illinois state average
Overall vs. IL average 3 Worse Metrics worse than Illinois average:
• Total deficiencies (14% above)
• Deficiencies per year (11% above)
• Deficiencies per inspection (44% above)
1 Better Metrics better than Illinois average:
• Total inspections (25% below)
Latest Inspection November 16, 2025 Complaint Original Investigation Inspection

Deficiencies Info Deficiencies are formal regulatory issues recorded during state inspections.

This FacilityIL Averagevs. IL Avg
Total deficiencies Info Formal regulatory issues recorded by inspectors across all inspection types. 87 This facility has 14% more total deficiencies than a typical Illinois nursing home (8 vs. IL avg 7).↑ 14% worse
Deficiencies per year Info Average deficiencies per year since 2022. 21.8 This facility has 11% more deficiencies per year than a typical Illinois nursing home (2 vs. IL avg 1.8).↑ 11% worse
Deficiencies per inspection Info Average deficiencies per inspection. 1.30.9 This facility has 44% more deficiencies per inspection than a typical Illinois nursing home (1.3 vs. IL avg 0.9).↑ 44% worse

Inspections Info State inspections evaluate whether the facility meets health and safety standards.

This FacilityIL Averagevs. IL Avg
Total inspections Info Combined count of all routine and focused inspections. Excludes complaint investigations. 68 This facility has 25% fewer total inspections than a typical Illinois nursing home (6 vs. IL avg 8).↓ 25% better

Health Inspection History

Inspections since 2022
Total health inspections 5

Illinois average 10.4


Last Health inspection on Oct 2024

Total health citations
9 Rank #11 / 172Health citations — State benchmarkedThis home is ranked 11th out of 172 homes in Illinois. Shows this facility's total health deficiency citations benchmarked to the Illinois State average, with a ranking across all 172 IL facilities. Lower citation counts earn a better rank.Rankings are based only on facilities in Illinois that report data for that category. Facilities without available data are excluded from the ranking.Click the rank badge to see the full State ranking.Click here to see the full State ranking.

Illinois average 36.8

Citations per inspection
1.8 Rank #6 / 172Citations per inspection — State benchmarkedThis home is ranked 6th out of 172 homes in Illinois. Shows average deficiency citations per CMS inspection for this facility versus the Illinois mean across 172 facilities with citation data. Lower is better.Rankings are based only on facilities in Illinois that report data for that category. Facilities without available data are excluded from the ranking.Click the rank badge to see the full State ranking.Click here to see the full State ranking.

Illinois average 3.68


Health citations are formal notices following inspections when they fail to comply with safety and care standards.

5 of 9 citations resulted from standard inspections; and 4 of 9 resulted from complaint investigations.

Breakdown of citation severity (last 4 years)
Critical health citations
0
100% better than Illinois average

Illinois average: 0.7


Serious health citations
2
44% better than Illinois average

Illinois average: 3.6

0 critical citations Illinois average: 0.7

2 serious citations Illinois average: 3.6

7 moderate citations Illinois average: 32

0 minor citations Illinois average: 0.5
Citations history (last 4 years)
Infection Control moderate citation Oct 31, 2024
Corrected

Pharmacy moderate citation Oct 31, 2024
Corrected

Quality of Care serious citation Oct 31, 2024
Corrected

Care Planning moderate citation Oct 31, 2024
Corrected

Staffing Data

Reporting period: October 1 – December 31, 2025 (Q4 2025). Source: CMS Payroll-Based Journal report.

Total staff 92
Employees 85
Contractors 7
Staff to resident ratio 1.84 : 1
0% compared with Illinois average
Illinois average ratio: 1.80 : 1 Illinois average ratio: 1.80 : 1See full Illinois ranking
Avg staff/day 39
Average shift 7.5 hours
0% compared with Illinois average
Illinois average: 7.6 hours Illinois average shift: 7.6 hoursSee full Illinois ranking
Total staff hours (quarter) 27,077

Nursing staff breakdown

Q4 2025 · Oct 1 – Dec 31 More info This data comes from the CMS Payroll-Based Journal report covering October 1 – December 31, 2025.
Registered Nurse

Manages medical care and health needs.

RN Staff Info All 13 RN Staff are full-time employees. No contractors work on this role. 13
Average shift length Info Average shift length. Calculated as total hours divided by days worked and average staff per day. 8.1 hours
Licensed Practical Nurse

Assists with medical care and medications.

LPN Staff Info All 8 LPN Staff are full-time employees. No contractors work on this role. 8
Average shift length Info Average shift length. Calculated as total hours divided by days worked and average staff per day. 7.6 hours
Certified Nursing Assistant

Helps with daily care and mobility.

CNA Staff Info All 36 CNA Staff are full-time employees. No contractors work on this role. 36
Average shift length Info Average shift length. Calculated as total hours divided by days worked and average staff per day. 7.8 hours

Contractor staffing

Q4 2025 · Oct 1 – Dec 31 More info This data comes from the CMS Payroll-Based Journal report covering October 1 – December 31, 2025.

Total hours from contractors

1.5%

412 contractor hours this quarter

Feeding Assistant: 2 Medical Director: 1 Nurse Practitioner: 1 Other Physician: 1 Occupational Therapy Aide: 1 Occupational Therapy Assistant: 1

Staff by category

Q4 2025 · Oct 1 – Dec 31 More info This data comes from the CMS Payroll-Based Journal report covering October 1 – December 31, 2025.
Certified Nursing Assistant3603613,82892100%7.8
Registered Nurse130133,72792100%8.1
Licensed Practical Nurse8082,55692100%7.6
Other Dietary Services Staff6062,1879199%7.5
Physical Therapy Aide3036488997%7
Speech Language Pathologist3035796672%6.8
Nurse Practitioner1125396065%7.6
Physical Therapy Assistant4045146672%7.6
Administrator1014806065%8
RN Director of Nursing1014405560%8
Clinical Nurse Specialist2024346368%6.6
Diagnostic X-ray Services Staff1014245358%8
Respiratory Therapy Technician4042237784%2.7
Qualified Social Worker2021924852%3.8
Feeding Assistant0221843942%4.7
Medical Director011421415%3
Occupational Therapy Aide011381011%3.8
Other Physician011261314%2
Occupational Therapy Assistant0111567%2.5
36 Certified Nursing Assistant
% of Days 100%
13 Registered Nurse
% of Days 100%
8 Licensed Practical Nurse
% of Days 100%
6 Other Dietary Services Staff
% of Days 99%
3 Physical Therapy Aide
% of Days 97%
3 Speech Language Pathologist
% of Days 72%
2 Nurse Practitioner
% of Days 65%
4 Physical Therapy Assistant
% of Days 72%
1 Administrator
% of Days 65%
1 RN Director of Nursing
% of Days 60%
2 Clinical Nurse Specialist
% of Days 68%
1 Diagnostic X-ray Services Staff
% of Days 58%
4 Respiratory Therapy Technician
% of Days 84%
2 Qualified Social Worker
% of Days 52%
2 Feeding Assistant
% of Days 42%
1 Medical Director
% of Days 15%
1 Occupational Therapy Aide
% of Days 11%
1 Other Physician
% of Days 14%
1 Occupational Therapy Assistant
% of Days 7%

Penalties and fines

Includes penalties issued in 2024

Federal penalties imposed by CMS for regulatory violations, including civil money penalties (fines) and denials of payment for new Medicare/Medicaid admissions.

Source: CMS Penalties Database (Data as of Jan 2026)

Total fines amount $41K Rank #99 / 173Federal fines — State benchmarkedThis home is ranked 99th out of 173 homes in Illinois. Shows this facility's cumulative CMS federal fine dollars versus the Illinois average among facilities with fines, and where it ranks among 173 facilities in the pool. Lower total dollars mean a better rank.Rankings are based only on facilities in Illinois that report data for that category. Facilities without available data are excluded from the ranking.Click the rank badge to see the full State ranking.Click here to see the full State ranking.
71% lower than Illinois average

Illinois average: $143K

Number of fines 2
33% fewer fines than Illinois average

Illinois average: 3.0

Payment Denials Info Serious action where Medicare and/or Medicaid temporarily stops payments for new residents until issues are fixed. 0
100% fewer payment denials than Illinois average

Illinois average: 1.1

Fines amount comparison
This facility $41K
Illinois average $143K
Penalty History

Penalties are imposed by CMS for violations of federal nursing home regulations.

2 penalties in the past 3 years

Multiple penalties were reported in the last 3 years.

Civil Money Penalty Info Fines imposed for noncompliance, which can be assessed per day or per instance of violation. Oct 31, 2024
$32K
Civil Money Penalty Info Fines imposed for noncompliance, which can be assessed per day or per instance of violation. Jun 6, 2024
$9K

Last updated: Jan 2026

Quality of care over time

These measures show how residents usually do over time at this home, based on health outcomes and preventive care.

High-risk clinical events score Info A composite score based on pressure ulcers, falls with injury, weight loss, walking ability decline, and activities of daily living decline. 15.6
61% worse than Illinois average

Illinois average: 9.7

Functional decline score Info A composite score based on activities of daily living decline, walking ability decline, and incontinence. 31.4
69% worse than Illinois average

Illinois average: 18.6

Long-stay resident measures
Significantly below average Info CMS star rating based on long-stay quality measure performance. 5 stars = significantly above average, 1 star = significantly below average.
Need for Help with Daily Activities Increased Info Percent of long-stay residents whose need for help with daily activities has increased 30.0%
94% worse than Illinois average

Illinois average: 15.5%

Walking Ability Worsened Info Percent of long-stay residents whose ability to move independently worsened 33.9%
84% worse than Illinois average

Illinois average: 18.4%

Low Risk Residents with Bowel/Bladder Incontinence Info Percent of low risk long-stay residents who lose control of their bowels or bladder 30.3%
40% worse than Illinois average

Illinois average: 21.6%

Falls with Major Injury Info Percent of long-stay residents experiencing one or more falls with major injury 4.1%
23% worse than Illinois average

Illinois average: 3.4%

High Risk Residents with Pressure Ulcers Info Percent of long-stay high risk residents with pressure ulcers 3.2%
39% better than Illinois average

Illinois average: 5.3%

Urinary Tract Infection Info Percent of long-stay residents with a urinary tract infection 3.7%
103% worse than Illinois average

Illinois average: 1.8%

Lost Too Much Weight Info Percent of long-stay residents who lose too much weight 6.6%
In line with Illinois average

Illinois average: 6.5%

Depressive Symptoms Info Percent of long-stay residents who have depressive symptoms 74.9%
56% worse than Illinois average

Illinois average: 48.1%

Antipsychotic Use Info Percent of long-stay residents who received an antipsychotic medication 21.0%
In line with Illinois average

Illinois average: 20.2%

Pneumococcal Vaccine Info Percent of long-stay residents assessed and appropriately given the pneumococcal vaccine 97.7%
9% better than Illinois average

Illinois average: 89.2%

Influenza Vaccine Info Percent of long-stay residents assessed and appropriately given the seasonal influenza vaccine 100.0%
9% better than Illinois average

Illinois average: 91.6%

Hospitalizations per 1,000 days Info Number of hospitalizations per 1,000 long-stay resident days. 4.79
135% worse than Illinois average

Illinois average: 2.04

ED visits per 1,000 days Info Number of outpatient emergency department visits per 1,000 long-stay resident days. 2.10
7% better than Illinois average

Illinois average: 2.25

Short-stay resident measures
Significantly above average Info CMS star rating based on short-stay quality measure performance. 5 stars = much above average, 1 star = much below average.
Pneumococcal Vaccine Info Percent of short-stay residents assessed and appropriately given the pneumococcal vaccine 63.3%
7% worse than Illinois average

Illinois average: 68.3%

Antipsychotic medication increase Info Percent of short-stay residents who newly received an antipsychotic medication 0.0%
100% better than Illinois average

Illinois average: 2.3%

Influenza Vaccine Info Percent of short-stay residents assessed and appropriately given the seasonal influenza vaccine 78.1%
24% better than Illinois average

Illinois average: 63.0%

Re-hospitalized after SNF stay Info Percentage of short-stay residents who were re-hospitalized after their nursing home admission. 21.7%
17% better than Illinois average

Illinois average: 26.2%

Emergency department visits Info Percentage of short-stay residents who had an outpatient emergency department visit. 7.7%
45% better than Illinois average

Illinois average: 14.0%

Falls with major injury Info Percentage of SNF residents who experience falls with major injury during their stay. 1.8%
136% worse than Illinois average

Illinois average: 0.8%

Ability to care for self at discharge Info Percentage of residents at or above expected ability to care for themselves at discharge. 67.6%
26% better than Illinois average

Illinois average: 53.7%

Successful return to home or community Info Rate of successful return to home or community from a skilled nursing facility. 54.0%
7% better than Illinois average

Illinois average: 50.6%

Breakdown by payment type

Medicare

59% of new residents, usually for short-term rehab.

Typical stay 1 - 2 months

Private pay

26% of new residents, often for short stays.

Typical stay 3 - 4 months

Medicaid

15% of new residents, often for long-term daily care.

Typical stay 2 - 3 years

Facility Characteristics

Source: CMS Long-Term Care Facility Characteristics (Data as of Jan 2026)

Total residents 50
Medicare
10
20% of residents
Medicaid
38
76% of residents
Private pay or other
2
4% of residents
Programs & Services
Residents Group

Residents meet regularly to discuss policies, care quality, and activities

CCRC

Part of a Continuing Care Retirement Community offering multiple care levels

Active Resident Council

Organized group of residents that meets regularly to discuss facility policies, quality of life, and activities.

Finances and operations

Based on CMS SNF Cost Report for fiscal year ending in 12/2023.

Nonprofit
Other Nonprofit
Net patient revenue Info Net patient revenue — what the home actually collects for resident care, after contractual allowances, bad debt and discounts are subtracted from its gross charges (CMS cost report, Worksheet G-3). It covers resident care only; money the home earns from other sources is shown separately as "Other income."
$8.5M
Net patient income Info Net patient income: net patient revenue minus the home's total operating expenses. A positive figure means it earns more from resident care than it spends to deliver it; a negative figure means the opposite. It excludes non-operating "other income."
-$964.9K
Nonprofit Other Nonprofit
Net patient revenue Info Net patient revenue — what the home actually collects for resident care, after contractual allowances, bad debt and discounts are subtracted from its gross charges (CMS cost report, Worksheet G-3). It covers resident care only; money the home earns from other sources is shown separately as "Other income."
$8.5M Rank #122 / 171Revenue — State benchmarkedThis home is ranked 122nd out of 171 homes in Illinois. Shows this facility's annual revenue compared to the Illinois average. Higher revenue generally means more resources for staffing and capital — read alongside Payroll %.Rankings are based only on facilities in Illinois that report data for that category. Facilities without available data are excluded from the ranking.Click the rank badge to see the full State ranking.Click here to see the full State ranking.
Net patient income Info Net patient income: net patient revenue minus the home's total operating expenses. A positive figure means it earns more from resident care than it spends to deliver it; a negative figure means the opposite. It excludes non-operating "other income."
-$964.9K
Other income Info Money the home earns outside of resident care — such as investments, grants, rentals and other non-operating sources (CMS cost report, Worksheet G-3). It is tracked separately from net patient revenue: it is not part of that figure, and it is not included in net patient income.
$2.3M
Payroll costs Info Staff salaries plus wage-related costs — benefits such as payroll taxes, health insurance and retirement — from the home's own accounting records (CMS cost report, Worksheet A). Contract or agency labor is counted separately, under other operating costs. Rank #126 / 171Payroll — State benchmarkedThis home is ranked 126th out of 171 homes in Illinois. Shows total annual staff payroll benchmarked to the Illinois average. Higher payroll investment relative to peers often signals better staffing and less reliance on cheaper contract labor.Rankings are based only on facilities in Illinois that report data for that category. Facilities without available data are excluded from the ranking.Click the rank badge to see the full State ranking.Click here to see the full State ranking.
$5.4M 63.3% of net patient revenue Info Payroll as a share of revenue: staff salaries and wage-related benefits divided by net patient revenue. A higher figure means more of each revenue dollar goes to staff pay. Rank #81 / 171Payroll % — State benchmarkedThis home is ranked 81st out of 171 homes in Illinois. Shows payroll as a percentage of revenue versus the Illinois average. Well-run Illinois facilities typically land around 54–67% — the top third Statewide. Below 25% may signal understaffing or heavy agency use — read with Staffing ratings.Rankings are based only on facilities in Illinois that report data for that category. Facilities without available data are excluded from the ranking.Click the rank badge to see the full State ranking.Click here to see the full State ranking.
Other operating costs Info Everything it costs to run the home apart from payroll — food, utilities, supplies, maintenance, contract labor and administration. Calculated as total operating expense minus payroll (staff salaries and wage-related benefits).
$4.1M
Total costs Info The home's total operating expense for the year — all the costs of running it, salaries included (CMS cost report, Worksheet G-3).
$9.5M

What does this home offer?

Housing options icon

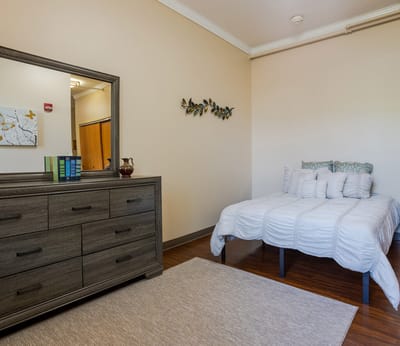
Housing Options: Studio / 1 Bed

Building type icon
Building type icon

Building Type: Mid-rise

Beauty services icon

Beauty Services

Recreational activities icon

Recreational Activities

Who this home usually serves

TYPE OF STAY

Mostly short-term rehab stays

Most residents typically stay for a few weeks or months before returning home or moving on.

Most new residents arrive under Medicare (59% of admissions), and a typical Medicare stay runs around 1 - 2 months.

Admissions
92 total

Coverage residents most often arrive under.

Medicare 59%
Private pay 26%
Medicaid 15%
Discharges
87 total

Coverage residents most often leave under.

Medicare 47%
Private pay 26%
Medicaid 26%

Places of interest near Celebrate Senior Living Niles

Address 0.8 miles from city center Info Estimated distance in miles from Niles's city center to Celebrate Senior Living Niles's address, calculated via Google Maps.

Calculate Travel Distance to Celebrate Senior Living Niles

Add your location

Address

Compare Nursing Homes around Cook County

The information below is reported by the Illinois Department of Public Health, Office of Health Care Regulation.

4 facilities compared · CMS & IL Dept. of Health data

St Joseph Home For the Elderly
NH
AL
CH
HC
IL
Palatine
49
Facility 49
IL AVG 86
Rank #301 / 426
53.2%
Facility 53.2%
IL AVG 69.3%
Rank #176 / 204
-23%
7.43
Facility 7.43
IL AVG 3.10
Rank #1 / 172
+63%+140%
$0
Facility $0
IL AVG $151.3k
Rank #1 / 173
5
Facility 5
IL AVG 36.8
Rank #3 / 172
5.0
Facility 5.0
IL AVG 3.7
Rank #148 / 172
-31-
69
Facility 69
IL AVG 51
Rank #159 / 648
Veronica Cantu---146189
Little Sisters of the Poor St. Mary’s Home
NH
AL
CH
HC
IL
Chicago (Lincoln Park)
76
Facility 76
IL AVG 86
Rank #195 / 426
58.3%
Facility 58.3%
IL AVG 69.3%
Rank #157 / 204
-16%
5.12
Facility 5.12
IL AVG 3.10
Rank #17 / 172
+37%+65%
$9.1k
Facility $9.1k
IL AVG $151.3k
Rank #72 / 173
21
Facility 21
IL AVG 36.8
Rank #45 / 172
5.3
Facility 5.3
IL AVG 3.7
Rank #154 / 172
145-
93
Facility 93
IL AVG 51
Rank #23 / 648
Claire Mccanless---146185
Celebrate Senior Living Niles
NH
AL
IL
MC
RC
Niles (North Newark Avenue)
59
Facility 59
IL AVG 86
Rank #268 / 426
89.7%
Facility 89.7%
IL AVG 69.3%
Rank #35 / 204
+29%
3.54
Facility 3.54
IL AVG 3.10
Rank #54 / 172
-1%+14%
$29.8k
Facility $29.8k
IL AVG $151.3k
Rank #99 / 173
9
Facility 9
IL AVG 36.8
Rank #11 / 172
1.8
Facility 1.8
IL AVG 3.7
Rank #6 / 172
249A+
60
Facility 60
IL AVG 51
Rank #233 / 648
Elevate Housing Foundation
$8.5M
Facility $8.5M
IL AVG $12.2M
Rank #122 / 171
$5.4M
Facility $5.4M
IL AVG $4.8M
Rank #126 / 171
63.3%
Facility 63.3%
IL AVG 44.3%
Rank #81 / 171
146176
Citadel at Saint Benedict
NH
NC
Niles (West Touhy Avenue)
135
Facility 135
IL AVG 86
Rank #64 / 426
87.5%
Facility 87.5%
IL AVG 69.3%
Rank #42 / 204
+26%
2.68
Facility 2.68
IL AVG 3.10
Rank #103 / 172
+23%-14%
$0
Facility $0
IL AVG $151.3k
Rank #1 / 173
27
Facility 27
IL AVG 36.8
Rank #65 / 172
4.5
Facility 4.5
IL AVG 3.7
Rank #138 / 172
2118-
79
Facility 79
IL AVG 51
Rank #109 / 648
-
$14.5M
Facility $14.5M
IL AVG $12.2M
Rank #50 / 171
$7.2M
Facility $7.2M
IL AVG $4.8M
Rank #68 / 171
49.8%
Facility 49.8%
IL AVG 44.3%
Rank #132 / 171
145741

Financial Assistance for
Nursing Home in Illinois

Celebrate Senior Living Niles is located in Niles, Illinois.
Here are the financial assistance programs available to residents in Illinois.

Get Financial aid guidance

Community Care Program

Illinois CCP

Age 60+
General Illinois resident, at risk of nursing home placement.
Income Limits (2025) ~$1,215/month individual
Asset Limits $17,500 individual, excludes home, car
IL

High demand in urban areas; waitlists possible.

Benefits
In-home care (3-5 hours/day) Adult day services ($65/day) Emergency home response systems ($30/month)

Illinois Respite Program

IL Respite (via NFCSP)

Age Caregiver of someone 60+ (or with dementia)
General Illinois resident.
Income Limits No strict limit; prioritizes low-income.
Asset Limits Not applicable.
IL

Limited slots; urban/rural balance.

Benefits
In-home respite (4-6 hours/day) Adult day care (~$65/day) Short-term facility care (up to 5 days)

Supportive Living Program (SLP)

Illinois Medicaid Supportive Living Program

Age 65+ or 22-64 with disability
General Illinois resident, Medicaid-eligible, needs moderate assistance (not nursing home-level).
Income Limits (2025) ~$2,829/month (300% FBR, individual); QIT allowed.
Asset Limits $2,000 (individual), $3,000 (couple) (excludes home, car).
IL

~200 SLP sites statewide; room/board not covered.

Benefits
Personal care (5-7 hours/day, e.g., bathing, mobility) Meals Housekeeping Medication management Respite (~240 hours/year)

Persons Who Are Elderly Waiver

Illinois Medicaid Elderly Waiver

Age 65+
General Illinois resident, Medicaid-eligible, nursing home-level care need.
Income Limits (2025) ~$2,829/month 300% FBR, individual
Asset Limits $2,000 (individual), $3,000 (couple).
IL

Part of HealthChoice Illinois; consumer-directed options available.

Benefits
Personal care (5-7 hours/day, e.g., dressing, eating) Homemaker Adult day care (~$60/day) Respite (240 hours/year) Home mods ($1,000 avg.)

Medicare Savings Program (MSP)

Illinois Medicare Savings Program

Age 65+ or disabled
General Illinois resident, Medicare Part A/B.
Income Limits (2025) ~$2,510/month (QMB), ~$3,380/month (SLMB), ~$3,598/month (QI)—individual.
Asset Limits $9,430 (individual), $14,130 (couple).
IL

Three tiers; no waitlist.

Benefits
Covers Part B premiums ($174.70/month) Deductibles ($240/year) Copays (~20%)

Optional State Supplementation (OSS)

Illinois Optional State Supplementation

Age 65+ or disabled
General Illinois resident, in approved facility, SSI recipient or low-income.
Income Limits (2025) ~$1,004/month including SSI
Asset Limits $2,000 (individual), $3,000 (couple).
IL

~$50-$500/month based on facility type.

Benefits
Cash (~$50-$500/month) for room/board in personal care homes or SLFs

VA Aid and Attendance (A&A) and Housebound Benefits

Illinois VA Aid and Attendance/Housebound

Age 65+ or disabled veteran/spouse
General Illinois resident, wartime service, need for ADL help (A&A) or homebound.
Income Limits (2025) Net income < ~$1,984/month (veteran with dependent, A&A); pension offsets income.
Asset Limits ~$155,356 net worth limit
IL

High veteran demand in urban/rural areas.

Benefits
Cash (~$1,433-$2,642/month veteran, ~$951-$1,318 spouse) for care costs (e.g., in-home, assisted living)

Frequently Asked Questions about Celebrate Senior Living Niles

What neighborhood is Celebrate Senior Living Niles in?

Celebrate Senior Living Niles is in the North Newark Avenue neighborhood of Niles.

Who is the owner of Celebrate Senior Living Niles?

The legal owner and operator of Celebrate Senior Living Niles is Elevate Saint Andrew Llc.

Is Celebrate Senior Living Niles in a walkable area?

Celebrate Senior Living Niles has a walk score of 60. Moderately walkable. Some errands can be accomplished on foot, with a mix of nearby amenities.

What is the license number of Celebrate Senior Living Niles?

According to IL state health department records, Celebrate Senior Living Niles's license number is 5106973.

When does Celebrate Senior Living Niles's license expire?

According to IL state health department records, Celebrate Senior Living Niles's license expires on August 1, 2026.

What is the occupancy rate at Celebrate Senior Living Niles?

Celebrate Senior Living Niles's occupancy is 90%.

What is the best email address for Celebrate Senior Living Niles?

The team at Celebrate Senior Living Niles can be reached at [email protected].

Guides for Better Senior Living

Care Cost Calculator: See Prices in Your Area

Nursing Home Data Explorer

Don’t Wait Too Long: 7 Red Flag Signs Your Parent Needs Assisted Living Now

The True Cost of Assisted Living in 2025 – And How Families Are Paying For It

Understanding Senior Living Costs: Pricing Models, Discounts & Financial Assistance